. 2016 Jan 12;23(1):113-27.
doi: 10.1016/j.cmet.2015.10.008. Epub 2015 Nov 19.

Autophagy in the CNS and Periphery Coordinate Lipophagy and Lipolysis in the Brown Adipose Tissue and Liver

Affiliations

Autophagy in the CNS and Periphery Coordinate Lipophagy and Lipolysis in the Brown Adipose Tissue and Liver

Nuria Martinez-Lopez et al. Cell Metab. .

Abstract

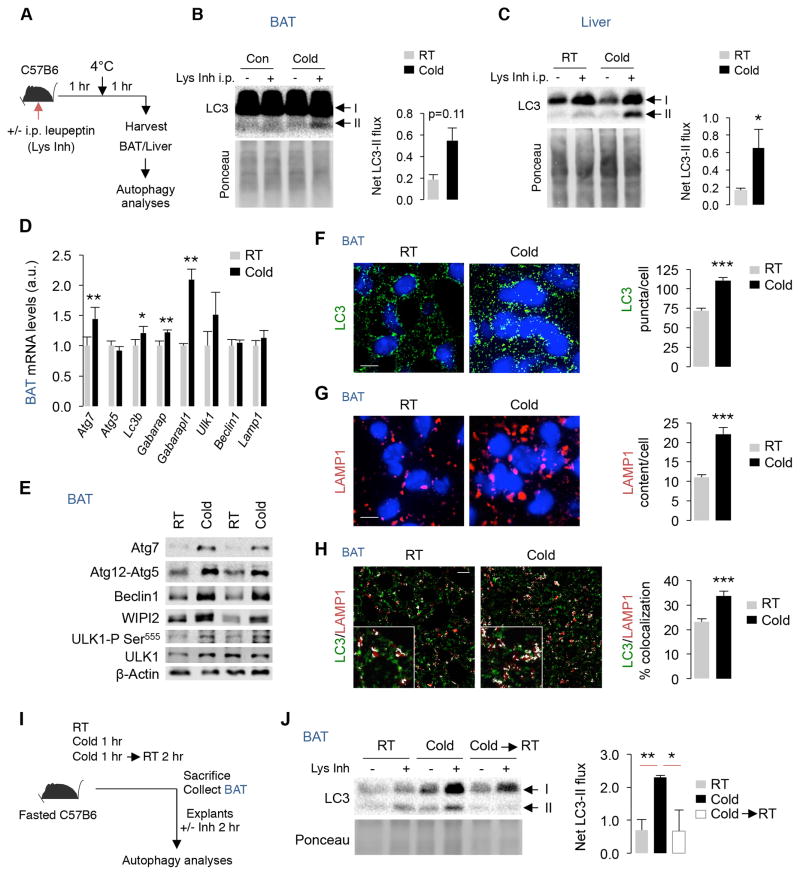
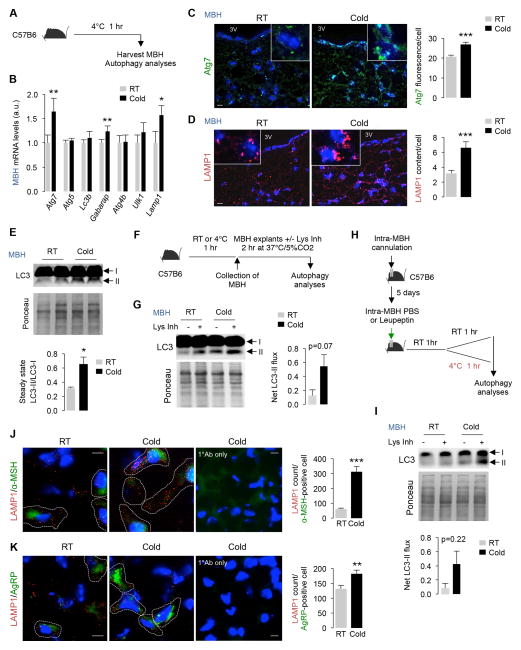
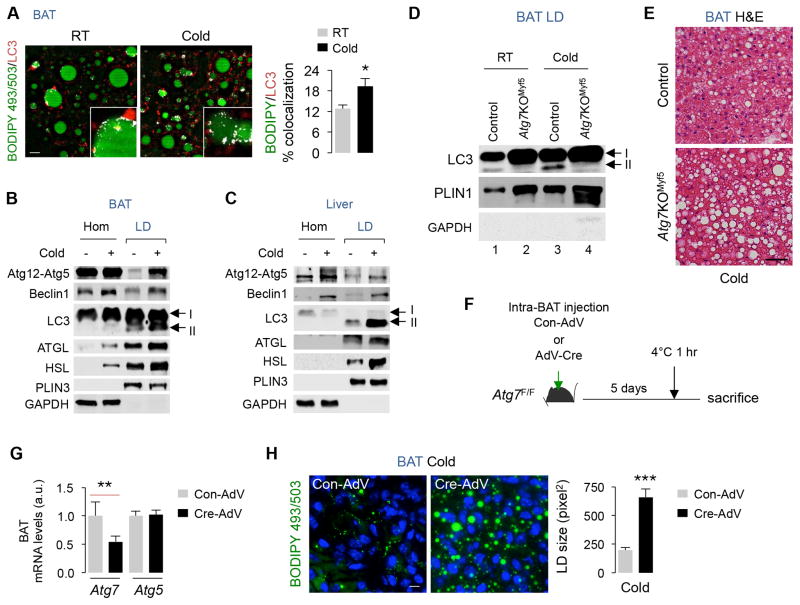
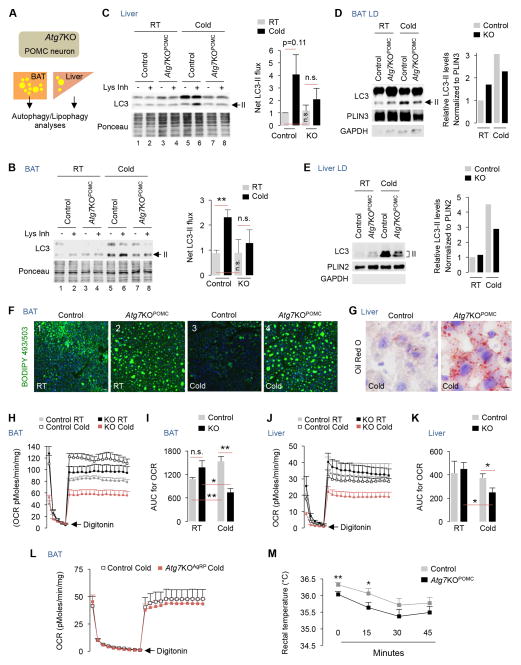
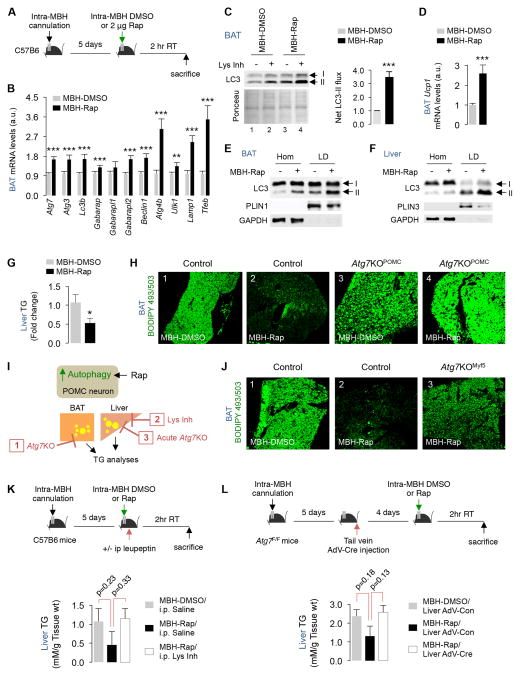
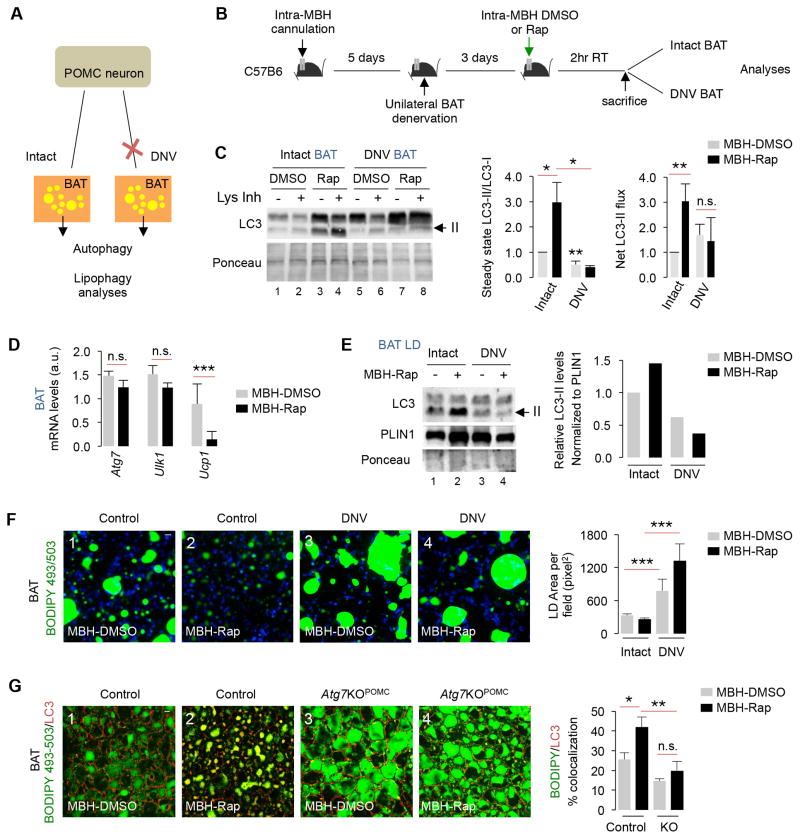
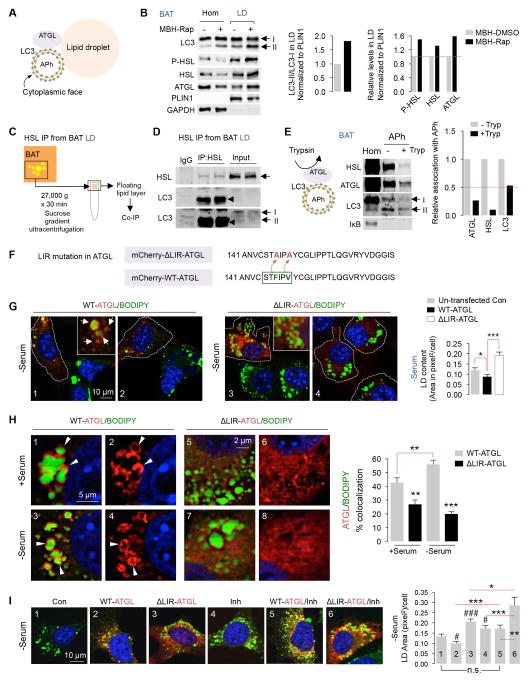
The integrative physiology of inter-organ communication in lipophagy regulation is not well understood. Lipophagy and the cytosolic lipases ATGL and HSL contribute to lipid droplet (LD) mobilization; however, whether autophagy proteins engage with lipases to promote lipid utilization remains unknown. Here, we show that cold induces autophagy in proopiomelanocortin (POMC) neurons and activates lipophagy in brown adipose tissue (BAT) and liver in mice. Targeted activation of autophagy in POMC neurons via intra-hypothalamic rapamycin is sufficient to trigger lipid utilization in room temperature-housed mice. Conversely, inhibiting autophagy in POMC neurons or in peripheral tissues or denervating BAT blocks lipid utilization. Unexpectedly, the autophagosome marker LC3 is mechanistically coupled to ATGL-mediated lipolysis. ATGL exhibits LC3-interacting region (LIR) motifs, and mutating a single LIR motif on ATGL displaces ATGL from LD and disrupts lipolysis. Thus, cold-induced activation of central autophagy activates lipophagy and cytosolic lipases in a complementary manner to mediate lipolysis in peripheral tissues.


Conflict of interest statement

The authors have no competing financial interests to declare.

Figures

Fig. 1
Fig. 1. Cold activates autophagy in BAT and liver
(A) Plan for in vivo LC3-II flux in room temperature (RT)-housed or 1 hr cold-exposed mice injected with intraperitoneal (i.p.) lysosomal inhibitor (Lys Inh) for 2 hr. (B–C) LC3 immunoblot (IB) in BAT and liver as described in A, n=3. (D) qPCR of indicated genes in BAT from RT and 1 hr cold-exposed 5–6 mo male mice, n=4. (E) IB, and (F–H) immunofluorescence (IF) for indicated proteins in BAT from RT and 1 hr cold-exposed 5–6 mo male mice, n=3. Scale: 10 μm. White pixels in H indicate colocalization. (I) Plan for LC3-II flux in BAT explants from RT-housed and cold-exposed mice, and from a subset of cold-exposed mice returned to RT for 2 hr, n=3. (J) LC3-II flux in BAT as described in I, n=3. Bars are mean±sem. *P<0.05, **P<0.01, ***P<0.001; Student’s t-test. Ponceau is loading control. See also Figure S1.
Fig. 2
Fig. 2. Cold activates hypothalamic autophagy
(A) Plan for autophagy analyses in mediobasal hypothalamus (MBH) from RT-housed or 1 hr cold-exposed mice. (B) qPCR of indicated genes, (C–D) immunofluorescence (IF) for Atg7 and LAMP1, and (E) immunoblot (IB) for LC3 in MBH from RT-housed and 1 hr cold-exposed 5–6 mo male mice, n=3, 3V=3rd ventricle. Scale: 10 μm. (F) Plan, and (G) IB for LC3-II in MBH explants from RT-housed and 1 hr cold-exposed 5–6 mo male mice treated or not with lysosomal inhibitor (Lys Inh) for 2 hr, n=3. (H) Plan, and (I) IB for LC3-II in MBH from C57B6 mice cannulated and pre-treated with leupeptin or PBS as in 2H, n=3. (J–K) IF for indicated proteins in MBH from RT and 1 hr cold-exposed 6 mo male mice, n=3–4. Bars are mean±s.e.m. *P<0.05, **P<0.01, ***P<0.001; Student’s t-test. Scale: 10 μm. Ponceau is loading control. See also Figure S2.
Fig. 3
Fig. 3. Cold-induced autophagy degrades LD in BAT
(A) Immunofluorescence (IF) for LC3 and BODIPY 493/503 in BAT, n=3, and (B–C) immunoblots (IB) for indicated proteins in BAT and liver homogenates (Hom) and LD from 5–6 mo male RT-housed and 1 hr cold-exposed mice (5 livers and 5 BAT were pooled per sample per experiment, n=2). (D) IB for indicated proteins in BAT LD from RT-housed or 1 hr cold-exposed control and Atg7KOMyf5 mice (4–5 BAT were pooled per sample per experiment, n=2). (E) Hematoxylin/eosin (H&E)-stained BAT from 1 hr cold-exposed Con and Atg7KOMyf5 mice. (F) Plan to inject Control adenovirus (Con-AdV) or Cre-expressing adenoviruses (Cre-AdV) in BAT from Atg7F/F mice, and (G) qPCR for BAT Atg7 and Atg5, and (H) BODIPY 493/503 staining in BAT from Atg7F/F mice injected with Con-AdV or Cre-AdV, n=3. Scale: 10 μm. Bars are mean±s.e.m. *P<0.05, **P<0.01, ***P<0.001; Student’s t-test. See also Figure S3.
Fig. 4
Fig. 4. Blocking POMCergic autophagy inhibits lipophagy
(A) Plan to analyze autophagy in BAT/liver. (B) Immunoblot (IB) for LC3-II in BAT, and (C) liver explants from RT-housed and 1 hr cold-exposed control and Atg7KOPOMC mice treated or not with Lys Inh for 2 hr, n=3. (D) IB for indicated proteins in BAT LD, and (E) liver LD from RT-housed and 1 hr cold-exposed control and Atg7KOPOMC mice (5 livers and 5 BAT were pooled per sample per experiment, n=2). (F) BODIPY 493/503 staining in BAT from RT-housed and 1 hr cold-exposed control and Atg7KOPOMC mice, n=3. (G) Oil Red O staining in liver from 1 hr cold-exposed control and Atg7KOPOMC mice, n=3. (H–I) BAT and (J–K) liver oxygen consumption rates (OCR) and AUC (area under curve) from 5–6 mo RT-housed and 1 hr cold-exposed Atg7KOPOMC male mice, n=4. (L) OCR in BAT from 1 hr cold-exposed male control and Atg7KOAgRP male mice, n=3. (M) Rectal temperature in control and Atg7KOPOMC male mice at RT and after 15 min and 30 min of cold exposure, n=5. Bars are mean±s.e.m. *P<0.05, **P<0.01; Student’s t-test. Ponceau is loading control. See also Figure S4.
Fig. 5
Fig. 5. Stimulating hypothalamic autophagy activates lipophagy in BAT/liver
(A) Plan for mediobasal hypothalamus (MBH) cannulation and intra-MBH injections of DMSO or rapamycin (Rap) for 2 hr at RT. (B) qPCR of indicated genes, (C) Immunoblot (IB) for LC3 in presence or absence of lysosomal inhibitor (Lys Inh), (D) Ucp1 expression, and (E–F) IB for indicated proteins in Hom/LD fractions from indicated tissues from intra-MBH DMSO or Rap treated mice. (5 BAT pads pooled per sample per experiment, n=2). (G) Liver triglycerides, and (H) BODIPY 493/503 staining in BAT from intra-MBH DMSO or Rap-injected 6 mo male control and Atg7KOPOMC mice, n=5. (I) Plan for blocking autophagy (Atg7KO) or lysosomal function (Lys Inh) in BAT or liver followed by intra-MBH administration of DMSO or Rap. (J) BODIPY staining in BAT from intra-MBH DMSO and Rap-injected 4 mo male control or Atg7KOMyf5 mice, n=4. (K) Plan and analyses of liver triglycerides in mice pretreated or not with Lys Inh i.p. for 2 hr or (L) subjected to tail vein AdV-Con or AdV-Cre injections to deplete Atg7 and then exposed to intra-MBH DMSO or Rap, n=4. Bars are mean±s.e.m. *P<0.05, **P<0.01, ***P<0.001; Student’s t-test. Ponceau is loading control. See also Figure S5.
Fig. 6
Fig. 6. Lipophagy failure in denervated BAT
(A) One BAT pad in each mouse was denervated (DNV), and DNV and contralateral intact BAT pad were analyzed for autophagy. (B) MBH cannulation, and intra-MBH DMSO or Rap injections for 2 hr and autophagy analyses in intact and DNV BAT from intra-MBH DMSO or Rap-injected mice. (C) Immunoblot (IB) for LC3, and quantification for LC3-II/LC3-I ratios, and net LC3-II flux in intact and DNV BAT from intra-MBH DMSO or Rap-injected 5–6 mo male mice, n=4. (D) qPCR for indicated genes in intact and DNV BAT from intra-MBH Rap-injected 5–6 mo male mice, n=3–5. (E) IB for LC3 and quantification for LC3-II/LC3-I ratios in LD from intact and DNV BAT from intra-MBH DMSO or Rap-injected 5-6 mo male mice (5 BAT pads pooled per sample per experiment, n=2). (F) BODIPY staining in intact and DNV BAT from intra-MBH DMSO or Rap-injected 5–6 mo mice, n=3. (G) Staining for BODIPY and LC3 in BAT from intra-MBH DMSO or Rap-injected 5–6 mo male Con and Atg7KOPOMC mice, n=3. Bars are mean±s.e.m. *P<0.05, **P<0.01, ***P<0.001; Student’s t-test. Ponceau is loading control.
Fig. 7
Fig. 7. LIR motifs on ATGL regulate lipolysis
(A) Autophagosomes (APh) facilitate localization of ATGL to LD. (B) Immunoblots (IB) for indicated proteins in BAT homogenates (Hom) and LD from intra-MBH DMSO or Rap-injected mice. Quantifications for LC3-II/LC3-I and indicated proteins in LD normalized to PLIN1 are shown (5 BAT pads pooled per sample per experiment, n=2). BAT Hom/LD samples in Fig 5E and Fig 7B originate from the same experiment. (C) Plan for co-immunoprecipitation (IP) from LD fractions. (D) Co-IP of HSL and IB for indicated proteins in BAT LD from RT-housed control mice, n=2. Duplicate samples are shown. Two different LC3 exposures are shown. (E) APh from BAT pooled from 3 cold-exposed mice subjected to LC3 trypsin protection assay, and IB for indicated proteins in Hom and APh fractions, n=2. (F) Point mutations (F147A, V150A) to inactivate LIR motif on ATGL (ΔLIR-ATGL). (G) Direct fluorescence (DF) for mCherry/BODIPY 493/503 in 6 hr (0.25 mM) oleic acid (OA)-treated NIH3T3 cells expressing mCherry-WT-ATGL or ΔLIR-ATGL in absence of serum for 6 hr. White arrows indicate ATGL/BODIPY association. Dotted lines outline transfected cells. (H) DF for mCherry/BODIPY in 6 hr OA-treated NIH3T3 cells expressing mCherry-WT-ATGL or ΔLIR-ATGL in presence/absence of serum for 6 hr. White arrowheads indicate ATGL/BODIPY association. (I) DF for mCherry/BODIPY in 6 hr serum-starved NIH3T3 cells expressing mCherry-WT-ATGL or ΔLIR-ATGL treated with OA −/+ lysosomal inhibitors (Inh) for 6 hr. At least 40 cells analyzed from n=3. Bars: mean±s.e.m. *P<0.05, **P<0.01, ***P<0.001, (#P<0.05, ###P<0.001 compared to panel 1 in F); Student’s t-test. See also Figure S6.

References

    1. Belgardt BF, Okamura T, Bruning JC. Hormone and glucose signalling in POMC and AgRP neurons. The Journal of physiology. 2009;587:5305–5314. - PMC - PubMed
    1. Birgisdottir AB, Lamark T, Johansen T. The LIR motif - crucial for selective autophagy. Journal of cell science. 2013;126:3237–3247. - PubMed
    1. Blouet C, Jo YH, Li X, Schwartz GJ. Mediobasal hypothalamic leucine sensing regulates food intake through activation of a hypothalamus-brainstem circuit. The Journal of neuroscience : the official journal of the Society for Neuroscience. 2009;29:8302–8311. - PMC - PubMed
    1. Cannon B, Nedergaard J. Brown adipose tissue: function and physiological significance. Physiological reviews. 2004;84:277–359. - PubMed
    1. Cao WH, Madden CJ, Morrison SF. Inhibition of brown adipose tissue thermogenesis by neurons in the ventrolateral medulla and in the nucleus tractus solitarius. American journal of physiology. Regulatory, integrative and comparative physiology. 2010;299:R277–290. - PMC - PubMed

Publication types

MeSH terms

LinkOut - more resources