. 2016 Feb 19;291(8):4091-106.
doi: 10.1074/jbc.M115.708909. Epub 2015 Dec 23.

Esophageal Squamous Cell Carcinoma Cells Modulate Chemokine Expression and Hyaluronan Synthesis in Fibroblasts

Affiliations

Esophageal Squamous Cell Carcinoma Cells Modulate Chemokine Expression and Hyaluronan Synthesis in Fibroblasts

Inga Kretschmer et al. J Biol Chem. .

Abstract

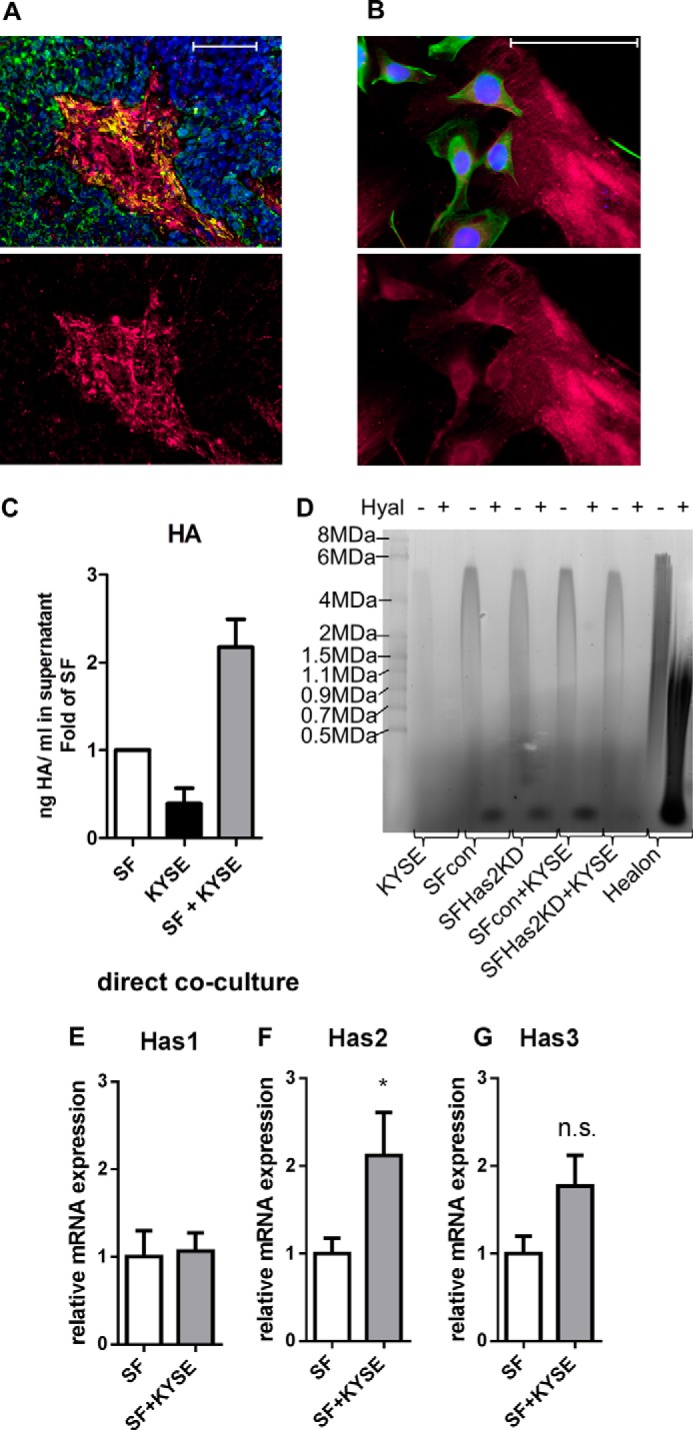
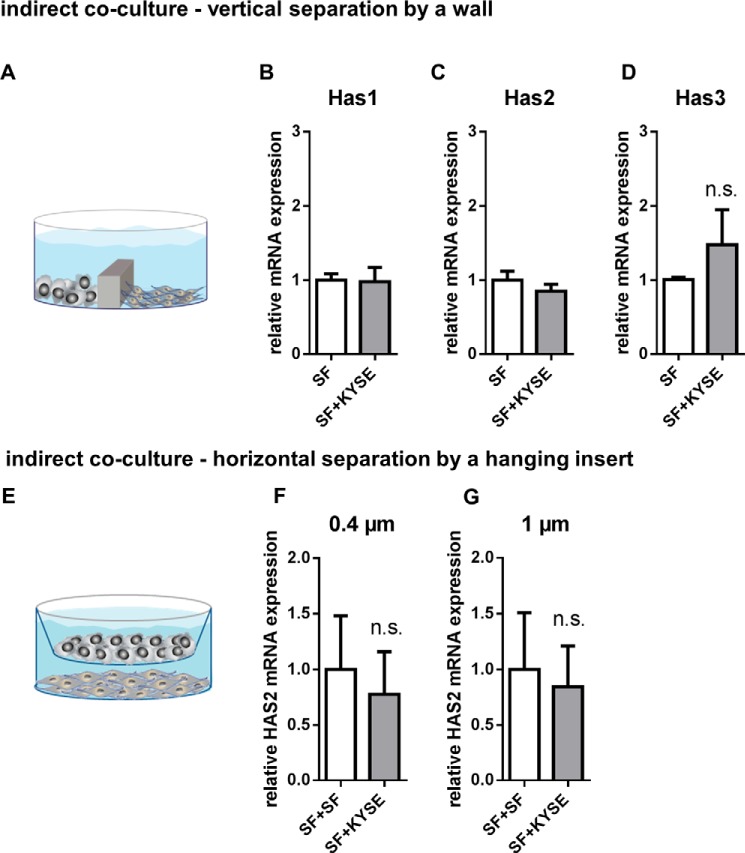
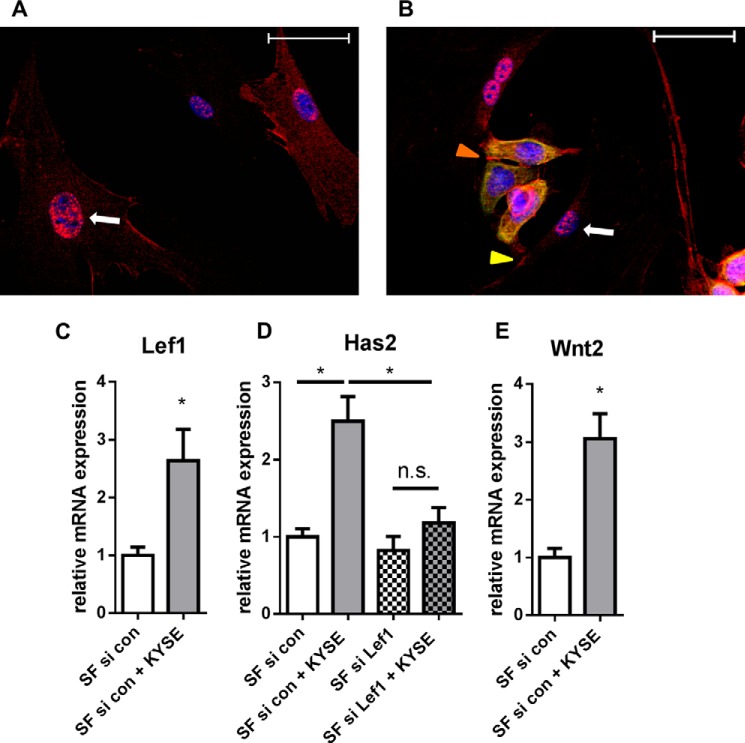
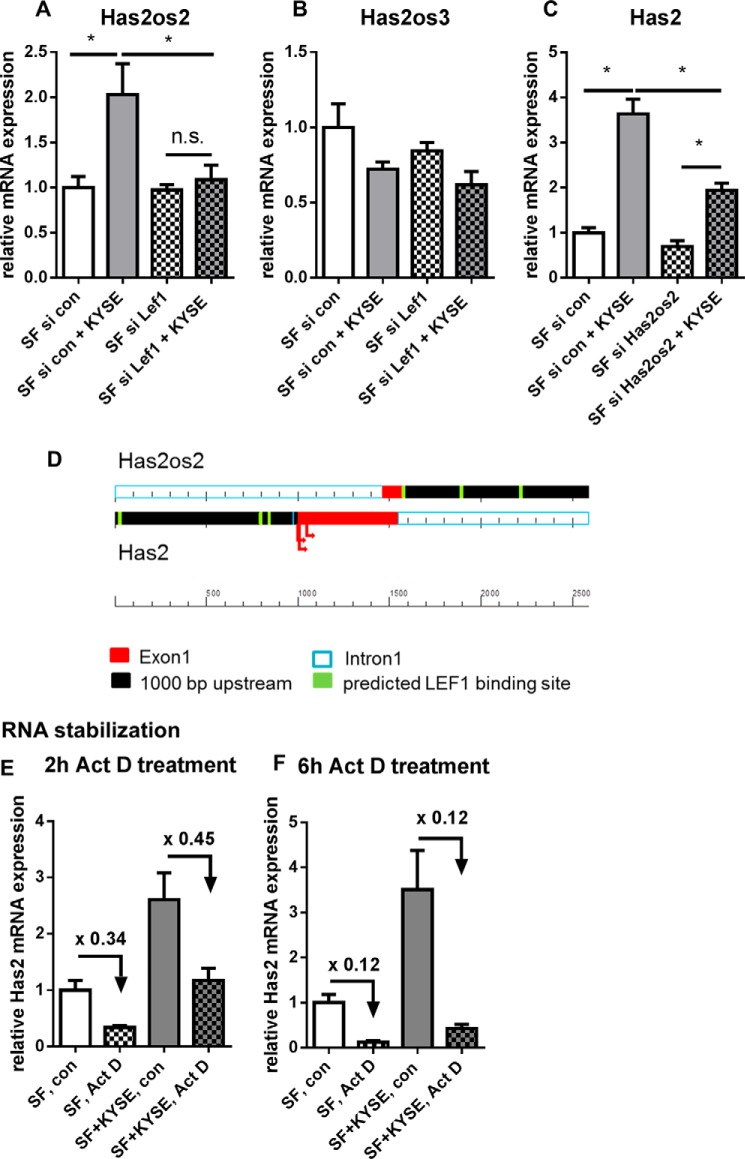
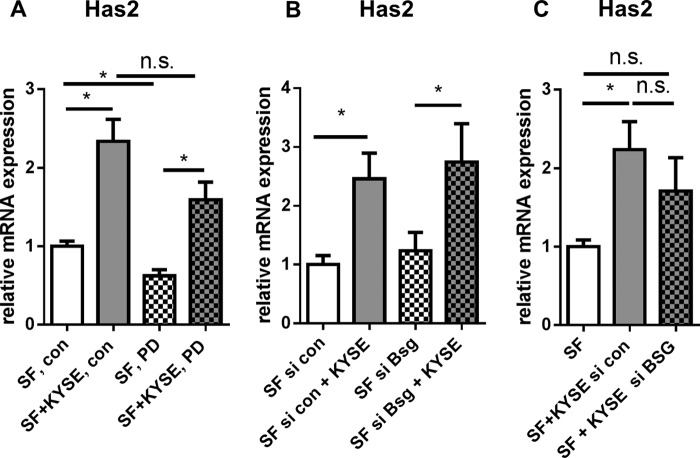
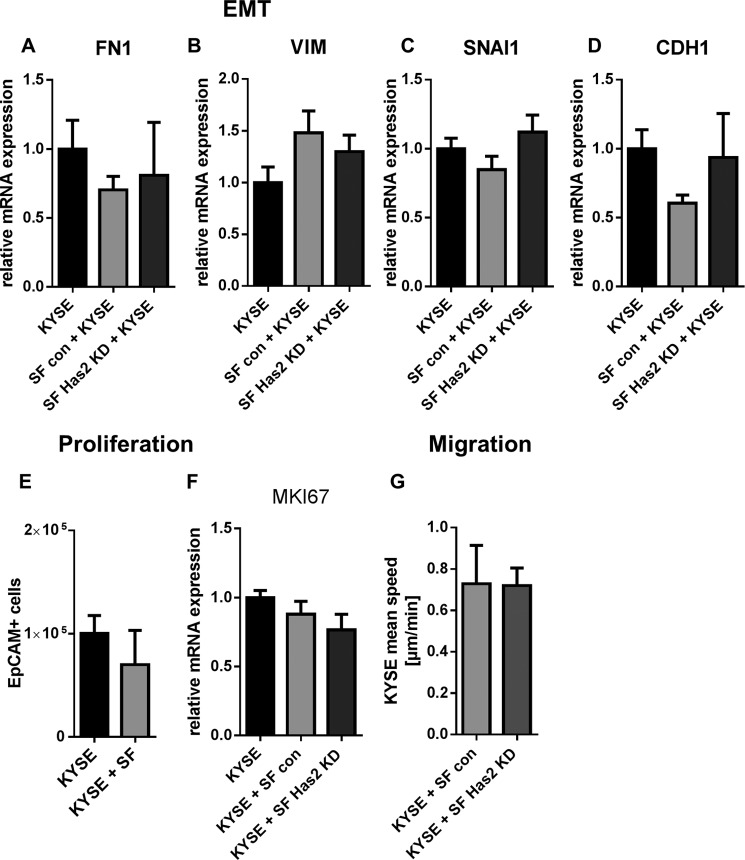
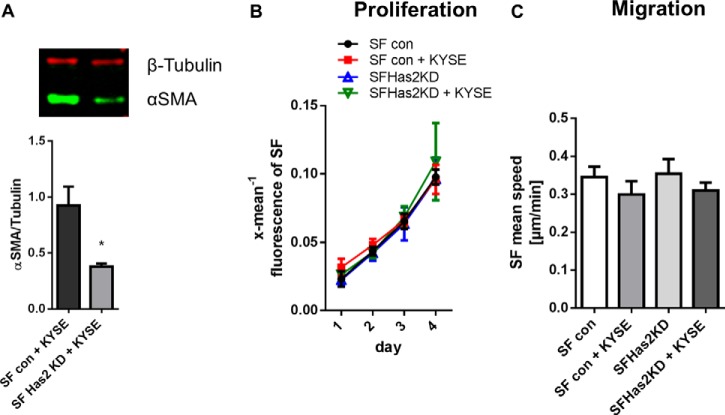
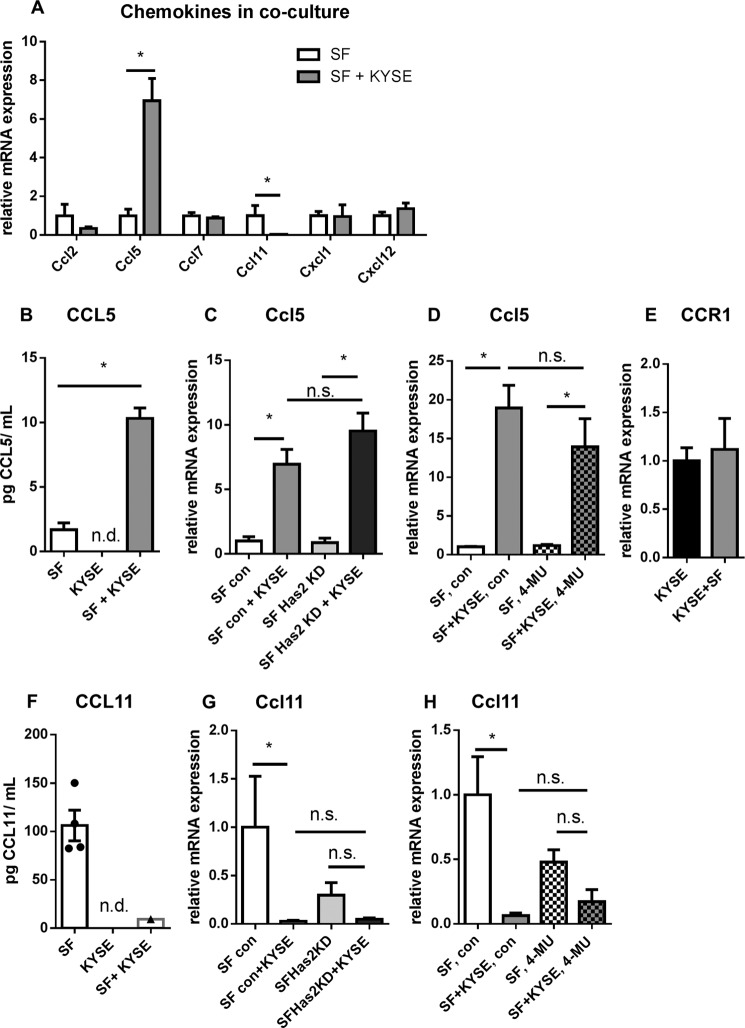
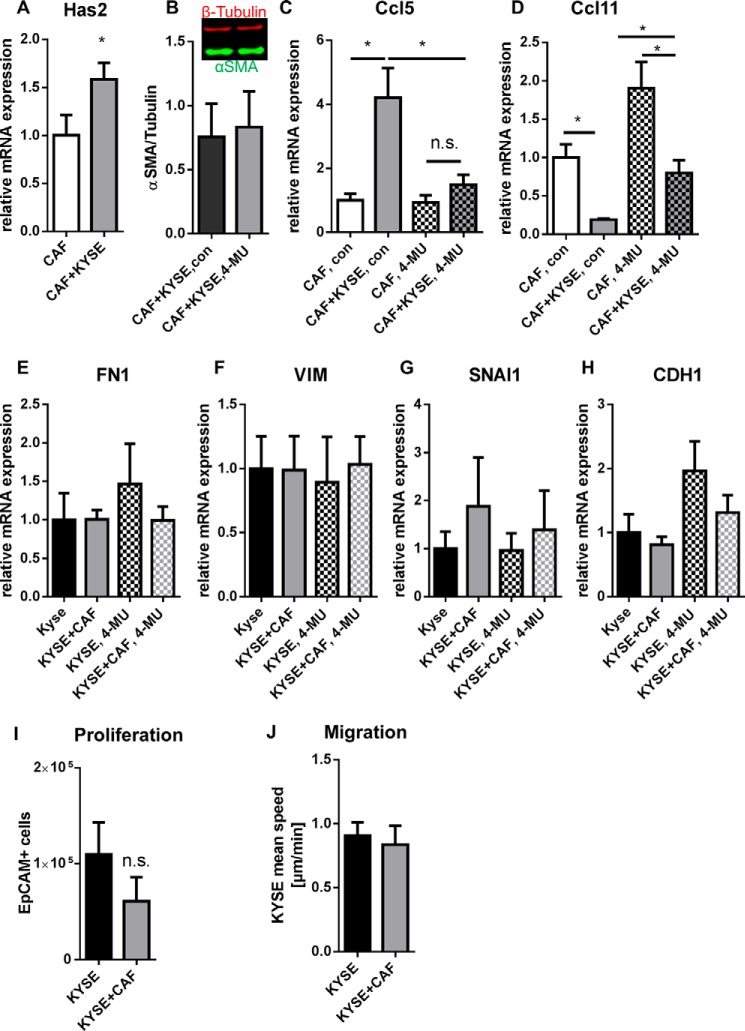
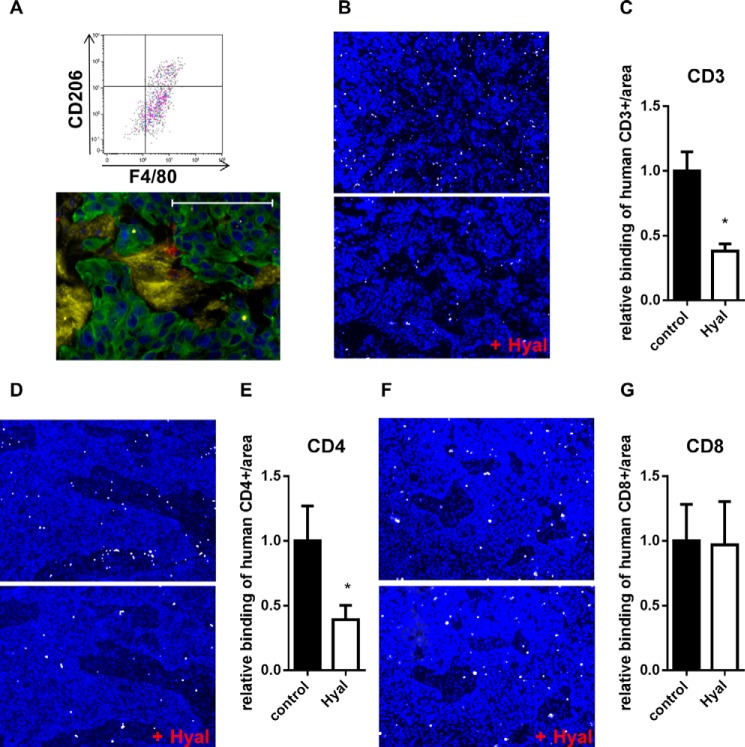
The aim of this study was to characterize the interaction of KYSE-410, an esophageal squamous cell carcinoma cell line, and fibroblasts with respect to the extracellular matrix component hyaluronan (HA) and chemokine expression. KYSE-410 cells induced the mRNA expression of HA synthase 2 (Has2) in normal skin fibroblasts (SF) only in direct co-cultures. Parallel to Has2 mRNA, Has2 antisense RNA (Has2os2) was up-regulated in co-cultures. Knockdown of LEF1, a downstream target of Wnt signaling, abrogated Has2 and Has2os2 induction. After knockdown of Has2 in SF, significantly less α-smooth muscle actin expression was detected in co-cultures. Moreover, it was investigated whether the phenotype of KYSE-410 was affected in co-culture with SF and whether Has2 knockdown in SF had an impact on KYSE-410 cells in co-culture. However, no effects on epithelial-mesenchymal transition markers, proliferation, and migration were detected. In addition to Has2 mRNA, the chemokine CCL5 was up-regulated and CCL11 was down-regulated in SF in co-culture. Furthermore, co-cultures of KYSE-410 cells and cancer-associated fibroblasts (CAF) were investigated. Similar to SF, Has2 and Ccl5 were up-regulated and Ccl11 was down-regulated in CAF in co-culture. Importantly and in contrast to SF, inhibiting HA synthesis by 4-methylumbelliferone abrogated the effect of co-culture on Ccl5 in CAF. Moreover, HA was found to promote adhesion of CD4(+) but not CD8(+) cells to xenogaft tumor tissues. In conclusion, direct co-culture of esophageal squamous cell carcinoma and fibroblasts induced stromal HA synthesis via Wnt/LEF1 and altered the chemokine profile of stromal fibroblasts, which in turn may affect the tumor immune response.

Keywords: CCL11; CCL5; cancer; cell-cell interaction; chemokine; fibroblast; hyaluronan.


Figures

FIGURE 1.
FIGURE 1.
Direct co-culture of KYSE-410 cells and fibroblasts resulted in an HA-rich environment. A, fluorescent staining of HA (magenta), αSMA (yellow), and CK-18 (green) in KYSE-410 xenograft tumors. Scale bar, 100 μm. Bottom, HA staining alone. B, fluorescent staining of HA (magenta) in cell culture. KYSE-410 cells are labeled in green (CK-18). Scale bar, 100 μm. Bottom, HA staining alone. C, HA secreted into the supernatant of monocultures and co-cultures of SF and KYSE-410 cells after 24 h determined by an ELISA-like assay; n = 4. D, representative HA-agarose gel of supernatants of mono- and co-cultures with KYSE-410 cells and SF with and without Has2 knockdown conditioned for 48 h. E–G, Has1, -2, and -3 mRNA expression in SF after 24 h of monoculture or direct co-culture with KYSE-410 cells (n = 7). Error bars, S.E. *, p < 0.05; n.s., not significant.
FIGURE 2.
FIGURE 2.
Direct cell-cell contact was required for increased Has2 mRNA expression. A, scheme showing the set-up of indirect co-culture experiments where KYSE-410 cells and SF were separated by a wall but were able to exchange soluble factors by diffusion. B–D, Has1, -2, and -3 mRNA expression in SF after 24 h of indirect monoculture or co-culture (n = 3 for Has1, n = 4 for Has2 and -3). E, scheme showing a set-up of indirect co-culture using inserts. F, Has2 mRNA expression in SF separated from KYSE-410 cells by a membrane with 0.4-μm pore size, n = 4. G, Has2 mRNA expression in SF separated from KYSE-410 cells by a membrane with 1-μm pore size (n = 4). Data are presented as mean ± S.E. (error bars); n.s., not significant.
FIGURE 3.
FIGURE 3.
β-catenin/LEF1 signaling was involved in Has2 mRNA up-regulation. A, immunocytochemistry of β-catenin (red) in SF monoculture. Nuclear DAPI staining is presented in blue. Scale bar, 50 μm. B, immunocytochemistry of β-catenin (red) and CK-18 (green) in co-culture. White arrow, positive β-catenin staining in the nuclear region (blue) in SF. Orange arrowhead, cell-cell contacts of KYSE-410 cells; yellow arrowhead, cell-cell contacts of KYSE-410 cells and SF. Scale bar, 50 μm. C, Lef1 mRNA expression in SF after 24 h of monoculture or direct co-culture (n = 4). D, Has2 mRNA expression in monocultures or direct co-cultures after transfection with siRNA directed against Lef1 and control siRNA (n = 4). E, Wnt2 mRNA expression in SF in monocultures or direct co-cultures (n = 4). Data are presented as mean ± S.E. (error bars). *, p < 0.05; n.s., not significant.
FIGURE 4.
FIGURE 4.
Has2os2 RNA was regulated parallel to Has2 mRNA in co-cultures. Has2 antisense RNA Has2os1, Has2os2, and Has2os3 were measured by qPCR. Has2os1 was below the limit of detection in both monocultures and co-cultures (n = 2). A and B, Has2os2 and Has2os3 RNA expression in monocultures or direct co-cultures after transfection with siRNA directed against Lef1 or control siRNA (n = 4). C, Has2 mRNA expression in SF after knockdown of Has2os2 or control treatment (n = 4). D, scheme shows predicted LEF1 binding sites (green) in Has2 (lower strand) and Has2os2 (upper strand) promotor regions (black). Exons are depicted in red, and arrows show transcription start sites of Has2 according to the Ensembl, Uniprot, and NCBI gene databases. E and F, Has2 mRNA expression after treatment with transcriptional inhibitor actinomycin D (Act D) or vehicle control for 2 and 6 h (n = 3). Data are presented as mean ± S.E. (error bars). *, p < 0.05; n.s., not significant.
FIGURE 5.
FIGURE 5.
Has2 mRNA was up-regulated despite MEK1 inhibition or basigin knockdown in SF. A, Has2 mRNA expression in SF in monoculture or direct co-culture after 24 h of treatment with the MEK1 inhibitor PD98059 (n = 6). B, Has2 mRNA expression in SF after transfection with control siRNA and siRNA targeting murine basigin (Bsg) (n = 5). C, Has2 mRNA expression in SF in co-culture with si BSG- or si control-transfected KYSE-410 cells (n = 4). Data are presented as mean ± S.E. (error bars). *, p < 0.05; n.s., not significant.
FIGURE 6.
FIGURE 6.
The KYSE-410 phenotype was not altered by increased HA synthesis in direct co-culture. A, B, C, and D, mRNA expression of mesenchymal markers fibronectin (FN1), vimentin (VIM), and SNAI1 and epithelial marker CDH1 in KYSE-410 cells after 96 h of monoculture or co-culture with either control SF or Has2 knockdown SF (n = 4). E, cell count of EpCAM+ KYSE-410 cells by flow cytometry after 3 days in monoculture and co-culture (n = 4). F, gene expression of the proliferation marker MKI67 in KYSE-410 cells in mono- and co-culture with either control SF or Has2 knockdown SF (n = 3). G, random migration of KYSE-410 cells in direct co-culture with control SF or Has2 knockdown SF (n = 3). Data are presented as mean ± S.E. (error bars).
FIGURE 7.
FIGURE 7.
Has2 up-regulation in co-culture may modulate the myofibroblast phenotype. A, Western blotting analysis of αSMA expression in direct co-cultures of KYSE-410 cells and control SF or Has2 knockdown SF 48 h after seeding (n = 4). B, SF proliferation as measured by decreasing fluorescence of CFSE-labeled SF (n = 3). C, random migration speed of SF determined by time lapse microscopy in SF monocultures and direct co-cultures of KYSE-410 cells and control SF or Has2 knockdown SF (n = 3). Data are presented as mean ± S.E. (error bars). *, p < 0.05.
FIGURE 8.
FIGURE 8.
Direct co-culture with KYSE-410 cells induced CCL5 and reduced CCL11 chemokine expression by fibroblasts. A, mRNA expression of murine chemokines Ccl2, Ccl5, Ccl7, Ccl11, Cxcl1, and Cxcl12 in SF after 48 h in monoculture or co-culture (n = 4). B, murine CCL5 protein concentration in cell culture supernatants of SF and KYSE-410 monoculture and direct co-cultures 48 h after seeding, determined by ELISA (n = 4). C, Ccl5 mRNA expression in control SF and Has2 knockdown SF after 48 h of co-culture with KYSE-410 cells (n = 4). D, Ccl5 mRNA expression in SF after treatment with 300 μm 4-MU or vehicle for 48 h (n = 4). E, expression of chemokine receptor CCR1 mRNA in KYSE-410 cells after 48 h in mono- and co-culture (n = 3). F, murine CCL11 protein concentration in supernatants of SF and KYSE-410 monocultures and direct co-cultures conditioned for 60 h (n = 4). G, Ccl11 mRNA expression in control SF and Has2 knockdown SF after 48 h in monoculture or co-culture (n = 4). H, Ccl11 mRNA expression in SF after treatment with 300 μm 4-MU or vehicle for 48 h (n = 4). Data are depicted as mean ± S.E. (error bars). *, p < 0.05; n.s., not significant; n.d., below the limit of detection.
FIGURE 9.
FIGURE 9.
Has2 and Ccl5 mRNA expression were also induced, and Ccl11 mRNA expression was reduced in CAF in direct co-culture with KYSE-410 cells. A, Has2 mRNA expression in CAF after 24 h of direct co-culture with KYSE-410 cells (n = 10). B, Western blotting analysis of αSMA expression in direct co-cultures of KYSE-410 cells and CAF treated with 300 μm 4-MU or vehicle for 48 h (n = 3). C, Ccl5 mRNA expression in CAF after 48 h of treatment with 300 μm 4-MU or vehicle (n = 4). D, Ccl11 mRNA expression in CAF after 48 h of treatment with 300 μm 4-MU or vehicle (n = 4). E–H, mRNA expression of EMT markers in KYSE-410 cells co-cultured with CAF for 96 h and treated with 4-MU or vehicle for the last 72 h (n = 4). I, cell count of KYSE-410 as determined by EpCAM+ cells in flow cytometry after 3 days in culture (n = 5). J, average migration speed of KYSE-410 cells in mono- and co-culture with CAF (n = 3). Data depicted as mean ± S.E. (error bars). *, p < 0.05; n.s., not significant.
FIGURE 10.
FIGURE 10.
HA enhanced the adhesion of CD4+ cells to tumor tissues. A, detection of F4/80+/CD206+ cells in dissociated KYSE-410 xenograft tumors. Gating was performed on living CD45+/CD11b+ cells. Bottom, fluorescent staining of HA (yellow), Mac2 (red), and CK-18 (green) in KYSE-410 xenograft tumors. Scale bar, 100 μm. B, adhesion of activated CD3+ cells (white) to xenograft tumor sections with or without prior hyaluronidase (Hyal) digestion. Nuclei were stained with DAPI (blue). C, number of CD3+ cells bound to xenograft tumor sections normalized to the area and depicted as -fold of control (n = 6). D, binding of activated CD4+ cells (white) to xenograft tumor sections with or without prior Hyal digestion. Nuclei were stained with DAPI (blue). E, number of CD4+ cells bound to xenograft tumor sections normalized to the area and depicted as -fold of control (n = 6). F, adhesion of activated CD8+ cells (white) to control xenograft tumor sections or to sections that were digested with Hyal. DAPI staining is shown in blue. G, number of bound CD8+ cells to xenograft tumor sections normalized to the area and depicted as -fold of control (n = 6). Data are presented as mean ± S.E. (error bars). *, p < 0.05.

References

    1. Servais C., and Erez N. (2013) From sentinel cells to inflammatory culprits: cancer-associated fibroblasts in tumour-related inflammation. J. Pathol 229, 198–207 - PubMed
    1. Öhlund D., Elyada E., and Tuveson D. (2014) Fibroblast heterogeneity in the cancer wound. J. Exp. Med. 211, 1503–1523 - PMC - PubMed
    1. Cirri P., and Chiarugi P. (2011) Cancer associated fibroblasts: the dark side of the coin. Am. J. Cancer Res. 1, 482–497 - PMC - PubMed
    1. Augsten M. (2014) Cancer-associated fibroblasts as another polarized cell type of the tumor microenvironment. Front. Oncol. 4, 62. - PMC - PubMed
    1. Harper J., and Sainson R. C. (2014) Regulation of the anti-tumour immune response by cancer-associated fibroblasts. Semin. Cancer Biol. 25, 69–77 - PubMed

Publication types

MeSH terms