. 2016 Jan 5;113(1):140-5.
doi: 10.1073/pnas.1517685113. Epub 2015 Dec 22.

Modeling the status, trends, and impacts of wild bee abundance in the United States

Affiliations

Modeling the status, trends, and impacts of wild bee abundance in the United States

Insu Koh et al. Proc Natl Acad Sci U S A. .

Abstract

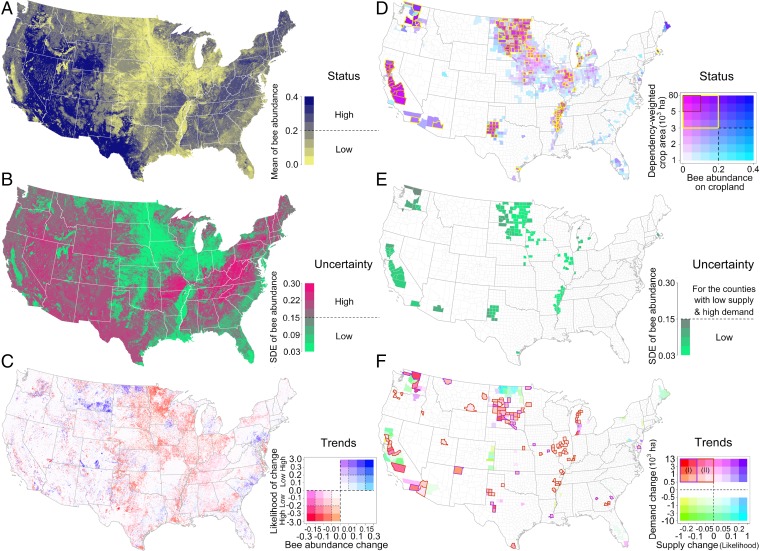
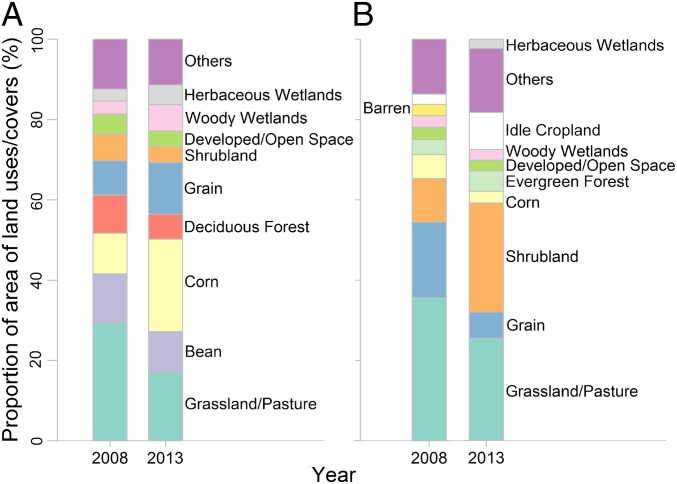
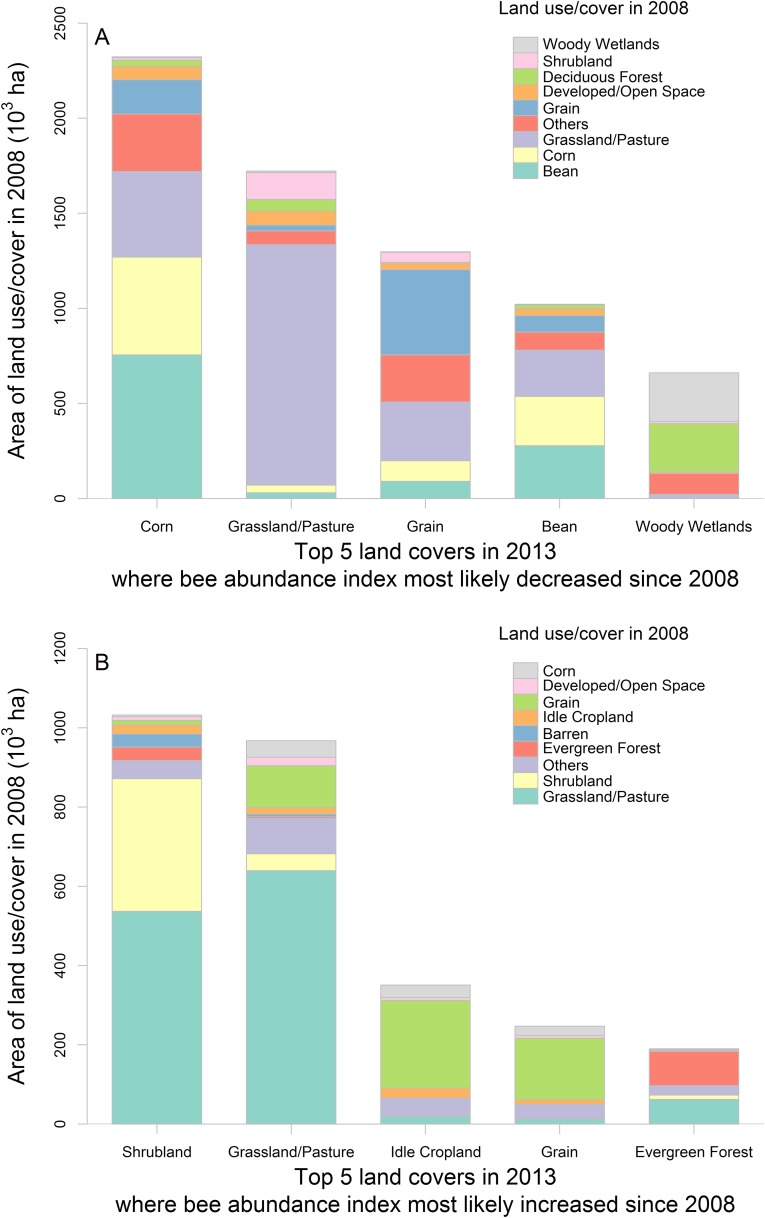
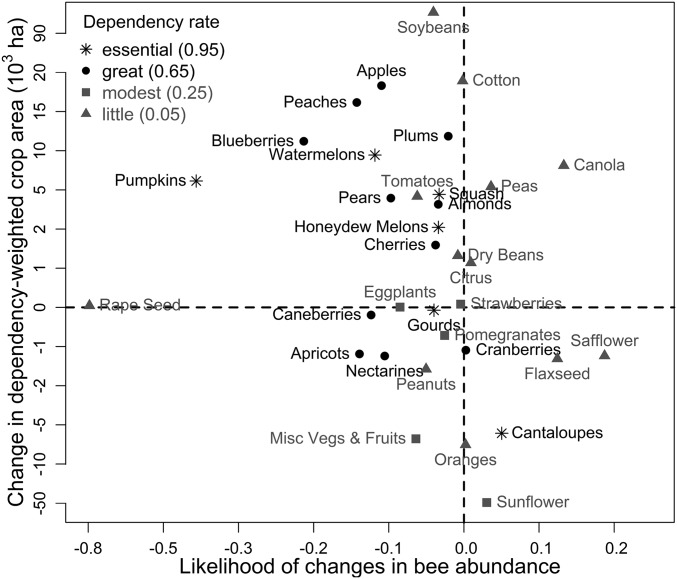
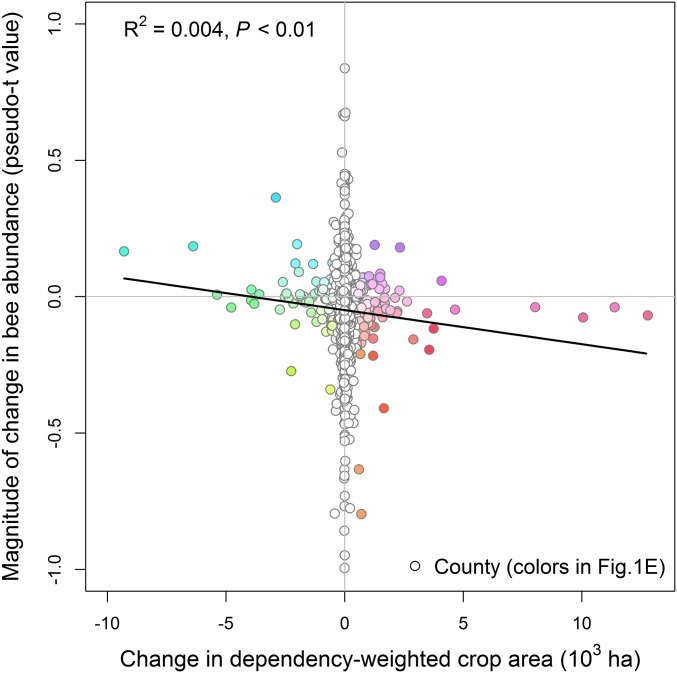
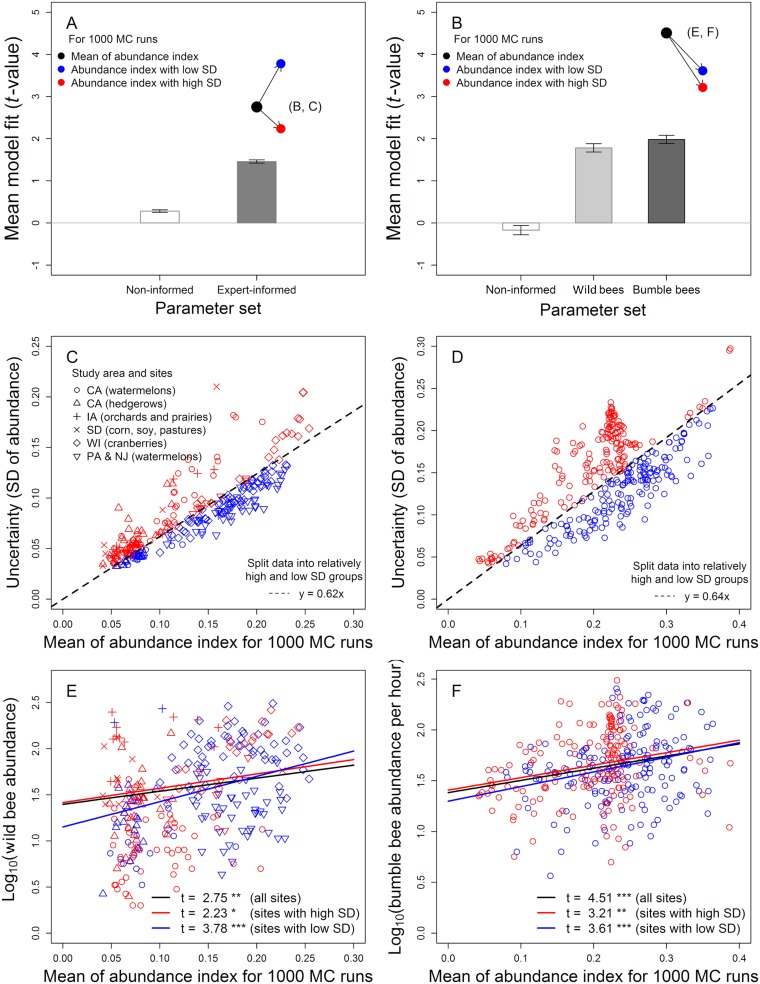
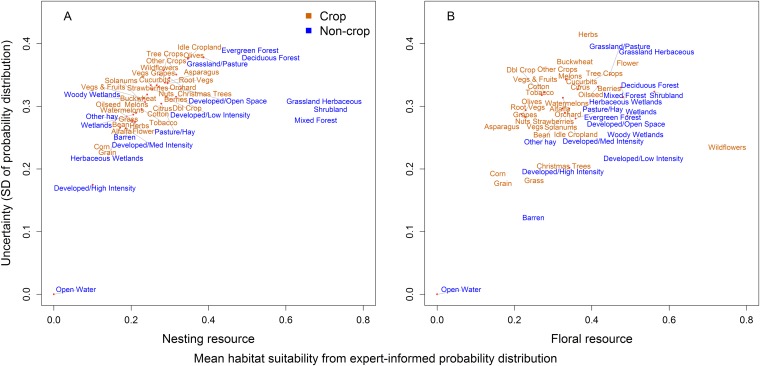
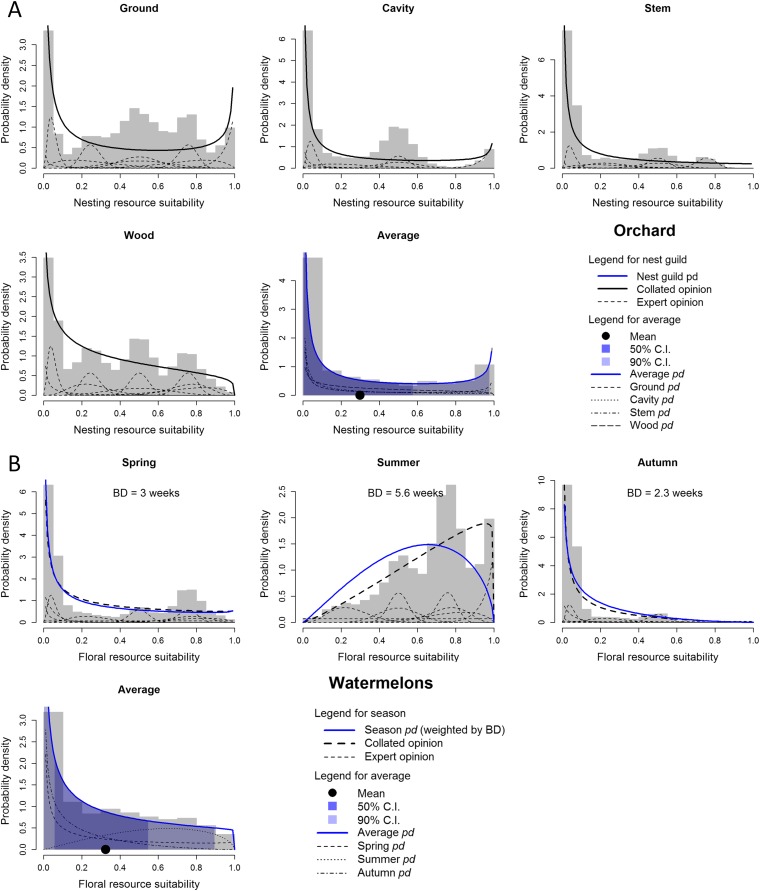
Wild bees are highly valuable pollinators. Along with managed honey bees, they provide a critical ecosystem service by ensuring stable pollination to agriculture and wild plant communities. Increasing concern about the welfare of both wild and managed pollinators, however, has prompted recent calls for national evaluation and action. Here, for the first time to our knowledge, we assess the status and trends of wild bees and their potential impacts on pollination services across the coterminous United States. We use a spatial habitat model, national land-cover data, and carefully quantified expert knowledge to estimate wild bee abundance and associated uncertainty. Between 2008 and 2013, modeled bee abundance declined across 23% of US land area. This decline was generally associated with conversion of natural habitats to row crops. We identify 139 counties where low bee abundances correspond to large areas of pollinator-dependent crops. These areas of mismatch between supply (wild bee abundance) and demand (cultivated area) for pollination comprise 39% of the pollinator-dependent crop area in the United States. Further, we find that the crops most highly dependent on pollinators tend to experience more severe mismatches between declining supply and increasing demand. These trends, should they continue, may increase costs for US farmers and may even destabilize crop production over time. National assessments such as this can help focus both scientific and political efforts to understand and sustain wild bees. As new information becomes available, repeated assessments can update findings, revise priorities, and track progress toward sustainable management of our nation's pollinators.

Keywords: crop pollination; ecosystem services; habitat suitability; land-use change; uncertainty.


Conflict of interest statement

The authors declare no conflict of interest.

Figures

Fig. 1.
Fig. 1.
Maps of status, uncertainty, trend, and impacts of wild bees across the coterminous United States. (A) Status of wild bee abundance (relative index) for 2013. (B) Uncertainty (SD estimate) of wild bee abundance index for 2013. (C) Trends in wild bee abundance and its uncertainty (the likelihood of changes: pseudo-t values) between 2008 and 2013. (D) Status of supply of wild bees (model-predicted abundance from A) and demand for pollination services (summed area of animal-pollinated crops, weighted by their pollinator dependence) at a county scale for 2013. Counties with less than 1,000 ha of pollinator-dependency weighted crop area were left white. (E) Uncertainty in the supply of wild bees in 2013 for the counties identified as supply/demand mismatches in D. (F) Trend of supply and demand between 2008 and 2013 (zones I and II indicate high and low likelihood of decreases in supply, respectively).
Fig. 2.
Fig. 2.
Changes in land-use/cover corresponding to predicted changes in wild bee abundance. Bars represent land cover in pixels where decreases (A) and increases (B) of wild bee abundance are highly likely between 2008 and 2013 (i.e., bee abundance changes <−0.01 or >0.01 and the likelihood of changes ≤−0.2 or ≥0.2 in Fig 1C, respectively).
Fig. S1.
Fig. S1.
Land-cover changes that caused the largest predicted change in bee abundance from 2008 and 2013. (A) Top five land covers in 2013 where bee abundance index most likely decreased since 2008. (B) Top five land covers in 2013 where bee abundance index most likely increased since 2008.
Fig. 3.
Fig. 3.
Nationwide changes in wild bee abundance and cultivated area for pollinator-dependent crops between 2008 and 2013. Symbols represent pollinator dependence for each crop reported by Klein et al. (49).
Fig. S2.
Fig. S2.
Relationship between changes in dependency-weighted crop areas and wild bee abundance changes during 2008–2013.
Fig. S3.
Fig. S3.
Fit between model predictions and field data for observed wild bee abundance and observed bumble bee abundance. Comparison of model fit for expert-informed and noninformative probability distributions for wild bee abundance data (A) and bumble bee abundance data (B). For bumble bees, we included expert-informed probability distribution of cavity nesting and summer floral resource. Bar plots represent the mean and SE of model fit (t value) resulting from 1,000 MC draws. Black circles depict fit when using the mean parameter value from experts (instead of random draws from expert-informed probability distributions). Additional circles represent fit with mean values, but separately for sites with low (red circles) and high (blue circles) model uncertainty. Sites were split into relatively low and high uncertainty group for wild bee abundance data (C) and bumble bee abundance data (D). The dashed line indicates split data as half for each uncertainty group. The relationship between bee abundance index (mean of 1,000 MC simulations) and observed abundance of wild bees (E) and bumble bees (F). Black line indicates the overall fixed effects. Two different colors (blue and red) indicate the model prediction for low and high uncertainty groups.
Fig. S4.
Fig. S4.
The relationship between the mean resource suitability estimates and uncertainty (SD) from expert-derived probability distributions of nesting (A) and floral (B) resources for wild bees for each of the land-cover categories.
Fig. S5.
Fig. S5.
Example of determining floral and nesting resource probability distributions from expert elicitation. (A) Distributions of four types of nesting recourses and their average for orchard cover. (B) Distributions of seasonal floral resources and their average for watermelon cover. BD, bloom duration.
Fig. S6.
Fig. S6.
Estimation of the mean and SD of bee abundance index. (A) The relationship between bee abundance index using means of expert-informed probability distributions and mean from a 1,000 MC simulation for 10,000 randomly selected locations across the United States. (B) The relationship between SDI and SD of bee abundance index from a 1,000 MC simulation.

References

    1. Winfree R, Williams NM, Gaines H, Ascher JS, Kremen C. Wild bee pollinators provide the majority of crop visitation across land-use gradients in New Jersey and Pennsylvania, USA. J Appl Ecol. 2008;45(3):793–802.
    1. Ollerton J, Winfree R, Tarrant S. How many flowering plants are pollinated by animals? Oikos. 2011;120(3):321–326.
    1. Lautenbach S, Seppelt R, Liebscher J, Dormann CF. Spatial and temporal trends of global pollination benefit. PLoS One. 2012;7(4):e35954. - PMC - PubMed
    1. Morse RA, Calderone NW. The value of honey bees as pollinators of U.S. crops in 2000. Bee Culture. 2000;128:1–15.
    1. Losey JE, Vaughan M. The economic value of ecological services provided by insects. Bioscience. 2006;56(4):311–323.