. 2016 Jan 5;113(1):E32-40.
doi: 10.1073/pnas.1513189113. Epub 2015 Dec 22.

Nuclear deformability and telomere dynamics are regulated by cell geometric constraints

Affiliations

Nuclear deformability and telomere dynamics are regulated by cell geometric constraints

Ekta Makhija et al. Proc Natl Acad Sci U S A. .

Abstract

Forces generated by the cytoskeleton can be transmitted to the nucleus and chromatin via physical links on the nuclear envelope and the lamin meshwork. Although the role of these active forces in modulating prestressed nuclear morphology has been well studied, the effect on nuclear and chromatin dynamics remains to be explored. To understand the regulation of nuclear deformability by these active forces, we created different cytoskeletal states in mouse fibroblasts using micropatterned substrates. We observed that constrained and isotropic cells, which lack long actin stress fibers, have more deformable nuclei than elongated and polarized cells. This nuclear deformability altered in response to actin, myosin, formin perturbations, or a transcriptional down-regulation of lamin A/C levels in the constrained and isotropic geometry. Furthermore, to probe the effect of active cytoskeletal forces on chromatin dynamics, we tracked the spatiotemporal dynamics of heterochromatin foci and telomeres. We observed increased dynamics and decreased correlation of the heterochromatin foci and telomere trajectories in constrained and isotropic cell geometry. The observed enhanced dynamics upon treatment with actin depolymerizing reagents in elongated and polarized geometry were regained once the reagent was washed off, suggesting an inherent structural memory in chromatin organization. We conclude that active forces from the cytoskeleton and rigidity from lamin A/C nucleoskeleton can together regulate nuclear and chromatin dynamics. Because chromatin remodeling is a necessary step in transcription control and its memory, genome integrity, and cellular deformability during migration, our results highlight the importance of cell geometric constraints as critical regulators in cell behavior.

Keywords: actomyosin contractility; cell geometry; chromatin dynamics; mechanotransduction; telomere dynamics.


Conflict of interest statement

The authors declare no conflict of interest.

Figures

Fig. 1.
Fig. 1.
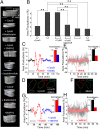
Reduced matrix constraints enhance nuclear deformability. (A) Maximum intensity projection for confocal images of typical large polarized (LP) and constrained isotropic (CI) cell stained with Phalloidin (green) and Hoechst (blue). (Scale bar, 10 µm.) See also Fig. S1. (B) Surface rendering of nuclear periphery kymographs for a typical LP and CI cell time series. (Scale bar, 10 µm.) (C) Widefield epifluorescence images of nuclei in LP and CI cells expressing H2B-EGFP. Colored outlines mark the periphery of these nuclei at various time points. (D) Typical PNAFs of LP and CI cells as a function of time. (E) PNAF vs. time plot for multiple cells. CI, 27 cells; LP, 83 cells. (F) Gray and light red curves represent a normalized histogram of combined PNAFs for all cells and all time points in LP and CI patterns, respectively. Black and red curves represent the Gaussian fittings. Inset shows SDs of the two distributions. Performing two-sample F-test for variance on the two distributions yields **P < 0.001 for nLP= 3,204 from 83 cells and nCI=1,803 from 27 cells.
Fig. S1.
Fig. S1.
Matrix constraints regulate actin organization and nuclear morphology. (A) Phalloidin staining in typical large polarized (LP) and constrained isotropic (CI) cells, color-coded for height. Right shows separate apical and basal images for CI cell to emphasize that CI cells have phalloidin in the blue and magenta height range, which is absent in LP cells. (B) A 3D surface rendering of the H2B-EGFP nucleus in typical LP and CI cells. (C) Comparison of nuclear height, projected area, surface area, and volume for LP (n = 10) and CI cells (n = 10). Error bars represent SE. (D) Nuclear periphery in typical LP and CI cells as a function of time. Such time stacks of nuclear periphery are then fitted with a surface in IMARIS to obtain periphery kymographs. (E) Projected nuclear area fluctuations (µm2) in typical LP and CI cells. (F and G) Nuclear surface area and volume fluctuations as a function of time for LP (n = 8) and CI (n = 6) cells.
Fig. 2.
Fig. 2.
Actin, myosin, and formin regulate matrix assisted nuclear deformability. (A) Surface rendering of nuclear periphery kymographs for typical control and treated LP and CI cells. (Scale bar, 10 µm.) (B) SDs of PNAF distributions of multiple control and treated LP and CI cells. Left to right represents increasing actin polymerization. nCI+CytoD= 625 from 16 cells, nCI= 1,803 from 27 cells, nLP+CytoD= 1,177 from 43 cells, nLP+CytoD+Washoff= 1,288 from 22 cells, nLP= 3,204 from 83 cells, and nCI+Jas= 1,067 from 13 cells. Performing two-sample F-test for variance on the various distributions yields **P < 0.001 for all conditions. (C) A typical PNAF trace for a LP cell sequentially treated with cytochalasin-D and blebbistatin. Inset represents normalized SDs of PNAF distributions obtained by combining all cells and time points. Performing two-sample F-test for variance on the two distributions yields **P < 0.001 for nLP+CytoD= 1,177 from 43 cells and nLP+CytoD+Blebb=1,196 from 20 cells. (D) Merge of nuclear periphery outlines at 15-min interval for a typical LP cell in untreated, cytochalasin-D, and cytochalasin-D + blebbistatin conditions. (E) PNAF vs. time plot for multiple control and blebbistatin-treated CI cells. Inset represents normalized SDs of PNAF distributions obtained by combining all cells and time points. Performing two-sample F-test for variance on the two distributions yields **P < 0.001 for nCI= 800 and nCI+Blebb= 805 from 25 cells. (F) Merge of nuclear periphery outlines at 15-min interval for a typical CI cell in untreated and blebbistatin conditions. (G) Typical PNAF trace for a LP cell sequentially treated with cytochalasin-D and SMIFH2. Inset represents normalized SDs of PNAF distributions obtained by combining all cells and time points. Performing two-sample F-test for variance on the two distributions yields **P < 0.001 for nLP+CytoD= nLP+CytoD+SMIFH2= 144 from four cells. (H) PNAF vs. time plot for multiple control and SMIFH2-treated CI cells. Inset represents normalized SDs of PNAF distributions obtained by combining all cells and time points. Performing two-sample F-test for variance on the two distributions yields **P < 0.001 for nCI= 1,222 and nCI+SMIFH2= 1,194 from 26 cells. See also Fig. S2.
Fig. S2.
Fig. S2.
Actin, myosin, and formin regulate matrix-assisted nuclear deformability. (A) Projected nuclear area fluctuations (PNAF) vs. time plots for multiple control and cytochalasin-D–treated LP cells (n = 43). (B) PNAF vs. time plots for multiple control and jasplakinolide-treated CI cells (n = 11). (C) PNAF vs. time plots for multiple control and cytochalasin-D–treated CI cells (n = 12). (D) Area vs. time plot for a typical control LP cell and upon sequential treatment with cytochalasin-D and blebbistatin. Gray and blue curves represent third-order polynomial fit. Light red curve represents exponential decay fit (τ ∼4.2 min). (E) PNAF vs. time plots for multiple LP cells sequentially treated with cytochalasin-D and blebbistatin (n = 5). (F) PNAF vs. time plots for multiple LP cells sequentially treated with cytochalasin-D and SMIFH2 (n = 4).
Fig. S3.
Fig. S3.
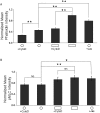
Contractility as a function of cell shape and drug treatments. Total (A) phalloidin and (B) phosphorylated myosin light chain intensities in cytochalasin-D–treated CI (15 cells), CI (11 cells), cytochalasin-D–treated LP (13 cells), LP (17 cells), and jasplakinolide-treated CI (10 cells) cells. **P < 0.01, and *P < 0.05. Error bars represent SE.
Fig. S4.
Fig. S4.
ATP dependence of projected nuclear area fluctuations. Gray and red curves represent the Gaussian fittings to the normalized histograms of combined PNAFs for all cells and time points in CI and ATP depleted CI cells, respectively. Inset shows the SDs of the two distributions. Performing two-sample F-test for variance on the two distributions yields **P < 0.01 for nCI = 480 from eight cells and nATP depleted CI = 480 from eight cells.
Fig. 3.
Fig. 3.
Role of LINC complex and microtubules in nuclear deformability. (A) Widefield epifluorescence image of a typical CI cell coexpressing H2B-mRFP (green) and Nesprin DN-KASH EGFP (red). H2B-mRFP is shown in green to maintain consistency across the figures. (B) Surface rendering of nuclear periphery kymograph for a typical Nesprin mutant CI cell. (C) PNAF vs. time plot for multiple Nesprin mutant CI cells. Inset represents normalized SDs of PNAF distributions obtained by combining all cells and time points for control and DNKASH CI conditions. Performing two-sample F-test for variance on the two distributions yields **P < 0.001 for nCI= 1,803 from 27 cells and nCI+DNKASH= 530 from 5 cells. (D) Typical PNAF trace for a CI cell treated with nocodazole. Inset represents normalized SDs of PNAF distributions obtained by combining all cells and time points. Performing two-sample F-test for variance on the two distributions yields **P < 0.001 for nCI= 820 and nCI+Noco= 640 from 26 cells.
Fig. 4.
Fig. 4.
Role of lamin A/C in nuclear deformability. (A) Widefield epifluorescence image of a typical CI cell coexpressing H2B-EGFP (green) and lamin A/C-mRFP (red). (B) PNAF vs. time plot for multiple lamin A/C overexpressing CI cells. Inset represents normalized SDs of PNAF distributions obtained by combining all cells and time points for control and lamin A/C overexpression CI conditions. Performing two-sample F-test for variance on the two distributions yields **P < 0.001 for nCI= 1,803 from 27 cells and nCI+laminA/C= 210 from 4 cells. (C) mRNA levels obtained by qRT-PCR for CI cells normalized with respect to LP cells (n = 3 samples). Error bars represent SE. **P < 0.001. (D) Surface rendering of a nuclear periphery kymograph for typical lamin A/C overexpressing CI cell, control MEF cell, and lamin−/− MEF cell. (E) Widefield epifluorescence image of a typical MEF cell expressing H2B-EGFP. (F) PNAF vs. time plot for multiple MEF cells cultured on LP patterns (10 cells). (G) Widefield epifluorescence image of a typical lamin−/− MEF cell expressing H2B-EGFP. (H) PNAF vs. time plot for multiple lamin−/− MEF cells cultured on LP patterns. Inset represents normalized SDs of PNAF distributions obtained by combining all cells and time points for MEFs and lamin−/− MEFs. Performing two-sample F-test for variance on the two distributions yields **P < 0.001 for nMEF= 340 from 10 cells and nlamin-/-MEF= 495 from 15 cells.
Fig. 5.
Fig. 5.
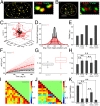
Actomyosin contractility regulates matrix-associated heterochromatin dynamics. (A and B) XY trajectories of multiple heterochromatin foci before and after blebbistatin and cytochalasin-D perturbations in CI and LP cells, respectively. (C) Mean squared displacement vs. time plots for heterochromatin foci before and after blebbistatin and cytochalasin-D perturbations in CI and LP cells, respectively. Error bars represent SE. (D and E) Maximum intensity z-projected images of H2B-EGFP nucleus in typical CI and LP cells. Heterochromatin foci have been numbered and color-coded based on their z-position. Blue represents basal plane, and yellow represents apical plane. (F and G) Pearson correlation coefficient calculated between 3D trajectories of all heterochromatin foci pairs labeled in D and E. See also Fig. S5. (H and I) Pearson correlation coefficient calculated between 3D trajectories of the same heterochromatin foci pairs upon blebbistatin and cytochalasin-D treatments in CI and LP cells, respectively. (J) Widefield epifluorescence images of H2B-EGFP nucleus in typical LP cell in untreated, cytochalasin-D, and washoff conditions. See also Fig. S6. (K) Pearson correlation coefficient for H2B-EGFP intensity histograms in control, cytochalasin-D-treated, and washoff conditions. Error bars represent SE. *P = 0.05, n = 7 cells. (L) Pearson correlation coefficient calculated between 3D trajectories of same heterochromatin foci pairs (same as in E, G, and I) upon washoff of cytochalasIn-D.
Fig. S5.
Fig. S5.
Actomyosin contractility regulates matrix-assisted chromatin dynamics. (A) Top shows widefield epifluorescence images of a H2B-EGFP nucleus in typical CI and LP cells. Bright spots represent heterochromatin foci. Middle represents line kymograph across the nuclei. Bright lines represent heterochromatin foci dynamics. Bottom represents the line kymograph across the same line in the same nuclei after blebbistatin and cytochalasin-D perturbations in the CI and LP cells, respectively. (B) Simulated XY tracks at angles varying from 0° to 180° in 10° intervals. (C) Vector Pearson correlation coefficient calculated as a function of difference in angle between the simulated tracks. (D) Maximum intensity z-projected image of H2B-EGFP nucleus in typical CI cell. Heterochromatin foci have been numbered and color-coded based on their z-position. Blue represents basal plane, and red represents apical plane. (E and F) Pearson correlation coefficient calculated between 3D trajectories of all heterochromatin foci pairs labeled in D in control and cytochalasin-D treatment, respectively. Foci 7 could not be thresholded and tracked through the complete movie because of low intensity levels, resulting in missing XYZ position data for various time points.
Fig. S6.
Fig. S6.
Reversible nature of chromatin organization. (A) Widefield epifluorescence images of H2B-EGFP nucleus with photobleached lines in a typical LP cell in untreated, cytochalasin-D, and washoff conditions. The fourth panel shows a merge of the untreated and washoff images. (B) Widefield epifluorescence images of H2B-EGFP nucleus with photobleached lines in a typical CI cell at time 0 and time 15 min. The third panel shows a merge of the 0-min and 15-min images. (C) Pearson correlation coefficient for H2B-EGFP polarization anisotropy histograms in control, cytochalasin-D–treated, and washoff conditions. In the box plot, the bottom and top of the box represent first quartile to third quartile, the band inside the box represents second quartile (median), the ends of the whiskers represent the lowest/highest data within 1.5 interquartile range of the lower/upper quartile, and the crosses represent the lowest and highest data points. (D) XYZ trajectories of heterochromatin foci in a typical LP cell in control (black), cytochalasin-D (blue), and washoff (red) conditions. Gray, light blue, and light red trajectories represent their projections on the three perpendicular planes.
Fig. 6.
Fig. 6.
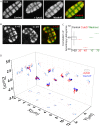
Actomyosin contractility regulates matrix-associated telomere dynamics. (A and B) Overlap of nucleus periphery and maximum intensity z-projected images of a TRF1-dsRed nucleus at 3-min interval in typical LP and CI cells. Bright spots represent telomeres. (Scale bar, 4 µm.) (C) XYZ trajectories of typical telomeres in LP and CI cells. (D) Normalized histogram of displacement from mean position, combining data for n = 89 telomere trajectories from n = 3 LP cells and n = 68 telomere trajectories from n = 3 CI cells. Black and red curves represent the Gaussian fittings. (E) Full width at half maxima (FWHM) of Gaussian fitting of histograms for displacement from mean position in LP cells, cytochalasin-D–treated LP cells (2 cells, 62 telomeres), CI cells, blebbistatin-treated CI cells (3 cells, 141 telomeres), and laminA/C-deficient CI cells (2 cells, 58 telomeres). (F) Mean squared displacement vs. time plots for multiple telomeres in control LP and CI cells. (G) Box plot for the exponent α in LP and CI cells obtained by fitting MSD ‹r2(τ)› vs. time lag τ plots to the equation ‹r2(τ)› = α. The bottom and top of the box represent the first and third quartiles, whereas the line and dot inside the box represent the median and mean, respectively. The ends of the whiskers correspond to the lowest/highest data point of the distribution. nLP= 62 telomeres from two cells, and nCI= 141 telomeres from three cells. (H) Mean α values for LP cells, cytochalasin-D–treated LP cells, CI cells, blebbistatin-treated CI cells, and laminA/C-deficient CI cells. Error bars represent SE, and the means are significantly different with **P < 0.01. nLP= 68 telomeres from three cells, nLP+CytoD= 62 telomeres from two cells, nCI= 68 telomeres from three cells, nCI+Blebb.= 141 telomeres from three cells, and nlamin-/-MEFs= 58 telomeres from two cells. (I and J) Pearson correlation coefficient calculated between 3D trajectories of 15 telomere pairs (chosen at random) in typical LP and CI cells, respectively. The telomeres are sorted (top to bottom and left to right) in ascending z-position, i.e., basal to apical. (K) Mean value of the correlation coefficient for LP cells, cytochalasin-D–treated LP cells (3 cells, 89 telomeres), CI cells (3 cells, 68 telomeres), blebbistatin-treated CI cells (3 cells, 141 telomeres), and laminA/C-deficient CI cells (2 cells, 58 telomeres). Error bars represent SE, and the means are significantly different with **P < 0.01. See also Fig. S7.
Fig. S7.
Fig. S7.
Actomyosin contractility regulates matrix-assisted telomere dynamics. (A and B) Line kymographs across typical LP and CI cell nuclei. Bright lines represent telomere dynamics. (C) Normalized histogram for telomere speed in LP (3 cells, 89 telomeres) and CI (3 cells, 68 telomeres) cells. (D) Mean speed of telomeres in LP, cytochalasin-D–treated LP (2 cells, 62 telomeres), CI, blebbistatin-treated CI (3 cells, 141 telomeres), and lamin A/C-deficient LP (2 cells, 58 telomeres) cells. The mean speeds are significantly different with **P < 0.01. Error bars represent SE. (EG) Pearson correlation coefficient calculated between 3D trajectories of 15 telomere pairs (chosen at random) in typical cytochalasin-D–treated LP, blebbistatin-treated CI, and lamin A/C-deficient LP cells, respectively. The telomeres are sorted (top to bottom and left to right) in ascending z-position, i.e., basal to apical.
Fig. S8.
Fig. S8.
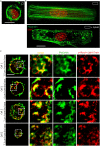
Actin organization in different geometries. (A and B) Maximum intensity projected images of phalloidin and DAPI staining in typical CI, LP, and cytochalasin-D–treated LP cells. Punctated actin structures are observed in CI and cytochalasin-D–treated LP cells (which show nuclear fluctuations) but not in control LP cells (which do not show nuclear fluctuations). (Scale bar, 10 µm.) (C) Single confocal slices from two typical CI cells with phalloidin (green) and phosphorylated myosin light chain (pMLC) (red) staining. The panels in the second column are 7 µm × 7 µm zoomed in images of the regions demarcated by the white square boxes. The panels in the third and fourth columns are the individual corresponding phalloidin and pMLC channels, respectively. (Scale bar, 10 µm.)
Fig. 7.
Fig. 7.
A model summarizing cytoskeletal and nucleoskeletal regulation of nuclear and chromatin dynamics. The actin is shown in purple, the microtubules are shown in green, the lamin A/C is shown as blue (time t) and red (time t + Δt) outline of the nucleus, and heterochromatin foci are shown as blue (time t) and red (time t + Δt) structures of DNA. Briefly, in LP cells the long apical actin stress fibers press on the nucleus, making it flat and elongated. The lamin A/C expression levels are higher. The nuclear periphery, as well as heterochromatin foci, is less dynamic. In contrast, in CI cells, long actin stress fibers are absent, and actin exists as meshwork of short filaments and punctae. The zoom-in of actin structures shows actin, myosin, and formin asters as reported earlier (62). Lamin A/C expression levels are lower. We speculate that active forces from the dynamic actin–myosin–formin asters, as well as decreased rigidity because of lower lamin A/C expression levels, make the nuclear periphery and heterochromatin foci more dynamic in CI cells. See also Fig. S8.
Fig. S9.
Fig. S9.
Correlation of telomere fluctuations with nuclear membrane fluctuations. (A) Binary maximum intensity projection of the middle five confocal slices of an H2B-GFP nucleus of a typical CI cell. The red spots represent the telomeres found in those planes. (B) Line kymograph across the cell shown in A. The green trace represents the position of edge of the nucleus. The red traces represent the positions of two telomeres which also lie on the line.

References

    1. Isermann P, Lammerding J. Nuclear mechanics and mechanotransduction in health and disease. Curr Biol. 2013;23(24):R1113–R1121. - PMC - PubMed
    1. Woringer M, Darzacq X, Izeddin I. Geometry of the nucleus: A perspective on gene expression regulation. Curr Opin Chem Biol. 2014;20:112–119. - PubMed
    1. Burke B, Stewart CL. Functional architecture of the cell’s nucleus in development, aging, and disease. Curr Top Dev Biol. 2014;109:1–52. - PubMed
    1. Mazumder A, Shivashankar GV. Emergence of a prestressed eukaryotic nucleus during cellular differentiation and development. J R Soc Interface. 2010;7(Suppl 3):S321–S330. - PMC - PubMed
    1. Broers JL, et al. Decreased mechanical stiffness in LMNA-/- cells is caused by defective nucleo-cytoskeletal integrity: Implications for the development of laminopathies. Hum Mol Genet. 2004;13(21):2567–2580. - PubMed

Publication types