. 2016 May 24;113(21):5797-803.
doi: 10.1073/pnas.1514034112. Epub 2015 Dec 22.

Sea spray aerosol as a unique source of ice nucleating particles

Affiliations

Sea spray aerosol as a unique source of ice nucleating particles

Paul J DeMott et al. Proc Natl Acad Sci U S A. .

Abstract

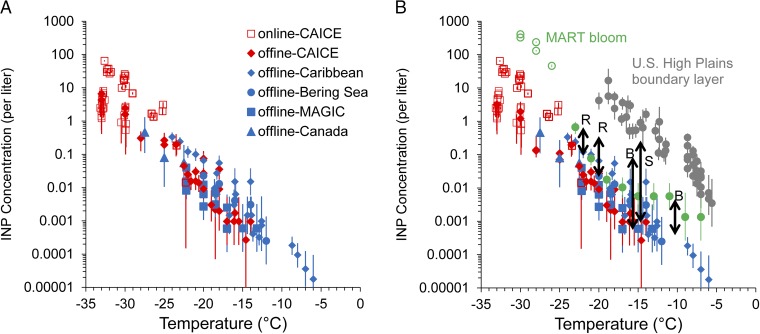
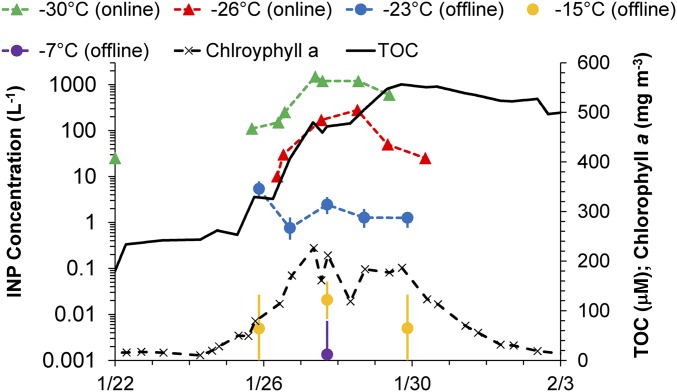
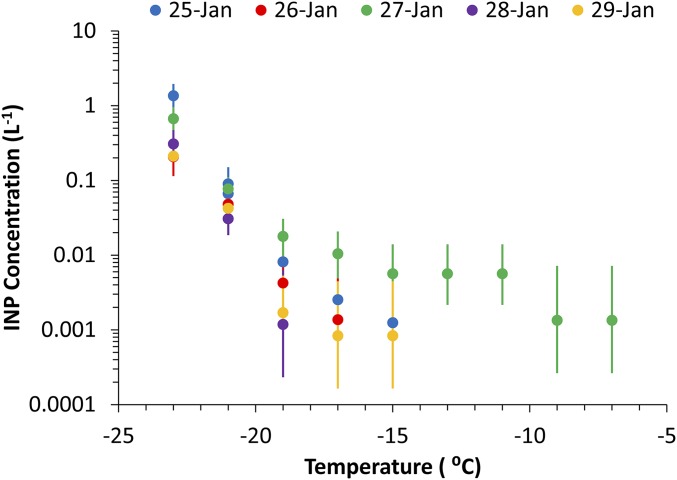
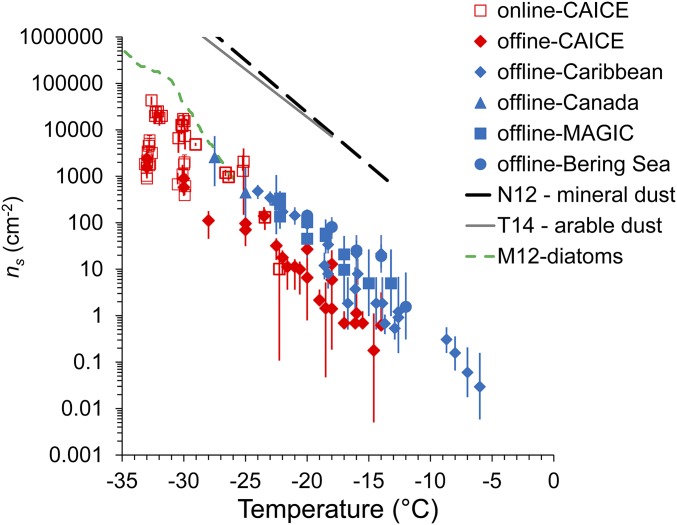
Ice nucleating particles (INPs) are vital for ice initiation in, and precipitation from, mixed-phase clouds. A source of INPs from oceans within sea spray aerosol (SSA) emissions has been suggested in previous studies but remained unconfirmed. Here, we show that INPs are emitted using real wave breaking in a laboratory flume to produce SSA. The number concentrations of INPs from laboratory-generated SSA, when normalized to typical total aerosol number concentrations in the marine boundary layer, agree well with measurements from diverse regions over the oceans. Data in the present study are also in accord with previously published INP measurements made over remote ocean regions. INP number concentrations active within liquid water droplets increase exponentially in number with a decrease in temperature below 0 °C, averaging an order of magnitude increase per 5 °C interval. The plausibility of a strong increase in SSA INP emissions in association with phytoplankton blooms is also shown in laboratory simulations. Nevertheless, INP number concentrations, or active site densities approximated using "dry" geometric SSA surface areas, are a few orders of magnitude lower than corresponding concentrations or site densities in the surface boundary layer over continental regions. These findings have important implications for cloud radiative forcing and precipitation within low-level and midlevel marine clouds unaffected by continental INP sources, such as may occur over the Southern Ocean.

Keywords: clouds; ice nucleation; marine aerosols.


Conflict of interest statement

The authors declare no conflict of interest.

Figures

Fig. 1.
Fig. 1.
Assembly of data on INP number concentrations from sea spray particles in the laboratory (red) and for ambient marine boundary layer particles (blue), and differentiated between on-line (open symbols) or off-line (filled symbols) measurements (A and B). Laboratory data are normalized to total particle concentrations of 150 cm−3. Locations/projects are indicated in each case. In B, additional data are included from a day (January 27) following the peak of the MART phytoplankton bloom in January 2013 (green), and for continental boundary layer measurements (gray) (40). Also shown by solid arrows are the ranges of measured INP concentrations in other historical measurements over the Southern Ocean by Bigg (B) (22), from the Gulf of Mexico by Rosinski et al. (R) (24), and from off the east coast of Nova Scotia by Schnell (S) (25). Error bars on data points are discussed in the text.
Fig. S1.
Fig. S1.
INP measurements during wave channel experiments in November 2011 (A) and during MART experiments in January 2014 (B). All three ice nucleation measurement methods are compared in A, and only the IS and CFDC in B, to demonstrate agreement in their regions of overlap.
Fig. 2.
Fig. 2.
Time series of INP number concentrations, Chl a, and total organic carbon (TOC) at selected temperatures during the MART bloom experiment in January 2013.
Fig. S2.
Fig. S2.
Time evolution of IS temperature spectra of immersion freezing INP number concentrations at 1° intervals during the January 2013 bloom experiment. January 27 followed the peak of Chl a concentration, as shown in Fig. 2.
Fig. 3.
Fig. 3.
Surface active site density, ns, for all data shown in Fig. 1A. Average ns values for mineral dust (8), arable soil dust (11), and diatoms (43) are shown for comparison with the calculated values.
Fig. 4.
Fig. 4.
Size distributions of concentrations of (A) aerosol number and (B) surface area for three laboratory particle generation methods (in red) (38, 39, 44), compared with ambient aerosol size distributions (in blue) measured by the ultrahigh-sensitivity aerosol spectrometer instrument during the open ocean IS filter sampling period east of Hawaii during the MAGIC study and two sampling periods during the 2014 NETCARE program. Total integrated particle number and surface area for each distribution is shown in parentheses in the legend.
Fig. S3.
Fig. S3.
INP number concentrations via CFDC measurements in A, as a fraction of total aerosol particles released in B, and as a fraction of the number of particles with diameters greater than >0.5 μm in C for different SSA production methods set up for fresh seawater in the wave channel on the same day (November 1, 2011).
Fig. S4.
Fig. S4.
(A) Sample locations and dates for DFT samples onboard the RV Amundsen during the NETCARE study in 2014. (B) Ocean Chl a concentrations in the region interpreted from satellite ocean color measurements during the month of July 2014 were processed and made available by the NASA Ocean Biology Distributed Active Archive Center (OB.DAAC).
Fig. S5.
Fig. S5.
As for Fig. S4, but with a star indicating the approximate central location of aircraft flight tracks in the MBL during the ICE-T study in July 2011. The sampling region is indicated on a map of integrated Chl a concentration for the month of July, averaged for the period 2012–2014, and were processed and made available by the NASA Ocean Biology Distributed Active Archive Center (OB.DAAC).
Fig. S6.
Fig. S6.
As for Fig. S5, but indicating the approximate location of samples used in this study from cruises during the MAGIC study. These sample locations during July 2013 are overlain on a map of integrated Chl a concentration for the month that were processed and made available by the NASA Ocean Biology Distributed Active Archive Center (OB.DAAC).
Fig. S7.
Fig. S7.
As for Fig. S5, but indicating the approximate location of the sample used in this study from the SHIPPO study cruise in July 2012. The sample location is overlain on a map of integrated Chl a concentration for the month of July interpreted from satellite ocean color measurements that were processed and made available by the NASA Ocean Biology Distributed Active Archive Center (OB.DAAC).

References

    1. Boucher O, et al. Clouds and aerosols. In: Stocker TF, et al., editors. Climate Change 2013: The Physical Science Basis. Contribution of Working Group I to the Fifth Assessment Report of the Intergovernmental Panel on Climate Change. Cambridge Univ Press; Cambridge, UK: 2013. pp. 571–657.
    1. Vali G, DeMott PJ, Möhler O, Whale TF. Ice nucleation terminology. Atmos Chem Phys. 2015;15(18):10263–10270.
    1. DeMott PJ, et al. Predicting global atmospheric ice nuclei distributions and their impacts on climate. Proc Natl Acad Sci USA. 2010;107(25):11217–11222. - PMC - PubMed
    1. DeMott PJ, et al. Measurements of the concentration and composition of nuclei for cirrus formation. Proc Natl Acad Sci USA. 2003;100(25):14655–14660. - PMC - PubMed
    1. Cziczo DJ, et al. Clarifying the dominant sources and mechanisms of cirrus cloud formation. Science. 2013;340(6138):1320–1324. - PubMed

Publication types