. 2016 Jan 5;113(1):152-7.
doi: 10.1073/pnas.1512501113. Epub 2015 Dec 22.

Bottlenecks and selective sweeps during domestication have increased deleterious genetic variation in dogs

Affiliations

Bottlenecks and selective sweeps during domestication have increased deleterious genetic variation in dogs

Clare D Marsden et al. Proc Natl Acad Sci U S A. .

Abstract

Population bottlenecks, inbreeding, and artificial selection can all, in principle, influence levels of deleterious genetic variation. However, the relative importance of each of these effects on genome-wide patterns of deleterious variation remains controversial. Domestic and wild canids offer a powerful system to address the role of these factors in influencing deleterious variation because their history is dominated by known bottlenecks and intense artificial selection. Here, we assess genome-wide patterns of deleterious variation in 90 whole-genome sequences from breed dogs, village dogs, and gray wolves. We find that the ratio of amino acid changing heterozygosity to silent heterozygosity is higher in dogs than in wolves and, on average, dogs have 2-3% higher genetic load than gray wolves. Multiple lines of evidence indicate this pattern is driven by less efficient natural selection due to bottlenecks associated with domestication and breed formation, rather than recent inbreeding. Further, we find regions of the genome implicated in selective sweeps are enriched for amino acid changing variants and Mendelian disease genes. To our knowledge, these results provide the first quantitative estimates of the increased burden of deleterious variants directly associated with domestication and have important implications for selective breeding programs and the conservation of rare and endangered species. Specifically, they highlight the costs associated with selective breeding and question the practice favoring the breeding of individuals that best fit breed standards. Our results also suggest that maintaining a large population size, rather than just avoiding inbreeding, is a critical factor for preventing the accumulation of deleterious variants.

Keywords: bottleneck; deleterious mutations; domestication; selective sweep.


Conflict of interest statement

The authors declare no conflict of interest.

Figures

Fig. 1.
Fig. 1.
Population history and deleterious genetic variation. (A) Conceptual model of dog domestication used in population genetic simulations. Box widths are proportional to estimated population sizes (SI Appendix, Table S4). (B) The ratio of zerofold to fourfold heterozygosity vs. neutral genetic diversity. Observed heterozygosity is based on four reads per individual. The larger circles represent the trimmed median values for each population group, and the error bars denote 95% confidence intervals on the trimmed median for each population group. Triangles denote the Tibetan wolves. A square denotes the Isle Royale wolf. The solid black line denotes the best-fit linear regression line (Iintercept = 0.301, slope = −29.00, r = −0.534, P < 6 × 10⁻⁸). The dashed line denotes the best-fit linear regression line from forward simulations of demography and negative selection (SI Appendix, Tables S4 and S7). (C) The ratio of zerofold to fourfold heterozygosity vs. neutral genetic diversity in the 35 high-coverage genomes where genotypes were called using GATK. The solid black line denotes the best-fit linear regression line (intercept = 0.276, slope = −21.43, r = −0.777, P < 5 × 10⁻⁸), and the dashed line is as described in B.
Fig. 2.
Fig. 2.
Recent inbreeding does not drive the relationship between neutral heterozygosity and the zerofold/fourfold heterozygosity ratio. (A) Forward simulations using a demographic model that includes inbreeding over the last 100 generations, but not bottlenecks associated with domestication or breed formation (“wolf” demographic model in SI Appendix, Table S4). (B) Empirical results from computing heterozygosity using one read from each of two individuals per population. The solid line denotes the best-fit linear regression line (intercept = 0.288, slope = −27.25, r = −0.502, P = 0.024). (C) The relationship between neutral polymorphism and the ratio of zerofold to fourfold heterozygosity persists when removing runs of homozygosity. The solid black line denotes the best-fit linear regression line (intercept = 0.287, slope = −27.07, r = −0.757, P < 5 × 10⁻⁷). This plot uses the same data as in Fig. 1C, but removing ROHs. Red triangles denote the Tibetan wolves.
Fig. 3.
Fig. 3.
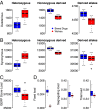
Comparison of the burden of deleterious genetic variation between breed dogs (blue) and wolves (red) based on high-quality genomes. “Homozygous derived” refers to the number of genotypes per individual that are homozygous for the derived allele. The total number of derived alleles is based on counting each heterozygous genotype once and each homozygous derived genotype twice. Small points denote the genomes used for each species (n = 25 for breed dogs, n = 9 for wolves). (A) Nonsynonymous variants that are predicted to be deleterious (GERP score >4). (B) Synonymous variants. (C) GERP score load for each individual. (D) Genetic load computed from our forward simulations. Outlier points are not shown for clarity. Left shows the load due to mutations that became fixed within the most recent 2,480 generations. Middle shows the load contributed by segregating mutations only. Right shows the total load, combining fixed and segregating variants. P < 0.008 for all comparisons between dogs and wolves using a Mann–Whitney U test except the comparison of the total number of synonymous derived alleles (SI Appendix, Table S7).
Fig. 4.
Fig. 4.
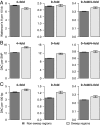
Genetic variation surrounding nonsweep (dark gray) and sweep (light gray) regions in breed dogs. (A) Watterson’s θ, an estimate of genetic diversity based on the number of SNPs. (B) The average derived allele count (DAC) per SNP. (C) Average DAC per 100 bp (considering invariant positions). Each variant site is counted the number of times its derived allele appears in the sample. Error bars are 95% confidence intervals. Note the decrease in diversity in A and the increase in derived allele frequency (B and C) at fourfold sites, the expected patterns surrounding a selective sweep. However, the total number of zerofold variants is not reduced near sweeps (A), and the average frequency of derived zerofold alleles is increased near the sweeps (B and C).

References

    1. Lohmueller KE. The distribution of deleterious genetic variation in human populations. Curr Opin Genet Dev. 2014;29:139–146. - PubMed
    1. Lohmueller KE, et al. Proportionally more deleterious genetic variation in European than in African populations. Nature. 2008;451(7181):994–997. - PMC - PubMed
    1. Simons YB, Turchin MC, Pritchard JK, Sella G. The deleterious mutation load is insensitive to recent population history. Nat Genet. 2014;46(3):220–224. - PMC - PubMed
    1. Do R, et al. No evidence that selection has been less effective at removing deleterious mutations in Europeans than in Africans. Nat Genet. 2015;47(2):126–131. - PMC - PubMed
    1. Fu W, Gittelman RM, Bamshad MJ, Akey JM. Characteristics of neutral and deleterious protein-coding variation among individuals and populations. Am J Hum Genet. 2014;95(4):421–436. - PMC - PubMed

Publication types