. 2015 Dec 23;90(5):2628-38.
doi: 10.1128/JVI.02997-15.

Lipid Membranes Facilitate Conformational Changes Required for Reovirus Cell Entry

Affiliations

Lipid Membranes Facilitate Conformational Changes Required for Reovirus Cell Entry

Anthony J Snyder et al. J Virol. .

Abstract

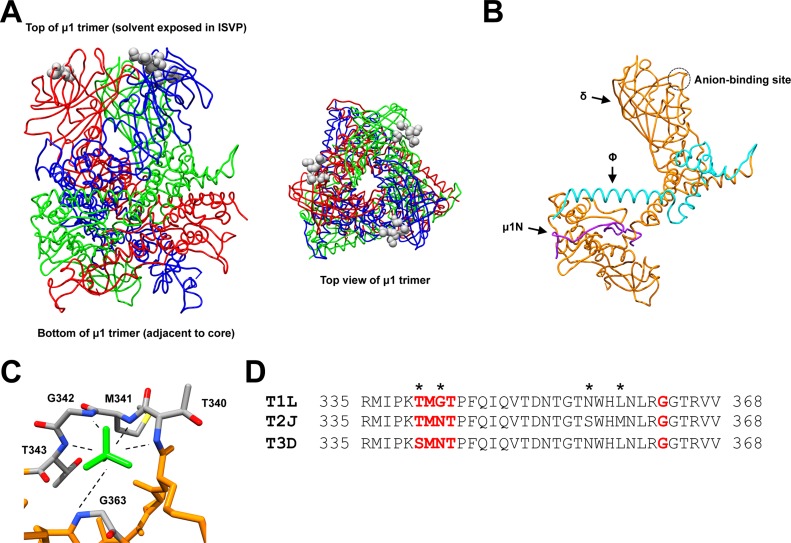
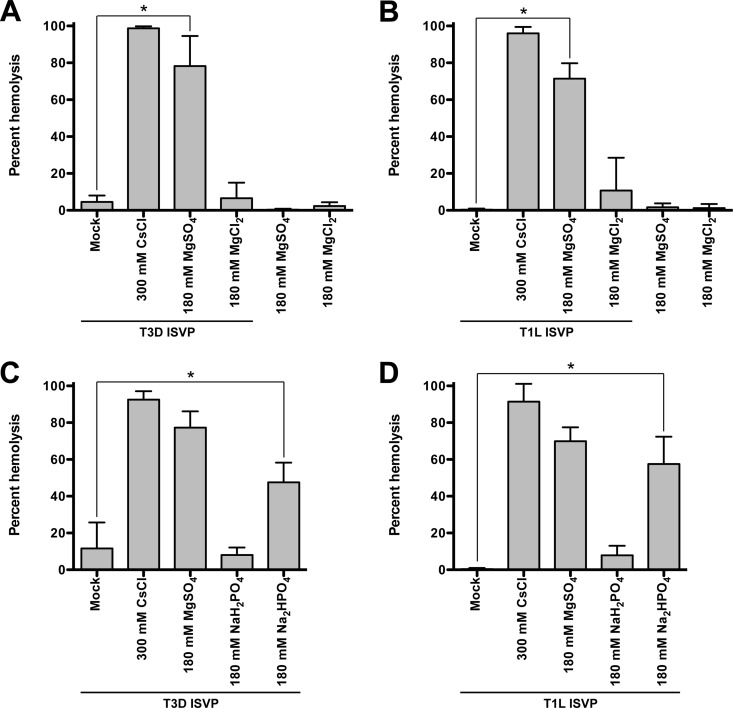
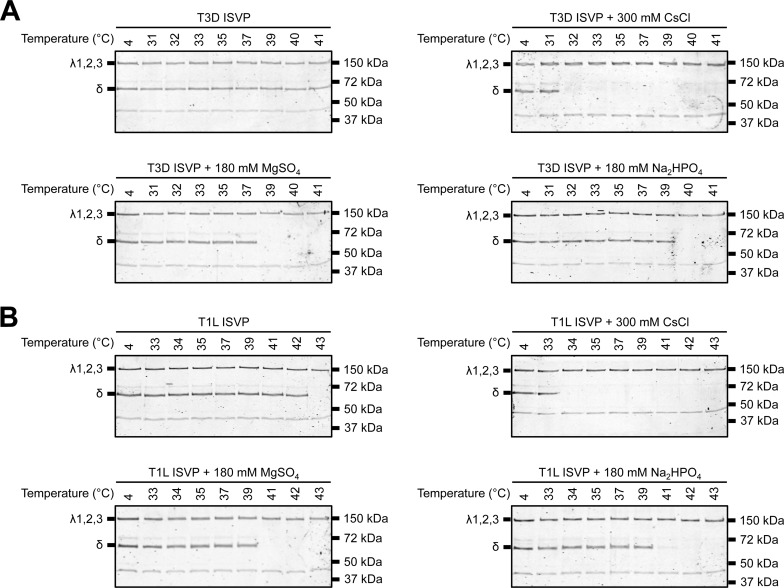
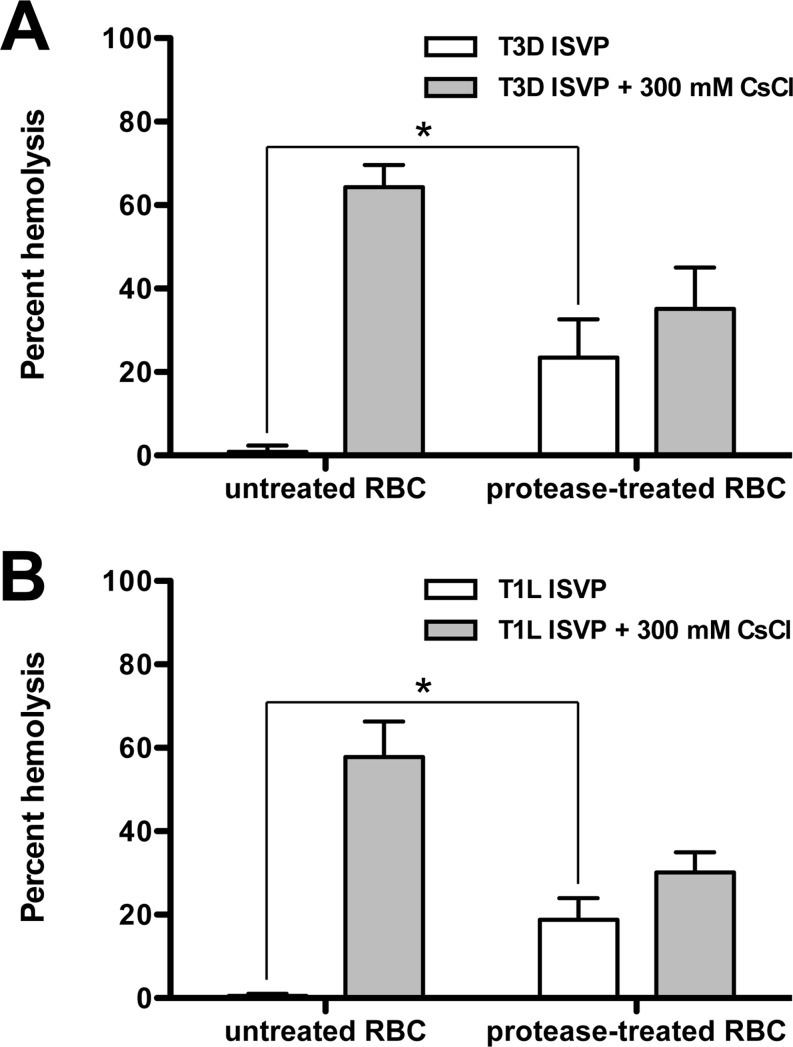
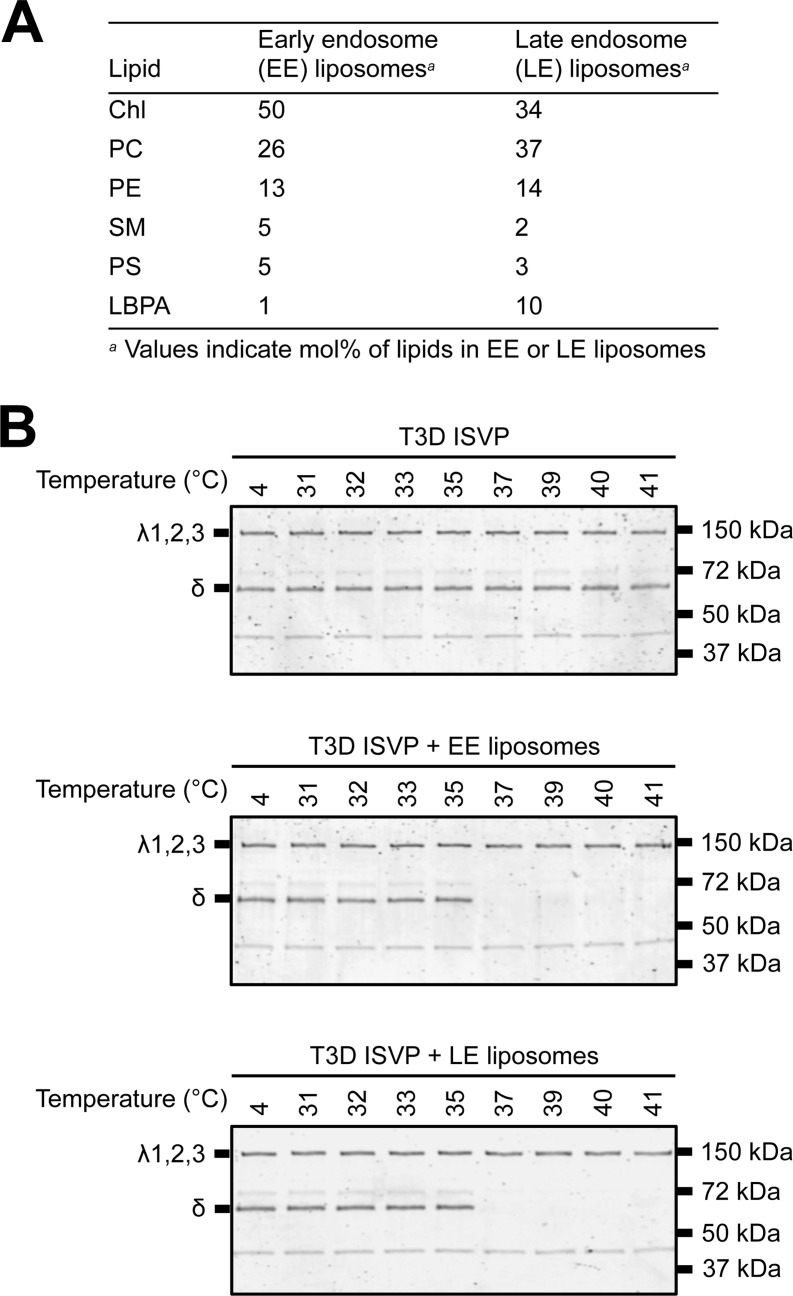
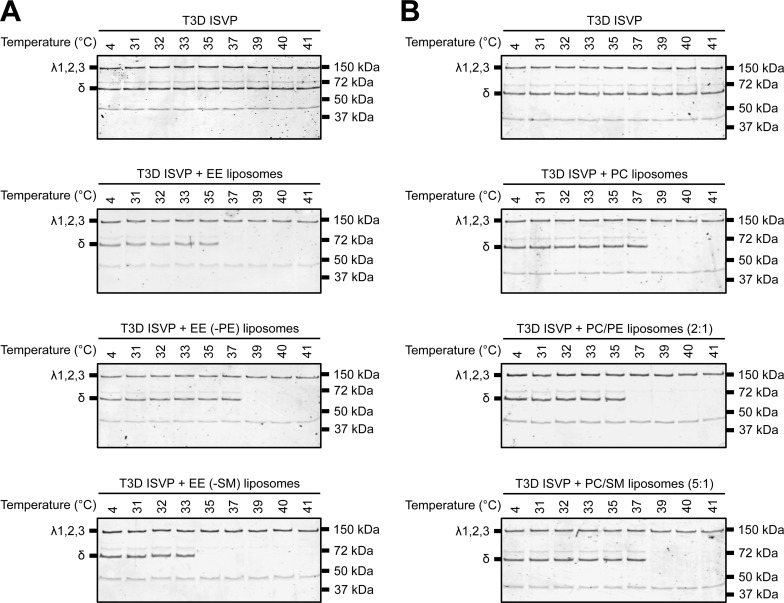
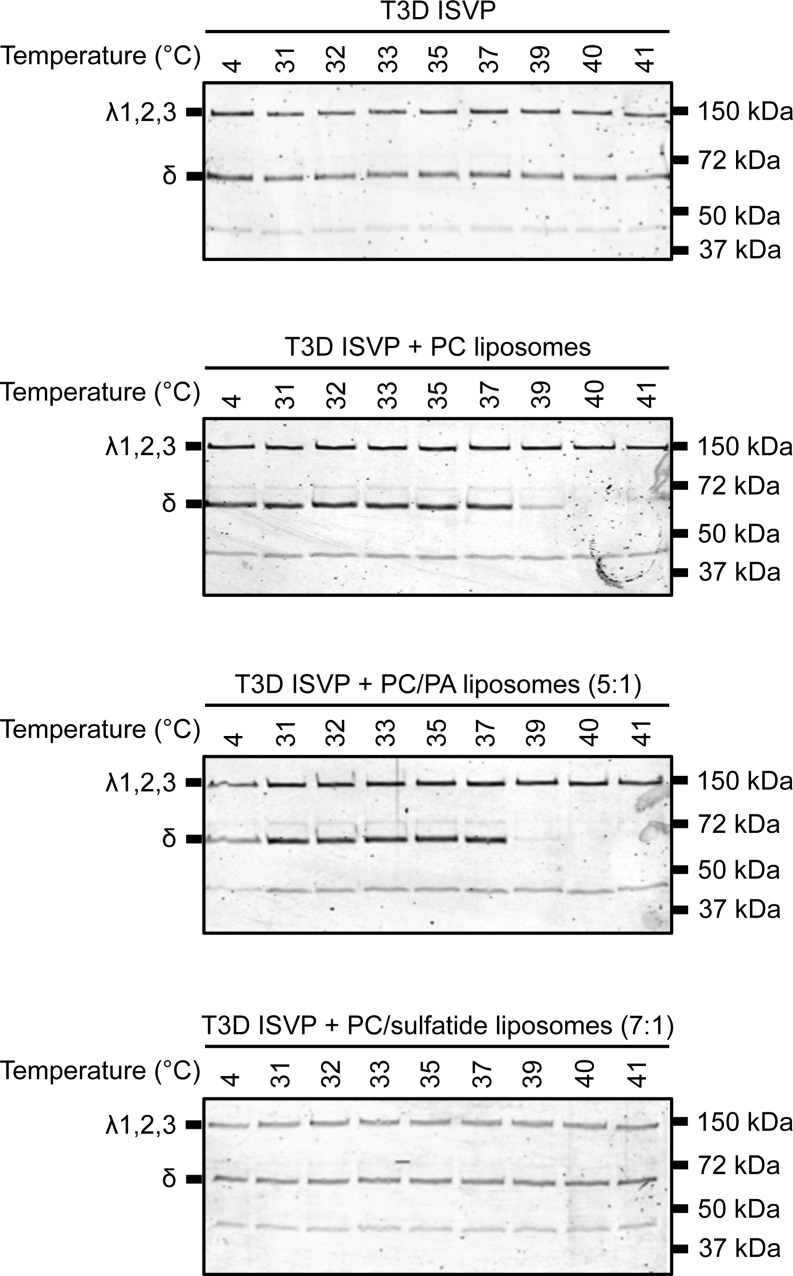
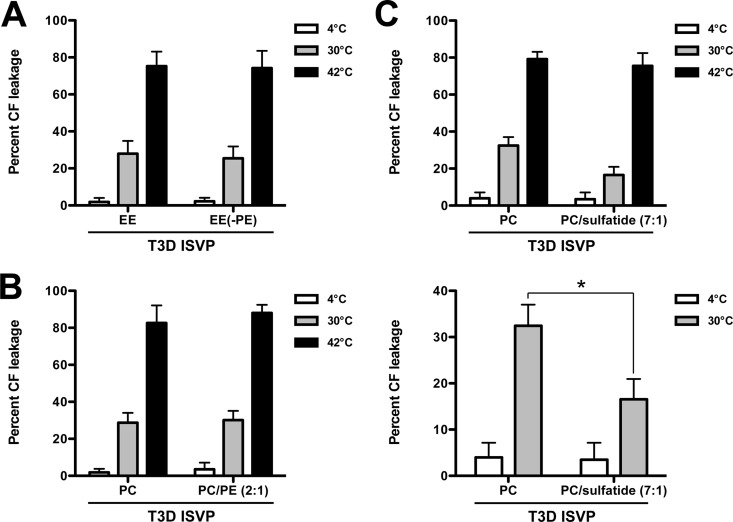
Cellular entry of nonenveloped and enveloped viruses is often accompanied by dramatic conformational changes within viral structural proteins. These rearrangements are triggered by a variety of mechanisms, such as low pH, virus-receptor interactions, and virus-host chaperone interactions. Reoviruses, a model system for entry of nonenveloped viruses, undergo a series of disassembly steps within the host endosome. One of these steps, infectious subviral particle (ISVP)-to-ISVP* conversion, is necessary for delivering the genome-containing viral core into host cells, but the physiological trigger that mediates ISVP-to-ISVP* conversion during cell entry is unknown. Structural studies of the reovirus membrane penetration protein, μ1, predict that interactions between μ1 and negatively charged lipid head groups may promote ISVP* formation; however, experimental evidence for this idea is lacking. Here, we show that the presence of polyanions (SO4(2-) and HPO4(2-)) or lipids in the form of liposomes facilitates ISVP-to-ISVP* conversion. The requirement for charged lipids appears to be selective, since phosphatidylcholine and phosphatidylethanolamine promoted ISVP* formation, whereas other lipids, such as sphingomyelin and sulfatide, either did not affect ISVP* formation or prevented ISVP* formation. Thus, our work provides evidence that interactions with membranes can function as a trigger for a nonenveloped virus to gain entry into host cells.

Importance: Cell entry, a critical stage in the virus life cycle, concludes with the delivery of the viral genetic material across host membranes. Regulated structural transitions within nonenveloped and enveloped viruses are necessary for accomplishing this step; these conformational changes are predominantly triggered by low pH and/or interactions with host proteins. In this work, we describe a previously unknown trigger, interactions with lipid membranes, which can induce the structural rearrangements required for cell entry. This mechanism operates during entry of mammalian orthoreoviruses. We show that interactions between reovirus entry intermediates and lipid membranes devoid of host proteins promote conformational changes within the viral outer capsid that lead to membrane penetration. Thus, this work illustrates a novel strategy that nonenveloped viruses can use to gain access into cells and how viruses usurp disparate host factors to initiate infection.


Figures

FIG 1
FIG 1
Structure and sequence of the reovirus μ1 protein. (A) Side and top views (left and right, respectively) of the T1L μ1 homotrimer (52) (PDB accession number 1JMU). Individual μ1 monomers are colored in red, blue, and green. Residues corresponding to the anion-binding site are represented as gray spheres. (B) Structure of the T1L μ1 monomer (52) (PDB accession number 1JMU). Purple, μ1N; teal, Φ; orange, δ. The anion-binding site is indicated with a circle. (C) Structure of the T1L μ1 anion-binding site (52) (PDB accession number 1JMU). Residues that form the anion-binding site are labeled and colored in gray (carbon), blue (nitrogen), red (oxygen), and yellow (sulfur). The sulfate ion is colored in green. (D) Amino acid sequence alignments of the reovirus μ1 anion-binding site. Residues that correspond to the anion-binding site are bolded in red. Residues that are not conserved within the sequence region are indicated with an asterisk.T1L, reovirus type 1 Lang; T2J, reovirus type 2 Jones; T3D, reovirus type 3 Dearing.
FIG 2
FIG 2
SO42− and HPO42− polyanions promote ISVP-induced hemolysis. T3D (A and C) or T1L (B and D) ISVPs (2 × 10¹² particles/ml) were incubated in a 3% (vol/vol) solution of untreated bovine red blood cells supplemented with 300 mM CsCl, 180 mM MgSO4, or 180 mM MgCl2 (A and B) or 300 mM CsCl, 180 mM MgSO4, 180 mM NaH2PO4, or 180 mM Na2HPO4 (C and D) for 2 h at 37°C. After 2 h, hemolysis was quantified by measuring the absorbance of the supernatant at 405 nm. Levels of 0 and 100% hemolysis were determined by incubating an equivalent number of RBCs in virus storage buffer or virus storage buffer supplemented with 0.8% Triton X-100, respectively, for 2 h at 37°C. For each condition, the mean percent hemolysis was determined from at least three independent experiments. Error bars indicate standard deviations. P values were calculated using Student's t test. *, P ≤ 0.05.
FIG 3
FIG 3
SO42− and HPO42− polyanions promote ISVP-to-ISVP* conversion. T3D (A) or T1L (B) ISVPs (2 × 10¹² particles/ml) were incubated in virus storage buffer supplemented with 300 mM CsCl, 180 mM MgSO4, or 180 mM Na2HPO4 for 1 h at the indicated temperatures. After 1 h, the reaction mixtures were treated with trypsin (0.08 mg/ml) for 30 min on ice. Following digestion, the reaction mixtures were solubilized in reducing SDS sample buffer and analyzed by SDS-PAGE. The gels were Coomassie stained. The migration of the λ1,2,3 and δ bands is indicated to the left of each panel. The migration of molecular mass markers is indicated to the right of each panel.
FIG 4
FIG 4
ISVP-induced hemolysis of untreated and protease-treated RBCs. T3D (A) or T1L (B) ISVPs (2 × 10¹² particles/ml) were incubated in a 3% (vol/vol) solution of untreated or protease-treated bovine RBCs in the absence or presence of 300 mM CsCl for 2 h at 37°C. After 2 h, hemolysis was quantified by measuring the absorbance of the supernatant at 405 nm. Levels of 0 and 100% hemolysis were determined by incubating an equivalent number of RBCs in virus storage buffer or virus storage buffer supplemented with 0.8% Triton X-100, respectively, for 2 h at 37°C. For each condition, the mean percent hemolysis was determined from at least three independent experiments. Error bars indicate standard deviations. P values were calculated using Student's t test. *, P ≤ 0.05.
FIG 5
FIG 5
Liposomes that mimic the composition of the early or late endosomal membranes facilitate ISVP-to-ISVP* conversion. (A) Lipid compositions of the EE and LE liposomes. (B) EE or LE liposome-mediated ISVP-to-ISVP* conversion. T3D ISVPs (2 × 10¹² particles/ml) were incubated in virus storage buffer supplemented with 1 mM EE or LE liposomes for 1 h at the indicated temperatures. After 1 h, the reaction mixtures were treated with trypsin (0.08 mg/ml) for 30 min on ice. Following digestion, the reaction mixtures were solubilized in reducing SDS sample buffer and analyzed by SDS-PAGE. The gels were Coomassie stained. The migration of the λ1,2,3 and δ bands is indicated to the left of each panel. The migration of molecular mass markers is indicated to the right of each panel.
FIG 6
FIG 6
PC and PE are the main contributors to lipid-mediated ISVP-to-ISVP* conversion. T3D ISVPs (2 × 10¹² particles/ml) were incubated in virus storage buffer supplemented with 1 mM EE, EE without PE, or EE without SM liposomes (A) or 1 mM PC, PC-PE (2:1), or PC-SM (5:1) liposomes for 1 h at the indicated temperatures. After 1 h, the reaction mixtures were treated with trypsin (0.08 mg/ml) for 30 min on ice. Following digestion, the reaction mixtures were solubilized in reducing SDS sample buffer and analyzed by SDS-PAGE. The gels were Coomassie stained. The migration of the λ1,2,3 and δ bands is indicated to the left of each panel. The migration of molecular mass markers is indicated to the right of each panel.
FIG 7
FIG 7
Liposomes composed of PC and PC-PA (5:1) promote ISVP-to-ISVP* conversion. T3D ISVPs (2 × 10¹² particles/ml) were incubated in virus storage buffer supplemented with 1 mM PC, PC-PA (5:1), or PC-sulfatide (7:1) liposomes for 1 h at the indicated temperatures. After 1 h, the reaction mixtures were treated with trypsin (0.08 mg/ml) for 30 min on ice. Following digestion, the reaction mixtures were solubilized in reducing SDS sample buffer and analyzed by SDS-PAGE. The gels were Coomassie stained. The migration of the λ1,2,3 and δ bands is indicated to the left of each panel. The migration of molecular mass markers is indicated to the right of each panel.
FIG 8
FIG 8
PC liposomes trigger ISVP-to-ISVP* conversion and pore formation more efficiently than PC-sulfatide (7:1) liposomes. T3D ISVPs (2 × 10¹² particles/ml) were incubated in virus storage buffer supplemented with CF-loaded EE or EE without PE liposomes (A), CF-loaded PC or PC-PE (2:1) liposomes (B), or CF-loaded PC or PC-sulfatide (7:1) liposomes (C) for 1 h at the indicated temperatures. After 1 h, the reaction mixtures were diluted 1:50 into virus storage buffer. The samples were equilibrated at room temperature for 15 min prior to measuring fluorescence. Levels of 0 and 100% CF leakage were determined by incubating an equivalent number of CF-loaded liposomes in virus storage buffer or virus storage buffer supplemented with 0.5% Triton X-100, respectively, for 1 h at the indicated temperatures. For each condition, the mean percent CF leakage was determined from at least three independent experiments. The same data are shown in the upper and lower panels of panel C, except the range of percent CF leakage in the lower panel is reduced to highlight the differences between samples. Error bars indicate standard deviations. P values were calculated using Student's t test. *, P ≤ 0.05.
FIG 9
FIG 9
T3D ISVPs induce pore formation in PC liposomes more efficiently than T1L ISVPs. T3D or T1L ISVPs (2 × 10¹² particles/ml) were incubated in virus storage buffer supplemented with CF-loaded PC liposomes for 1 h at the indicated temperatures. After 1 h, the reaction mixtures were diluted 1:50 into virus storage buffer. The samples were equilibrated at room temperature for 15 min prior to measuring fluorescence. Levels of 0 and 100% CF leakage were determined by incubating an equivalent number of CF-loaded liposomes in virus storage buffer or virus storage buffer supplemented with 0.5% Triton X-100, respectively, for 1 h at the indicated temperatures. For each condition, the mean percent CF leakage was determined from at least three independent experiments. Error bars indicate standard deviations. P values were calculated using Student's t test. *, P ≤ 0.05.

References

    1. Bayer N, Schober D, Huttinger M, Blaas D, Fuchs R. 2001. Inhibition of clathrin-dependent endocytosis has multiple effects on human rhinovirus serotype 2 cell entry. J Biol Chem 276:3952–3962. doi:10.1074/jbc.M004722200. - DOI - PubMed
    1. Bayer N, Schober D, Prchla E, Murphy RF, Blaas D, Fuchs R. 1998. Effect of bafilomycin A1 and nocodazole on endocytic transport in HeLa cells: implications for viral uncoating and infection. J Virol 72:9645–9655. - PMC - PubMed
    1. Stegmann T, Booy FP, Wilschut J. 1987. Effects of low pH on influenza virus. Activation and inactivation of the membrane fusion capacity of the hemagglutinin. J Biol Chem 262:17744–17749. - PubMed
    1. White J, Helenius A, Gething MJ. 1982. Haemagglutinin of influenza virus expressed from a cloned gene promotes membrane fusion. Nature 300:658–659. doi:10.1038/300658a0. - DOI - PubMed
    1. Yoshimura A, Ohnishi S. 1984. Uncoating of influenza virus in endosomes. J Virol 51:497–504. - PMC - PubMed

Publication types

Associated data

LinkOut - more resources