

Genetic variation in total number and locations of GnRH neurons identified using in situ hybridization in a wild-source population
- PMID: 26699837
- PMCID: PMC6779586
- DOI: 10.1002/jez.2000
Genetic variation in total number and locations of GnRH neurons identified using in situ hybridization in a wild-source population
Abstract
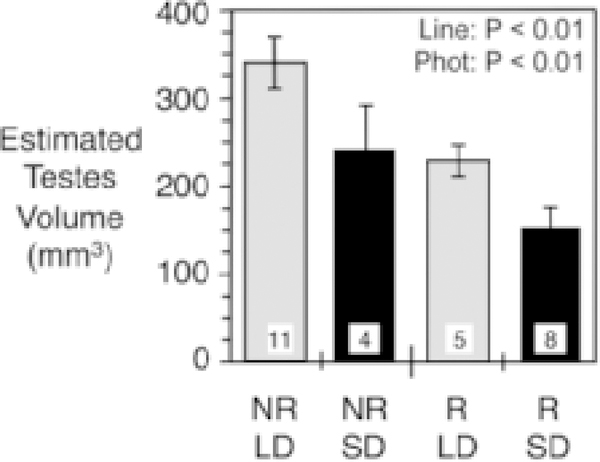
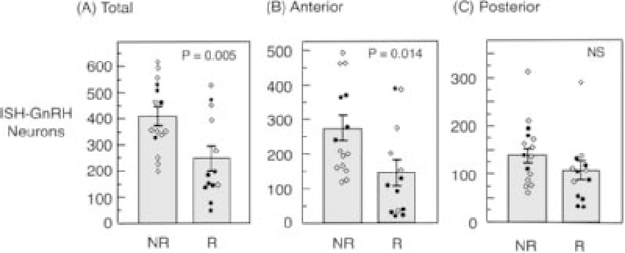
The evolution of brain function in the regulation of physiology may depend in part upon the numbers and locations of neurons. Wild populations of rodents contain natural genetic variation in the inhibition of reproduction by winter-like short photoperiod, and it has been hypothesized that this functional variation might be due in part to heritable variation in the numbers or location of gonadotropin releasing hormone (GnRH) neurons. A naturally variable wild-source population of white-footed mice was used to develop lines artificially selected for or against mature gonads in short, winter-like photoperiods. We compared a selection line that is reproductively inhibited in short photoperiod (Responsive) to a line that is weakly inhibited by short photoperiod (Nonresponsive) for differences in counts of neurons identified using in situ hybridization for GnRH mRNA. There was no effect of photoperiod, but there were 60% more GnRH neurons in total in the Nonresponsive selection line than the Responsive selection line. The lines differed specifically in numbers of GnRH neurons in more anterior regions, whereas numbers of GnRH neurons in posterior areas were not statistically different between lines. We compare these results to those of an earlier study that used immunohistochemical labeling for GnRH neurons. The results are consistent with the hypothesis that the selection lines and natural source population contain significant genetic variation in the number and location of GnRH neurons. The variation in GnRH neurons may contribute to functional variation in fertility that occurs in short photoperiods in the laboratory and in the wild source population in winter.
© 2015 Wiley Periodicals, Inc.
Conflict of interest statement
Conflicts of interest: None.
Figures

Similar articles
-
Response to selection for photoperiod responsiveness on the density and location of mature GnRH-releasing neurons.Am J Physiol Regul Integr Comp Physiol. 2005 May;288(5):R1226-36. doi: 10.1152/ajpregu.00562.2004. Epub 2005 Jan 13. Am J Physiol Regul Integr Comp Physiol. 2005. PMID: 15650126
-
Variation in levels of luteinizing hormone and reproductive photoresponsiveness in a population of white-footed mice (Peromyscus leucopus).Am J Physiol Regul Integr Comp Physiol. 2010 Jun;298(6):R1543-8. doi: 10.1152/ajpregu.00686.2009. Epub 2010 Mar 31. Am J Physiol Regul Integr Comp Physiol. 2010. PMID: 20357020 Free PMC article.
-
Phenotypic differences in the GnRH neuronal system of deer mice Peromyscus maniculatus under a natural short photoperiod.J Reprod Fertil. 1998 Nov;114(2):231-5. doi: 10.1530/jrf.0.1140231. J Reprod Fertil. 1998. PMID: 10070352
-
The role of kisspeptin and gonadotropin inhibitory hormone in the seasonal regulation of reproduction in sheep.Domest Anim Endocrinol. 2012 Aug;43(2):75-84. doi: 10.1016/j.domaniend.2011.11.003. Epub 2011 Nov 27. Domest Anim Endocrinol. 2012. PMID: 22177698 Review.
-
Photoperiodic control of seasonality in birds.J Biol Rhythms. 2001 Aug;16(4):365-80. doi: 10.1177/074873001129002079. J Biol Rhythms. 2001. PMID: 11506381 Review.
Cited by
-
Timing as a sexually selected trait: the right mate at the right moment.Philos Trans R Soc Lond B Biol Sci. 2017 Nov 19;372(1734):20160249. doi: 10.1098/rstb.2016.0249. Philos Trans R Soc Lond B Biol Sci. 2017. PMID: 28993493 Free PMC article. Review.
References
-
- Abercrombie M 1946. Estimation of nuclear population from microtome sections. Anat Rec 94:239–247. - PubMed
-
- Anderson DR. 2008. Model based inference in the life sciences: a primer on evidence. New York: Springer.
-
- Avigdor M, Sullivan SD, Heideman PD. 2005. Response to selection for photoperiod responsiveness on the density and location of mature GnRH-releasing neurons. Am J Physiol Regul Integr Comp Physiol 288:1226–1236. - PubMed
-
- Bartholemew GA. 1987. Interspecific comparison as a tool for ecological physiologists In: Feder ME, Bennett AF, Burggren WW, Huey RB, editors. New directions in ecological physiology. Cambridge, UK: Cambridge University Press; p 11–35.
-
- Bittner GD, Friedman BX. 2000. Evolution of brain structures and adaptive behaviors in humans and other animals: role of polymorphic genetic variations. Neuroscientist 6:241–251.
Publication types
MeSH terms
Substances
Grants and funding
LinkOut - more resources
Full Text Sources
Other Literature Sources
