Enface Thickness Mapping and Reflectance Imaging of Retinal Layers in Diabetic Retinopathy
- PMID: 26699878
- PMCID: PMC4699197
- DOI: 10.1371/journal.pone.0145628
Enface Thickness Mapping and Reflectance Imaging of Retinal Layers in Diabetic Retinopathy
Abstract
Purpose: To present a method for image segmentation and generation of enface thickness maps and reflectance images of retinal layers in healthy and diabetic retinopathy (DR) subjects.
Methods: High density spectral domain optical coherence tomography (SDOCT) images were acquired in 10 healthy and 4 DR subjects. Customized image analysis software identified 5 retinal cell layer interfaces and generated thickness maps and reflectance images of the total retina (TR), inner retina (IR), outer retina (OR), and the inner segment ellipsoid (ISe) band. Thickness maps in DR subjects were compared to those of healthy subjects by generating deviation maps which displayed retinal locations with thickness below, within, and above the normal 95% confidence interval.
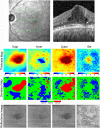
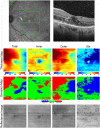
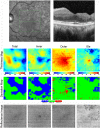
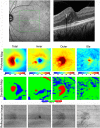
Results: In healthy subjects, TR and IR thickness maps displayed the foveal depression and increased thickness in the parafoveal region. OR and ISe thickness maps showed increased thickness at the fovea, consistent with normal retinal anatomy. In DR subjects, thickening and thinning in localized regions were demonstrated on TR, IR, OR, and ISe thickness maps, corresponding to retinal edema and atrophy, respectively. TR and OR reflectance images showed reduced reflectivity in regions of increased thickness. Hard exudates appeared as hyper-reflective spots in IR reflectance images and casted shadows on the deeper OR and ISe reflectance images. The ISe reflectance image clearly showed the presence of focal laser scars.
Conclusions: Enface thickness mapping and reflectance imaging of retinal layers is a potentially useful method for quantifying the spatial and axial extent of pathologies due to DR.
Conflict of interest statement
Figures


Similar articles
-
Alterations in Retinal Layer Thickness and Reflectance at Different Stages of Diabetic Retinopathy by En Face Optical Coherence Tomography.Invest Ophthalmol Vis Sci. 2016 Jul 1;57(9):OCT341-7. doi: 10.1167/iovs.15-18715. Invest Ophthalmol Vis Sci. 2016. PMID: 27409491 Free PMC article.
-
Feasibility of a method for en face imaging of photoreceptor cell integrity.Am J Ophthalmol. 2011 Nov;152(5):807-14.e1. doi: 10.1016/j.ajo.2011.04.027. Epub 2011 Jul 20. Am J Ophthalmol. 2011. PMID: 21764030 Free PMC article.
-
Inner and outer retinal thickness mapping of nonproliferative diabetic retinopathy by spectral-domain optical coherence tomography.Ophthalmic Surg Lasers Imaging Retina. 2015 Mar;46(3):316-20. doi: 10.3928/23258160-20150323-03. Ophthalmic Surg Lasers Imaging Retina. 2015. PMID: 25856816
-
Retinal imaging and image analysis.IEEE Rev Biomed Eng. 2010;3:169-208. doi: 10.1109/RBME.2010.2084567. IEEE Rev Biomed Eng. 2010. PMID: 22275207 Free PMC article. Review.
-
Layer-specific anatomical, physiological and functional MRI of the retina.NMR Biomed. 2008 Nov;21(9):978-96. doi: 10.1002/nbm.1311. NMR Biomed. 2008. PMID: 18792422 Free PMC article. Review.
Cited by
-
The Impact of Glycemic Control on Retinal Photoreceptor Layers and Retinal Pigment Epithelium in Patients With Type 2 Diabetes Without Diabetic Retinopathy: A Follow-Up Study.Front Endocrinol (Lausanne). 2021 Apr 23;12:614161. doi: 10.3389/fendo.2021.614161. eCollection 2021. Front Endocrinol (Lausanne). 2021. PMID: 33967950 Free PMC article.
-
Deep longitudinal transfer learning-based automatic segmentation of photoreceptor ellipsoid zone defects on optical coherence tomography images of macular telangiectasia type 2.Biomed Opt Express. 2018 May 16;9(6):2681-2698. doi: 10.1364/BOE.9.002681. eCollection 2018 Jun 1. Biomed Opt Express. 2018. PMID: 30258683 Free PMC article.
-
Visualizing Structure and Vascular Interactions: Macular Nonperfusion in Three Capillary Plexuses.Ophthalmic Surg Lasers Imaging Retina. 2018 Nov 1;49(11):e182-e190. doi: 10.3928/23258160-20181101-16. Ophthalmic Surg Lasers Imaging Retina. 2018. PMID: 30457654 Free PMC article.
-
Beyond Performance Metrics: Automatic Deep Learning Retinal OCT Analysis Reproduces Clinical Trial Outcome.Ophthalmology. 2020 Jun;127(6):793-801. doi: 10.1016/j.ophtha.2019.12.015. Epub 2019 Dec 23. Ophthalmology. 2020. PMID: 32019699 Free PMC article. Clinical Trial.
-
Imaging the eye as a window to brain health: frontier approaches and future directions.J Neuroinflammation. 2024 Nov 29;21(1):309. doi: 10.1186/s12974-024-03304-3. J Neuroinflammation. 2024. PMID: 39614308 Free PMC article. Review.
References
-
- Otani T, Kishi S, Maruyama Y. Patterns of diabetic macular edema with optical coherence tomography. Am J Ophthalmol. 1999;127(6):688–93. . - PubMed
Publication types
MeSH terms
Grants and funding
LinkOut - more resources
Full Text Sources
Other Literature Sources
Medical

