. 2015 Dec 23:17:115.
doi: 10.1186/s12968-015-0217-y.

Mapping tissue inhomogeneity in acute myocarditis: a novel analytical approach to quantitative myocardial edema imaging by T2-mapping

Affiliations

Mapping tissue inhomogeneity in acute myocarditis: a novel analytical approach to quantitative myocardial edema imaging by T2-mapping

Bettina Baeßler et al. J Cardiovasc Magn Reson. .

Abstract

Background: The purpose of the present study was to investigate the diagnostic value of T2-mapping in acute myocarditis (ACM) and to define cut-off values for edema detection.

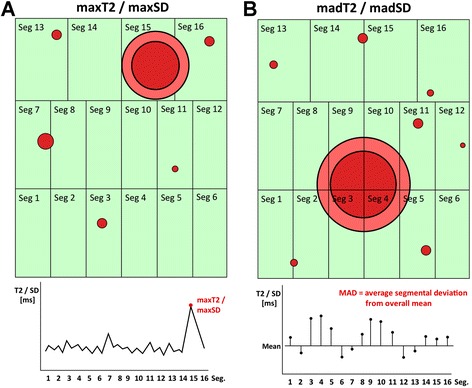
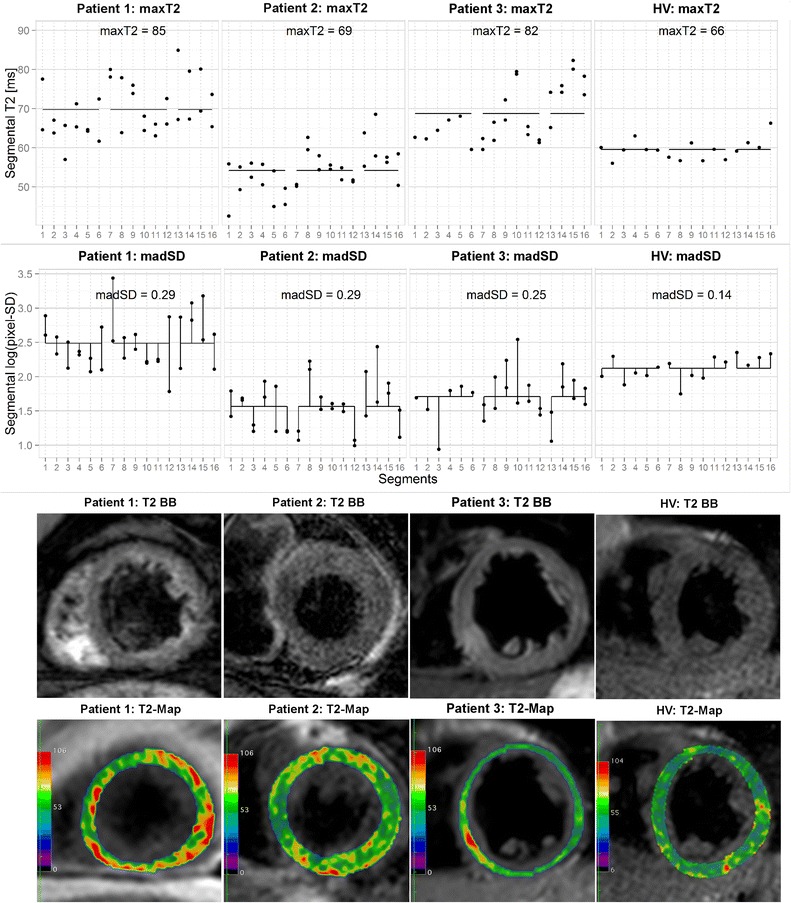
Methods: Cardiovascular magnetic resonance (CMR) data of 31 patients with ACM were retrospectively analyzed. 30 healthy volunteers (HV) served as a control. Additionally to the routine CMR protocol, T2-mapping data were acquired at 1.5 T using a breathhold Gradient-Spin-Echo T2-mapping sequence in six short axis slices. T2-maps were segmented according to the 16-segments AHA-model and segmental T2 values as well as the segmental pixel-standard deviation (SD) were analyzed.

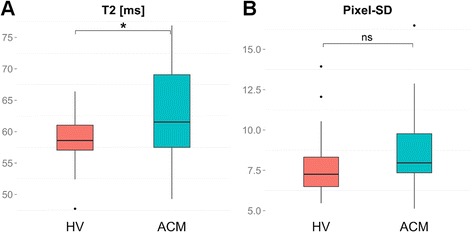
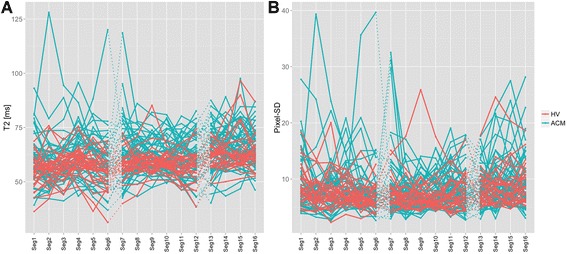
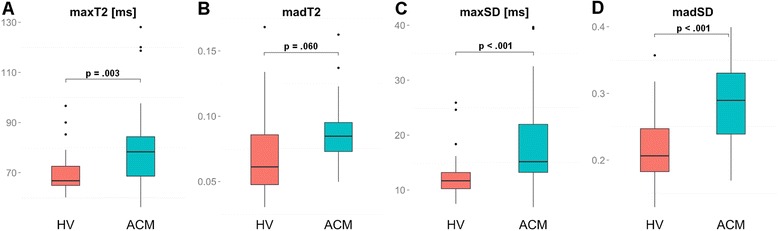
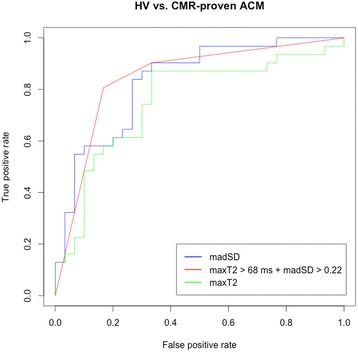
Results: Mean differences of global myocardial T2 or pixel-SD between HV and ACM patients were only small, lying in the normal range of HV. In contrast, variation of segmental T2 values and pixel-SD was much larger in ACM patients compared to HV. In random forests and multiple logistic regression analyses, the combination of the highest segmental T2 value within each patient (maxT2) and the mean absolute deviation (MAD) of log-transformed pixel-SD (madSD) over all 16 segments within each patient proved to be the best discriminators between HV and ACM patients with an AUC of 0.85 in ROC-analysis. In classification trees, a combined cut-off of 0.22 for madSD and of 68 ms for maxT2 resulted in 83% specificity and 81% sensitivity for detection of ACM.

Conclusions: The proposed cut-off values for maxT2 and madSD in the setting of ACM allow edema detection with high sensitivity and specificity and therefore have the potential to overcome the hurdles of T2-mapping for its integration into clinical routine.


Figures

Fig. 1
Fig. 1
Box-Whisker plots representing the differences of global myocardial T2 (a) and pixel-SD (b) between HV and ACM patients. The centreline in each box represents the median, whereas the lower and upper limits of each box represent the 25th and 75th percentiles, respectively. Whiskers extend to the most extreme observations within 25th and 75th percentiles ± 1.5*IQR. Observations outside these whiskers are shown as dots. *** IQR - inter-quartile-range, ACM - acute myocarditis, HV - healthy volunteers
Fig. 2
Fig. 2
Individual variation of segmental values for myocardial T2 times (a) and pixel-SD (b) over all 16 segments, where each line represents an individual subject, thereby comparing HV (red) and ACM patients (blue). ACM - acute myocarditis, HV - healthy volunteers
Fig. 3
Fig. 3
Graphical illustration of the novel concepts of maxT2/maxSD (a) and madT2/madSD (b). Each box represents one segment (1–16) of one individual. Red dots represent focal spots of myocardial inflammation. The graphs at the bottom illustrate the corresponding individual T2/Pixel-SD values, aufgetragen over all 16 segments in order to define maxT2/maxSD (a) as well as madT2/madSD (b). In b, black horizontal lines indicate the mean across segments. Vertical black lines for madT2/madSD illustrate the deviations from mean that are averaged to obtain the MAD. MAD - mean absolute deviation. Seg. - segment
Fig. 4
Fig. 4
Box-Whisker plots representing the differences of maxT2 (a), madT2 (b), maxSD (c), and madSD (d) between HV and ACM patients. The centreline in each box represents the median, whereas the lower and upper limits of each box represent the 25th and 75th percentiles, respectively. Whiskers extend to the most extreme observations within 25th and 75th percentiles ± 1.5*IQR. Observations outside these whiskers are shown as dots. *** IQR - inter-quartile-range, ACM - acute myocarditis, HV - healthy volunteers
Fig. 5
Fig. 5
ROC-Analysis for differentiating CMR-proven ACM patients from HV. ACM - acute myocarditis, HV - healthy volunteers
Fig. 6
Fig. 6
Segmental T2 (first row), log-transformed pixel-SD (second row), T2 black-blood images of one short axis slice, and corresponding T2-maps for 4 selected subjects. Black horizontal lines indicate the mean across segments. Vertical black lines for madSD illustrate the deviations from mean that are averaged to obtain madSD

References

    1. Cooper LT, Fairweather D. We see only what we look for: imaging cardiac inflammation. Circ. Cardiovasc. Imaging. 2013;6:165–166. doi: 10.1161/CIRCIMAGING.113.000166. - DOI - PMC - PubMed
    1. Greulich S, Ferreira VM, Dall’Armellina E, Mahrholdt H. Myocardial Inflammation-Are We There Yet? Curr Cardiovasc Imaging Rep. 2015;8:6–11. doi: 10.1007/s12410-015-9320-6. - DOI - PMC - PubMed
    1. Park CH, Choi E-Y, Greiser A, Paek MY, Hwang SH, Kim TH. Diagnosis of acute global myocarditis using cardiac MRI with quantitative t1 and t2 mapping: case report and literature review. Korean J Radiol. 2013;14:727–732. doi: 10.3348/kjr.2013.14.5.727. - DOI - PMC - PubMed
    1. Buser PT. Prediction of LV functional recovery by CMR in myocarditis: bright signals--bright answers? Eur Heart J Cardiovasc Imaging. 2014;15:1177–1178. doi: 10.1093/ehjci/jeu130. - DOI - PubMed
    1. Francone M, Chimenti C, Galea N, Scopelliti F, Verardo R, Galea R, et al. CMR sensitivity varies with clinical presentation and extent of cell necrosis in biopsy-proven acute myocarditis. J Am Coll Cardiol Img. 2014;7:254–263. doi: 10.1016/j.jcmg.2013.10.011. - DOI - PubMed