

Human Adipose Stromal/Stem Cells from Obese Donors Show Reduced Efficacy in Halting Disease Progression in the Experimental Autoimmune Encephalomyelitis Model of Multiple Sclerosis
- PMID: 26700612
- PMCID: PMC4803617
- DOI: 10.1002/stem.2272
Human Adipose Stromal/Stem Cells from Obese Donors Show Reduced Efficacy in Halting Disease Progression in the Experimental Autoimmune Encephalomyelitis Model of Multiple Sclerosis
Abstract
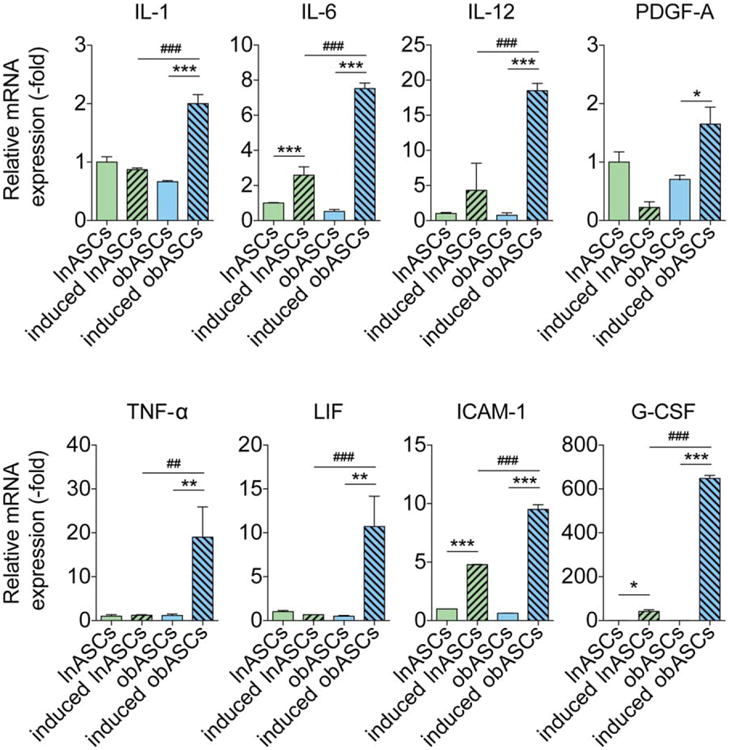
Multiple sclerosis is an autoimmune disease that affects the white matter of the central nervous system and involves inflammation and demyelination. The recent advances in our understanding of adipose-derived stromal/stem cells (ASCs) and the utilization of these cells in clinical settings to treat diseases have made it essential to identify the most effective ASCs for therapy. Studies have not yet investigated the impact of obesity on the therapeutic efficacy of ASCs. Obesity is characterized by adipocyte hyperplasia and hypertrophy and can extend to metabolic and endocrine dysfunction. Investigating the impact obesity has on ASC biology will determine whether these cells are suitable for use in regenerative medicine. The therapeutic efficacy of ASCs isolated from lean subjects (body mass index [BMI] < 25; lnASCs) and obese subjects (BMI > 30; obASCs) were determined in murine experimental autoimmune encephalomyelitis (EAE), a model of multiple sclerosis. Compared with the EAE disease-modifying effects of lnASCs, obASCs consistently failed to alleviate clinical symptoms or inhibit inflammation in the central nervous system. When activated, obASCs expressed higher mRNA levels of several pro-inflammatory cytokines compared with lnASCs. Additionally, conditioned media (CM) collected from the obASCs markedly enhanced the proliferation and differentiation of T cells; whereas, CM from lnASC did not. These results indicate that obesity reduces, or eliminates, the anti-inflammatory effects of human ASCs such that they may not be a suitable cell source for the treatment of autoimmune diseases. The data suggest that donor demographics may be particularly important when identifying suitable stem cells for treatment.
Keywords: Adipose stromal/stem cells; Adipose-derived stromal/stem cells; Experimental autoimmune encephalomyelitis; Immunomodulatory properties; Multiple sclerosis; Obesity; Therapeutic efficacy.
© 2016 AlphaMed Press.
Conflict of interest statement
Figures


Similar articles
-
Adipose-derived mesenchymal stem cells modulate the immune response in chronic experimental autoimmune encephalomyelitis model.IUBMB Life. 2016 Feb;68(2):106-15. doi: 10.1002/iub.1469. Epub 2016 Jan 12. IUBMB Life. 2016. PMID: 26757144 Review.
-
Transplantation of autologous adipose stem cells lacks therapeutic efficacy in the experimental autoimmune encephalomyelitis model.PLoS One. 2014 Jan 21;9(1):e85007. doi: 10.1371/journal.pone.0085007. eCollection 2014. PLoS One. 2014. PMID: 24465465 Free PMC article.
-
Adipose-derived mesenchymal stem cells ameliorate chronic experimental autoimmune encephalomyelitis.Stem Cells. 2009 Oct;27(10):2624-35. doi: 10.1002/stem.194. Stem Cells. 2009. PMID: 19676124
-
Age of the donor reduces the ability of human adipose-derived stem cells to alleviate symptoms in the experimental autoimmune encephalomyelitis mouse model.Stem Cells Transl Med. 2013 Oct;2(10):797-807. doi: 10.5966/sctm.2013-0026. Epub 2013 Sep 9. Stem Cells Transl Med. 2013. PMID: 24018793 Free PMC article.
-
Mesenchymal stem cells and induced pluripotent stem cells as therapies for multiple sclerosis.Int J Mol Sci. 2015 Apr 24;16(5):9283-302. doi: 10.3390/ijms16059283. Int J Mol Sci. 2015. PMID: 25918935 Free PMC article. Review.
Cited by
-
Anti-Proliferative Activity of Glucagon-Like Peptide-1 Receptor Agonist on Obesity-Associated Breast Cancer: The Impact on Modulating Adipokines' Expression in Adipocytes and Cancer Cells.Dose Response. 2021 Feb 22;19(1):1559325821995651. doi: 10.1177/1559325821995651. eCollection 2021 Jan-Mar. Dose Response. 2021. PMID: 33746653 Free PMC article.
-
Exosomes From Adipose-Derived Stem Cells: The Emerging Roles and Applications in Tissue Regeneration of Plastic and Cosmetic Surgery.Front Cell Dev Biol. 2020 Sep 10;8:574223. doi: 10.3389/fcell.2020.574223. eCollection 2020. Front Cell Dev Biol. 2020. PMID: 33015067 Free PMC article. Review.
-
A Preview of Selected Articles.Stem Cells Transl Med. 2018 Oct;7(10):699-701. doi: 10.1002/sctm.18-0194. Stem Cells Transl Med. 2018. PMID: 30317701 Free PMC article. Review. No abstract available.
-
Mesenchymal Stem Cells in Multiple Sclerosis: Recent Evidence from Pre-Clinical to Clinical Studies.Int J Mol Sci. 2020 Nov 17;21(22):8662. doi: 10.3390/ijms21228662. Int J Mol Sci. 2020. PMID: 33212873 Free PMC article. Review.
-
Short-Term Rapamycin Preconditioning Diminishes Therapeutic Efficacy of Human Adipose-Derived Stem Cells in a Murine Model of Multiple Sclerosis.Cells. 2020 Sep 30;9(10):2218. doi: 10.3390/cells9102218. Cells. 2020. PMID: 33008073 Free PMC article.
References
-
- Philippe J, Debruyne J, Leroux-Roels G, et al. In vitro TNF-alpha, IL-2 and IFN-gamma production as markers of relapses in multiple sclerosis. Clin Neurol Neurosurg. 1996;98:286–290. - PubMed
-
- Dutta R, Trapp BD. Pathogenesis of axonal and neuronal damage in multiple sclerosis. Neurology. 2007;68:S22–31. discussion S43-54. - PubMed
-
- La Mantia L, Di Pietrantonj C, Rovaris M, et al. Interferons-beta versus glatiramer acetate for relapsing-remitting multiple sclerosis. Cochrane Database Syst Rev. 2014;7:Cd009333. - PubMed
Publication types
MeSH terms
Grants and funding
LinkOut - more resources
Full Text Sources
Other Literature Sources
Medical
Miscellaneous
