

Hierarchical folding and reorganization of chromosomes are linked to transcriptional changes in cellular differentiation
- PMID: 26700852
- PMCID: PMC4704492
- DOI: 10.15252/msb.20156492
Hierarchical folding and reorganization of chromosomes are linked to transcriptional changes in cellular differentiation
Abstract
Mammalian chromosomes fold into arrays of megabase-sized topologically associating domains (TADs), which are arranged into compartments spanning multiple megabases of genomic DNA. TADs have internal substructures that are often cell type specific, but their higher-order organization remains elusive. Here, we investigate TAD higher-order interactions with Hi-C through neuronal differentiation and show that they form a hierarchy of domains-within-domains (metaTADs) extending across genomic scales up to the range of entire chromosomes. We find that TAD interactions are well captured by tree-like, hierarchical structures irrespective of cell type. metaTAD tree structures correlate with genetic, epigenomic and expression features, and structural tree rearrangements during differentiation are linked to transcriptional state changes. Using polymer modelling, we demonstrate that hierarchical folding promotes efficient chromatin packaging without the loss of contact specificity, highlighting a role far beyond the simple need for packing efficiency.
Keywords: chromatin contacts; chromosome architecture; epigenetics; gene expression; polymer modelling.
© 2015 The Authors. Published under the terms of the CC BY 4.0 license.
Figures
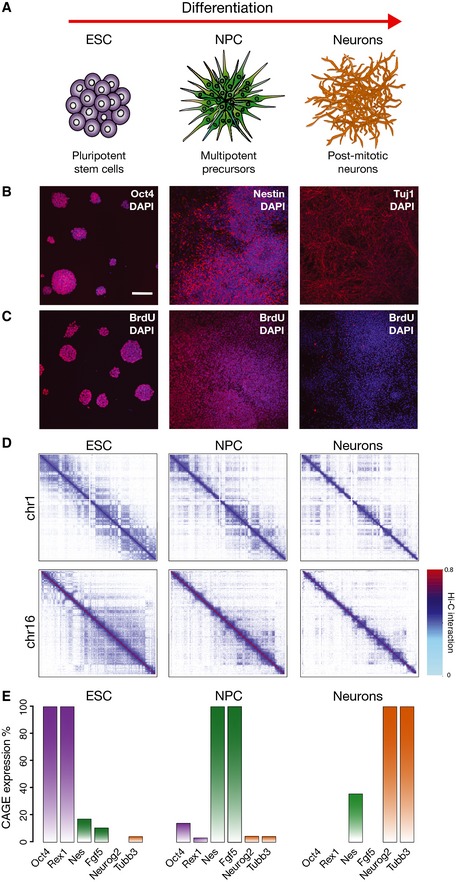
Scheme of the murine differentiation system of our study, from ESC to NPC and post‐mitotic neurons.
Cells express stage‐specific markers as detected by immunofluorescence: ESC express Oct4, NPC the neuronal precursor marker nestin and Neurons Tubb3 (Tuj1 antibody). Scale bar, 100 μm.
ESC and NPC are actively cycling, whereas Neurons are negative for BrDNA after 24‐h BrdU incorporation. Nuclei were counterstained with DAPI.
Examples of interaction patterns in Hi‐C matrices across the whole chromosomes show extensive higher‐order dynamic contacts, which change during terminal neuronal differentiation. Hi‐C interaction data are plotted in log scale.
Matched CAGE data sets were produced from total RNA extracted from ESC, NPC and Neurons. The expression levels confirm specific expression of stage‐specific markers. CAGE expression reported as a percentage relative to highest expression.
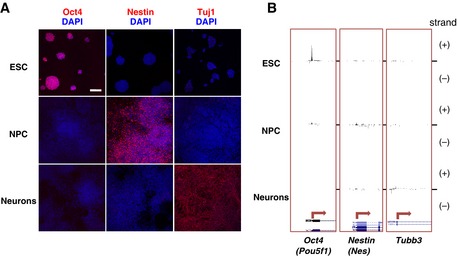
Cell populations were tested by immunofluorescence staining for their purity using stage‐specific markers (pseudocoloured red), which showed efficient progression of
ESC through the differentiation steps. Oct4 expression inESC is lost upon differentiation, nestin is specifically expressed inNPC , and Tubb3 (detected using Tuj1 antibodies) is strongly expressed in Neurons. Nuclei were counterstained withDAPI (pseudocoloured blue). Scale bar represents 100 μm.Total
RNA was extracted fromESC ,NPC and Neurons, and directionalCAGE data sets were produced in order to measureRNA transcription and define transcription start sites in each time point. Strand‐specificCAGE reads are represented (+ and – strands). The promoter regions of the stage‐specific markers are reported.CAGE signals for Oct4 (Pou5f1), nestin (Nes) and Tubb3 genes peak inESC ,NPC and Neurons, respectively.
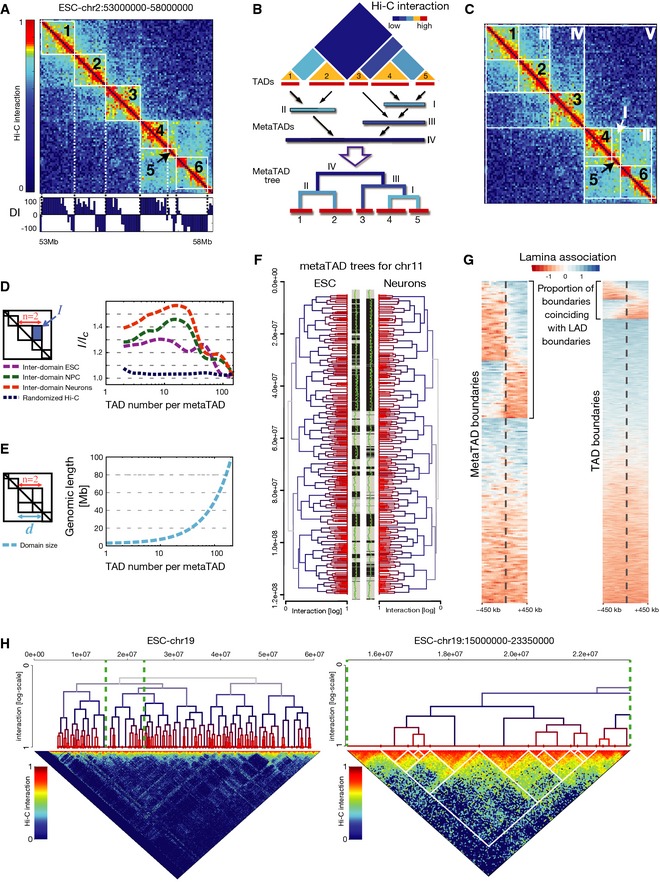
ESC Hi‐C map of chromosome 2, 53–58 Mb. The directionality index (DI, bottom) was used to identify TADs, numbered 1–6.
metaTAD identification by single‐linkage clustering.
Examples of TADs (1–6) and metaTADs (I–V) in the same region shown in (A).
metaTADs are domains with enriched Hi‐C contacts. The ratio of average interaction, I, between pairs of TADs or metaTADs, and background value, I C, was calculated for ESC, NPC and Neurons, as a function of the total number of TADs (n) included in the metaTAD. I/I C remains 20% above control levels in randomized Hi‐C matrices up to scales of the order of n = 80 TADs.
metaTADs size, d, is represented as a function of the number of TADs that they contain, n, showing that eighty TADs correspond to an average genomic length of around 40 Mb.
The metaTAD tree organization in ESC versus Neurons largely coincides with stretches of compartment A (grey) or B (black). A/B compartments are represented in the two central bars and were defined based on an individual principle component (green line) derived from Hi‐C data. The yellow line indicates a value of 0.
Boundaries of metaTADs larger than 10 Mb are more enriched for transitions between lamina‐associated (blue) and lamina‐detached (red) regions than TAD boundaries. Heatmaps display the 900‐kb flanking domain boundaries (dashed lines) for metaTADs (left heatmap) and TADs (right heatmap) for all boundary regions (heatmap rows). Transitions in lamina association are visible as abrupt changes in heatmap colours at boundaries (see Appendix Supplementary Methods). Both metaTAD and TAD boundaries are significantly more frequently observed to coincide with transitions than expected (P < 1 × 10⁻⁴; see Appendix Supplementary Methods).
The metaTAD tree of chromosome 19 in ESC (left: full; right: zoomed region). Interactions between metaTADs are not homogeneous, but instead occur through specific contacts involving specific TADs. Hi‐C interaction data are plotted in log scale.

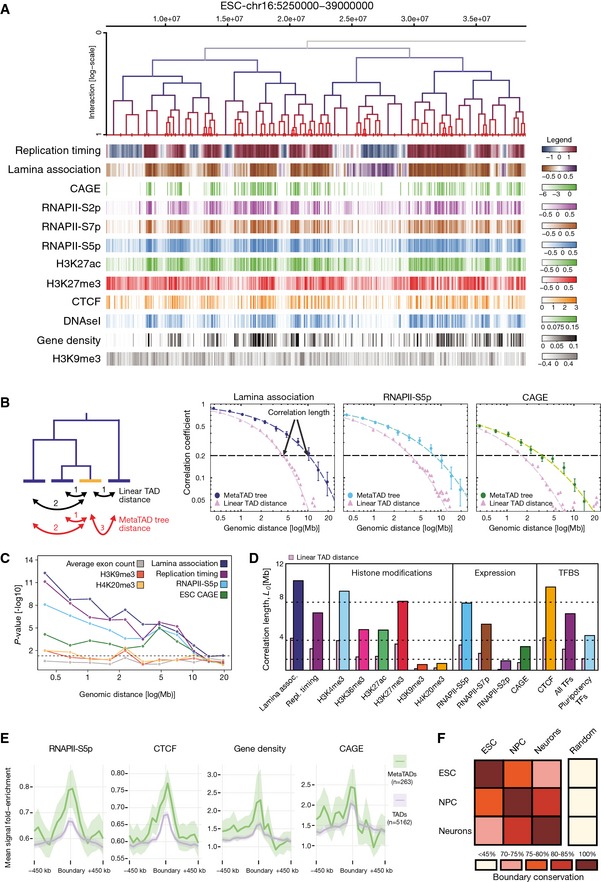
Comparison between the distribution of epigenomic, genomic and gene expression features with the metaTAD tree structure.
Left side: the diagram represents the difference between linear and metaTAD tree distance (number of edges along the tree minus one) for a given TAD (yellow) relative to other TADs (blue) in the same tree. Right side: correlations over the tree extend up to genomic scales of tens of Mb (filled circles) and are significantly stronger than those observed in linear genomic sequence (filled triangles). The horizontal dashed line indicates a 20% correlation coefficient.
Statistically significant differences are observed in the correlations measured across the metaTAD tree and across random neighbour trees constructed from the same linear array of TADs (horizontal line P‐value = 0.05). Heterochromatin marks H4K20me3 and H3K9me3 levels do not correlate with the tree structure above what is expected from linear genomic distance.
CAGE data, different epigenomic features and pluripotency transcription factors binding sites (TFBS) have different average correlation lengths.
Genome‐wide profiles averaged over all TAD or metaTAD boundaries of selected epigenomic features and gene densities (ribbons show 95% confidence intervals of the mean; metaTADs considered had length 10–40 Mb). Higher feature enrichments are observed at metaTAD boundaries (green) than TAD boundaries (violet).
Approximately two‐thirds of TAD boundaries are conserved from ESC to Neurons.
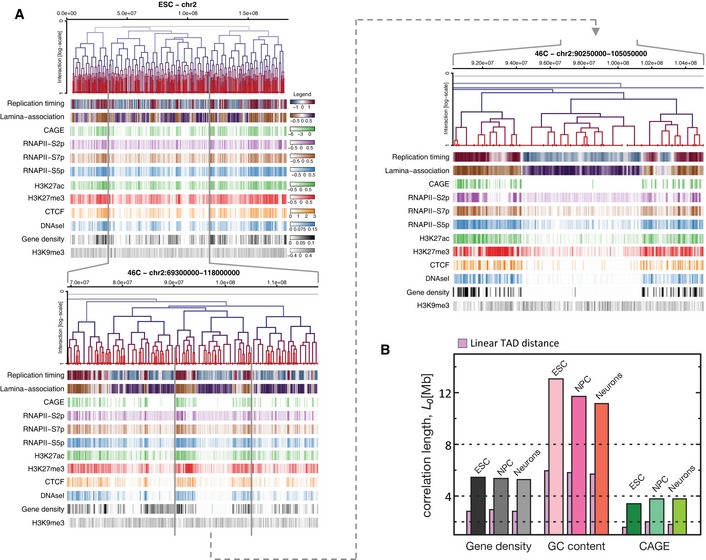
Three nested levels of
TAD hierarchies of chromosome 2 are displayed above multiple genomic, epigenomic,CAGE data and transcription factor (TF ) features measured inESC . Feature intensities are evaluated in 50‐kb windows and have been clipped at 5 and 95% quantiles to facilitate visualization. The colour keys reflecting the full range of feature scores over all chromosomes are depicted on the right of the topmost panel.Correlation lengths measured across meta
TAD trees in each time point (ESC ,NPC and Neurons) were calculated for gene density,GC content andCAGE tags. Despite metaTAD restructuring (see Fig 2F), strong correlations are detected at each time point.
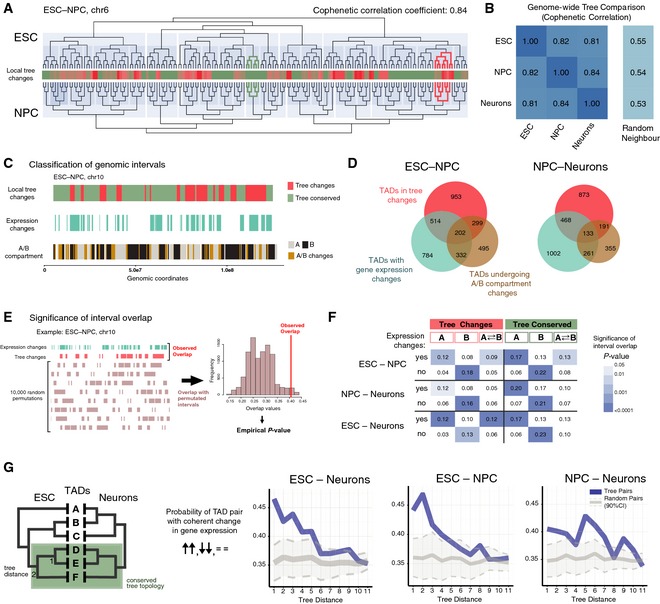
Comparison between the metaTAD trees of chr6 in ESC and NPC. The extent of local tree topology changes is represented in the central heatmap. Examples of regions with conserved (dark green) and changing (red) local tree topologies are highlighted on the tree diagrams.
Cophenetic correlation coefficients between metaTAD trees at different time points show significant tree structure conservation (˜80%) when compared to random neighbour trees.
Graphical representation of the distribution of tree changes, gene expression changes and A/B compartment membership changes across chr10 TADs for the ESC–NPC transition. Changes were computed at the level of conserved TADs.
Venn diagrams with the number of TADs that undergo changes in metaTAD tree topology, gene expression and A/B compartment in the ESC–NPC and NPC–Neuron differentiation transitions.
Scheme of the approach used to detect overlaps between genomic regions that undergo gene expression changes and tree changes or compartment A/B changes. The Jaccard index was used as a measure of overlap, and its significance was judged by comparing with 10,000 circularly permutated regions.
Overlap values (Jaccard index) between regions of gene expression changes and tree conservation/change, in compartment A, B or A‐B transitions. The significance of overlaps is represented using a blue‐coloured matrix; white cells represent non‐significant overlaps (P‐value > 0.05).
TAD pairs are more likely to display coherent changes in gene expression during differentiation (both TADs are upregulated, downregulated or unchanged) in regions where tree topology is conserved than random pairs. In metaTAD trees of TADs with conserved boundaries, this is significant up to a tree distance of 5 (corresponding to ˜2–6 Mb in genomic distance).

Cophenetic correlation coefficients comparing meta
TAD trees per chromosome show different levels of tree restructuring in each differentiation time point transition. Dashed horizontal lines represent the average value for all autosomal chromosomes.Percentage of the total number of (left to right):
TAD s with a local tree change value above a threshold of 1 (threshold values of 0.5, 2 or 3 for local tree change gave similar results; P‐values refer to Wilcoxon rank‐sum test performed with all tree change values in each time point transition); genomic extension of regions characterized as tree change (z‐score > 0); and genomic extension of regions characterized as A/B compartment change (> 25% coverage change) for all time point transitions.Scatter plots illustrating
TAD classification according to the gene expression change double criteria used in Fig 4: fold change (> 1.5×) andFPKM difference (>IQR /4). Other thresholds considered are also marked.TAD s in red are significantly changing, whileTAD s in green do not display significant changes in expression.
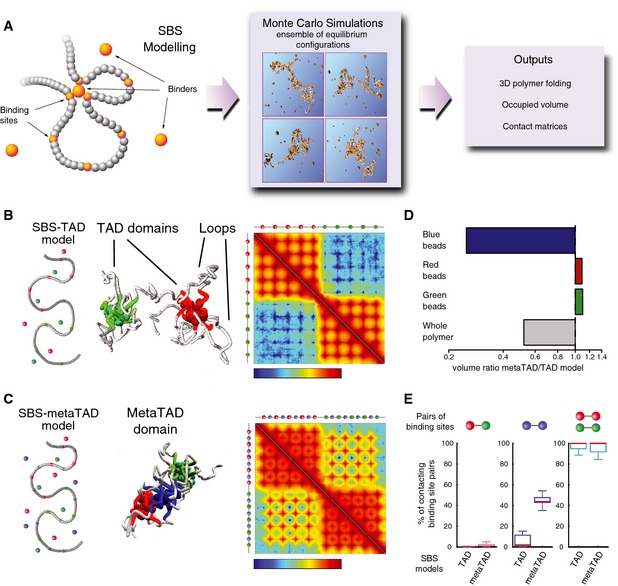
Schematic representation of the strings and binders switch (SBS) model. Binder particles form multiple bonds with binding sites on the polymer, allowing loop formation between distant regions. By Monte Carlo simulations, we produce equilibrium configurations to measure potentially relevant biological quantities, such as contact matrices, polymer compaction degree and other details of folding architecture.
The SBS model can explain mechanisms of hierarchical folding of TADs into metaTADs. Representation of an SBS‐TAD model with two clusters of binding sites (red and green) and their respective binders, along with its emerging contact matrix (logarithm of contact frequency). The 3D conformation example shows the formation of loops and two separate domains.
Addition of a third type of interspersed binding sites (blue) and their binders promotes the formation of a metaTAD, as seen in the contact matrix (logarithm of contact frequency).
The volume of the polymer model represented in (C) (metaTAD model) is half the size of the model in (B) (TAD only model), albeit their length is the same. While the organization of red and green TADs remains unaltered, the formation of a third domain (blue) encompassing the blue binding sites results in increased proximity between the green and red TADs.
Despite increased compaction observed in the metaTAD model, the probability that a single red binding site contacts a green binding site in the same polymer remains vanishingly small. The contacts mediated through the blue beads result in a significant increase in the extent of polymer packing while keeping the red and green domains separated.

To assess the extent long‐range interactions between
TAD s at the single‐cell level, we designed three oligo libraries tagged withATTO ‐550,ATTO ‐488 andATTO ‐594, which cover genomic regions a (red), b (green) and c (blue), separated by 1.5 (a‐b) or 2 (b‐c) Mb, and which belong to differentTAD s (red line). Hi‐C data show stronger long‐range interaction frequency between a and b than b and c.Probes a, b and c were simultaneously hybridized on ultrathin (~180‐nm‐thick) cryosections from
ESC (Branco & Pombo, 2006), before counterstaining withDAPI (inset on the left) and imaged on a confocal microscope. Inset on the right shows a magnified region of the same image. Dashed line indicates the nuclear outline. Region b often co‐localizes with region a, but not region c.Distances between regions a and b, or b and c, were measured using an automated macro from the centroids of fluorescent signals corresponding to a, b and c. Data were collected from two independent cryo
FISH experiments (red and green dots); number of distances is indicated above the graph. The average distance between the centre of the fluorescent signals corresponding to probes a and b is 350 ± 242 nm, in contrast with probes b and c, which are on average separated by 587 ± 375 nm (Wilcoxon test, P‐value 0.00168). The ratio of the genomic separation for the two pairs of probes (b‐c/a‐b) is ~1.3, compared with their physical distance ratio of 1.7.
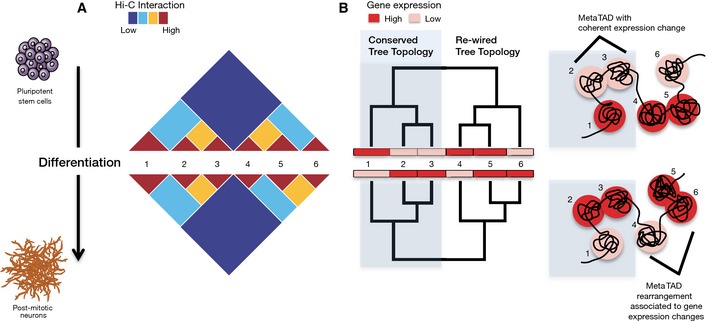
Changes in chromatin contacts and gene expression were followed during differentiation of ESC into NPC and Neurons using Hi‐C and CAGE. A hierarchy of higher‐order contacts between TADs (numbered 1–6) was detected within Hi‐C contact matrices, which is partially altered during differentiation. The patterns of TAD–TAD contacts reflect similarity in expression and epigenomic features.
The hierarchy of TAD–TAD contacts can be represented as a metaTAD tree which facilitates an integrated, multi‐scale study of the relationship between chromatin contacts and expression and epigenomic features. Rearrangements in metaTAD tree topologies often occur at genomic regions that undergo gene expression changes, while conserved topologies often underlie TADs with coherent changes in gene expression.
References
-
- Bickmore W, van Steensel B (2013) Genome architecture: domain organization of interphase chromosomes. Cell 152: 1270–1284 - PubMed
-
- Brookes E, de Santiago I, Hebenstreit D, Morris KJ, Carroll T, Xie SQ, Stock JK, Heidemann M, Eick D, Nozaki N, Kimura H, Ragoussis J, Teichmann SA, Pombo A (2012) Polycomb associates genome‐wide with a specific RNA polymerase II variant, and regulates metabolic genes in ESCs. Cell Stem Cell 10: 157–170 - PMC - PubMed
MeSH terms
Substances
Grants and funding
LinkOut - more resources
Full Text Sources
Other Literature Sources
Molecular Biology Databases
