. 2015 Dec 23;11(12):e1005699.
doi: 10.1371/journal.pgen.1005699. eCollection 2015 Dec.

Origin-Dependent Inverted-Repeat Amplification: Tests of a Model for Inverted DNA Amplification

Affiliations

Origin-Dependent Inverted-Repeat Amplification: Tests of a Model for Inverted DNA Amplification

Bonita J Brewer et al. PLoS Genet. .

Abstract

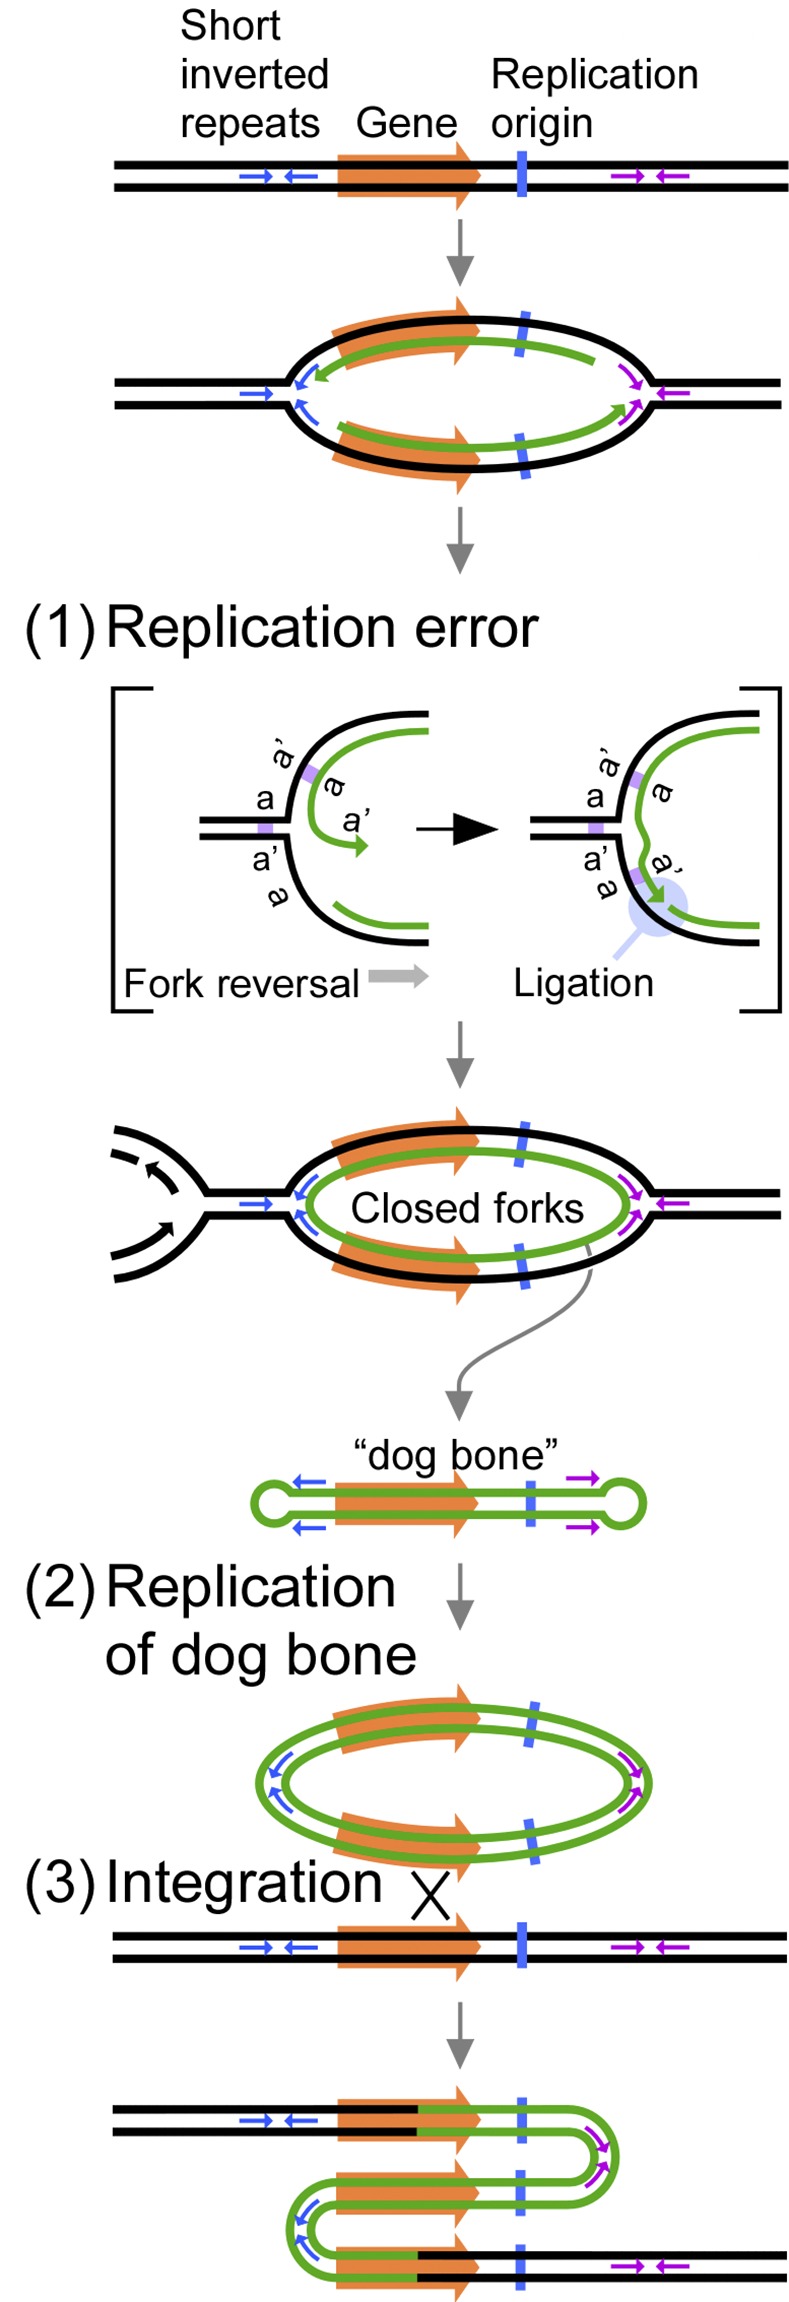
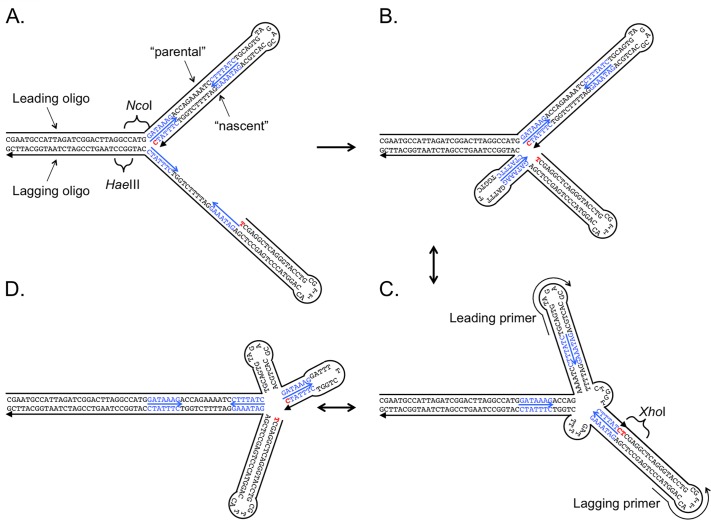
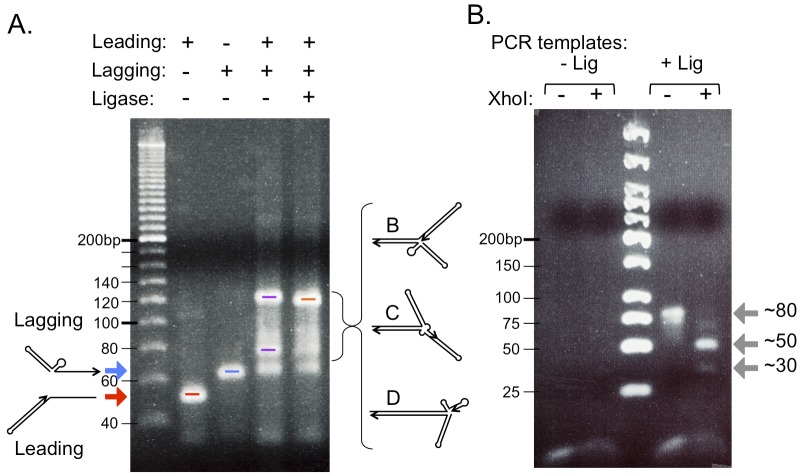
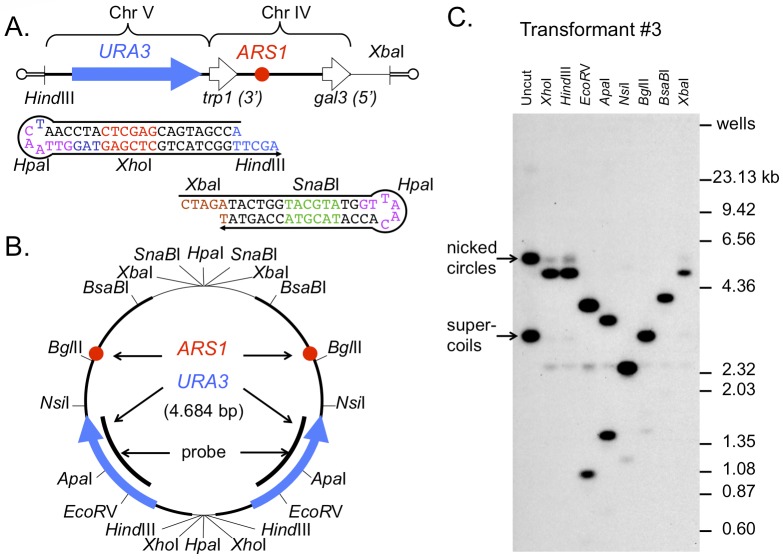
DNA replication errors are a major driver of evolution--from single nucleotide polymorphisms to large-scale copy number variations (CNVs). Here we test a specific replication-based model to explain the generation of interstitial, inverted triplications. While no genetic information is lost, the novel inversion junctions and increased copy number of the included sequences create the potential for adaptive phenotypes. The model--Origin-Dependent Inverted-Repeat Amplification (ODIRA)-proposes that a replication error at pre-existing short, interrupted, inverted repeats in genomic sequences generates an extrachromosomal, inverted dimeric, autonomously replicating intermediate; subsequent genomic integration of the dimer yields this class of CNV without loss of distal chromosomal sequences. We used a combination of in vitro and in vivo approaches to test the feasibility of the proposed replication error and its downstream consequences on chromosome structure in the yeast Saccharomyces cerevisiae. We show that the proposed replication error-the ligation of leading and lagging nascent strands to create "closed" forks-can occur in vitro at short, interrupted inverted repeats. The removal of molecules with two closed forks results in a hairpin-capped linear duplex that we show replicates in vivo to create an inverted, dimeric plasmid that subsequently integrates into the genome by homologous recombination, creating an inverted triplication. While other models have been proposed to explain inverted triplications and their derivatives, our model can also explain the generation of human, de novo, inverted amplicons that have a 2:1 mixture of sequences from both homologues of a single parent--a feature readily explained by a plasmid intermediate that arises from one homologue and integrates into the other homologue prior to meiosis. Our tests of key features of ODIRA lend support to this mechanism and suggest further avenues of enquiry to unravel the origins of interstitial, inverted CNVs pivotal in human health and evolution.


Conflict of interest statement

The authors have declared that no competing interests exist.

Figures

Fig 1
Fig 1. Key steps in the origin-dependent inverted-repeat amplification model for the generation of interstitial, inverted triplications.
(1) Replication forks initiated at an origin of replication (vertical blue line) undergo fork reversal at small, interrupted inverted repeats (small blue/purple arrows; a and a’) leading to a replication error that covalently links nascent leading and lagging strands. These self-complementary DNA loops are expelled by adjacent replication forks to generate free linear DNA duplexes with closed loops (“dog bone” molecules) that correspond to the interrupted, inverted repeats and their intervening sequences. (2) In the next cell cycle, replication from the origin on the linear fragment generates a circular plasmid with the two copies of the amplified region in inverted orientation with the interrupted, inverted repeats at the head-to-head and tail-to-tail junctions. (3) Integration of the plasmid into the chromosomal locus generates the triplication with the central repeat in reverse orientation. The drawings are adapted from Fig 2 in [2].
Fig 2
Fig 2. An in vitro construct to test for fork reversal and cross-strand ligation.
An artificial replication fork was generated using commercially synthesized oligonucleotides (sizes of 100 and 99 nucleotides, with a 5’-phosphate on the 99 nucleotide lagging oligonucleotide). (A) To facilitate assembly of the fork from its component strands, the “parental” and “nascent” strands of the leading arm of the duplex, and likewise, the two strands of the lagging arm of the replication fork were covalently joined by a short linker. Complementary sequences in the two, 30 base, single stranded tails allow the fork to assemble in vitro. Features engineered into the two oligos include a 7 bp inverted repeat (blue sequences highlighted with small arrows) separated by 11 nucleotides of non-complementary sequence, and various restriction sites to facilitate evaluation of the fork and its products. (B) The single stranded stretch on the lagging strand exposes two complementary copies of the inverted repeat (in blue with arrow) which are expected to fold into a stem-loop structure to achieve the lowest free energy state for the forked molecule. (C and D) Breathing of the duplexes at the fork facilitates fork reversal and generates alternative conformations by branch migration—all with identical numbers of paired bases. The structures in B and D reflect the two extreme branch-migrated forms, with C representing only one of 25 possible intermediates. The two nucleotides in red are brought into proximity in the branch-migrated forms, providing a substrate for ligation by DNA ligase. Completion of the ligation step creates an XhoI restriction site. PCR primers (shown in C) target the two linkers.
Fig 3
Fig 3. Ligation of leading and lagging “nascent” strands at a replication fork in vitro.
(A) Each oligonucleotide was separately analyzed by electrophoresis in a 3.75% agarose gel after boiling and chilling on ice to allow the hairpins on both oligos to fold (leading strand marked with red arrow, lagging strand marked with blue arrow). The differences in migration of these nearly identically sized oligonucleotides are likely due to their different three-dimensional structures. The two oligonucleotides were mixed (in nearly equal molar amounts), boiled, chilled on ice and then returned to room temperature to allow the two complementary, single stranded tails to anneal. The image of the ethidium bromide stained gel reveals that some unreacted lagging strands remain (blue bar), but the majority of the oligonucleotides have formed higher molecular weight molecules (extremes highlighted with purple bars; intermediates from Fig 2 are labeled B, C, and D). The differences in migration of these molecules with identical mass are likely due to different branching patterns. Addition of DNA Ligase + ATP (last lane on the gel) results in a slightly faster migration of the slowest migrating form (orange bar) relative to its counterpart in the no-ligase lane. (B) Reserved samples from the last two lanes in (A) were used as templates in PCR reactions to detect a covalent linkage between the two oligonucleotides across the fork. PCR primers were designed such that their 3’ends resided in the single stranded linkers at the distal arms of the leading and lagging strands (see Fig 2C). The image of the ethidium bromide stained 3.75% agarose gel reveals a PCR product of 78 bp that can be cleaved by XhoI into 47 and 31 bp fragments (gray arrows).
Fig 4
Fig 4. Transformation of yeast with an artificial dog bone results in inverted dimeric plasmids.
(A) A HindIII-XbaI restriction fragment from plasmid pUA-DirB contains the URA3 gene from chromosome V (blue arrow) and the origin ARS1 from chromosome IV (red circle). Oligonucleotide hairpins were designed with HindIII (blue) and XbaI (brown) overhangs, 5’-phosphates to ensure their ligation to the ends of the URA3-ARS1 fragment, and additional restriction sites in the duplex and loop portions to facilitate analysis of the DNA after transformation. (B) Map of the anticipated inverted dimeric plasmid after transformation and replication in yeast. Cleavage sites are indicated in bp. (C) Eight transformants were chosen at random; all eight had plasmids and five (transformants 1, 3, 5, 7, and 8) had restriction maps that were consistent with the map expected for a circular inverted dimer. The Southern blot using a URA3 probe for transformant #3 is shown.
Fig 5
Fig 5. Long-term growth in selective medium selects for integration of plasmid sequences.
After 80 to 90 generations of selective growth in–uracil medium, single clones were isolated from the cultures of transformants 1, 3, 5, 7, and 8. DNA from the first day (F), the last day (L) and the clone (C) was isolated by smash-and-grab and by an agarose plug method and analyzed by conventional (A) and CHEF (B) gel electrophoresis. The fates of the transforming URA3-ARS1 dog bones were determined by Southern blots using URA3 as a probe (ethidium bromide images on left, Southern hybridization on right). The parental strain BY4741 (P) has a complete deletion of URA3 on chromosome V. (A) Plasmids were identified in all samples (nicked circular (NC) and supercoiled (SC) molecules of two different sized plasmids), with the exception of the clone from transformant #7 (red box). In this sample, hybridization to chromosomal fragments suggested that the plasmid had integrated (marked with *). (B) CHEF analysis confirms the presence of URA3 on chromosome IV. Increased hybridization of URA3 sequences (over the background signal found in the parental strain (P)) on the last days of selective growth suggests that integration had occurred in other cultures, although the single clones did not reflect this event. (Note that small plasmids migrate very slowly under CHEF gel electrophoresis conditions and also are trapped in the wells. These molecules are indicated by brackets on the right side of the gel.) Both DNA sampling techniques also revealed that free plasmids were experiencing other changes as a consequence of long-term selective growth.
Fig 6
Fig 6. PCR amplification across the URA3-GAL3 junction confirms plasmid integration adjacent to ARS1 on chromosome IV.
(A) The map illustrates the region of homology (shaded in grey) shared between chromosome IV (top; genomic region from SOK1 to SNQ2—coordinates 460 to 467 kb—taken as a screen shot from the Saccharomyces genome database; www.yeastgenome.org) and the plasmid sequences (bottom). The position of PCR primers (red arrows) predicts a 1.2 kb fragment for integrants that have recombined by homology in the TRP1-GAL3 region. (B) Ethidium bromide stained gel of PCR fragments. The presence of 1.2 kb PCR fragments in each of the last day samples (L) and clone (C) from the last day of transformant #7 confirms the integration site of the plasmid sequences.
Fig 7
Fig 7. The inverted dimeric plasmid integration preserves both palindromic junctions, creating an inverted triplication of ARS1.
(A) The map illustrates the expected structure after homologous integration of the dimeric plasmid between TRP1 and GAL3 on chromosome IV. The positions and sizes of BglII fragments, as well as probe sequences are illustrated. (B) A snap-back assay detects palindromic sequences by virtue of their ability to recreate duplex fragments of half the original size after boiling and quick cooling on ice. Additionally, these sequences are resistant to the ssDNA nuclease S1. (C and D) Southern blots of snap-back assays on the two palindromic junctions of the integrated plasmid in the last day clone from transformant #7. Lane 1 = native duplex BglII fragments; lane 2 = denatured/renatured palindromic duplexes; lane 3 = S1 nuclease resistant duplex DNA. The probe in (C) detects the URA3 palindromic fragment; the probe in (D) detects the ARS1 palindromic fragment as well as the non-inverted copy of ARS1 adjacent to GAL3. Note that the larger ssDNA fragment (in lane 2) is degraded by S1 (lane 3).
Fig 8
Fig 8. Secondary rearrangement at a palindromic junction in a SUL1 amplicon.
(A) ArrayCGH of yeast strain 10206-c1476. Only the last 65 kb of chromosome II are shown. (Due to the lack of unique probes near the right telomere, it is not possible to determine from aCGH the precise right junction of the amplicon.) (B) Sequences of the ancestral chromosome and the rearranged palindromic junction from the evolved clone. Sequences centromere-proximal of the inversion junction are in lower case. The short inverted repeats proposed to be the site of fork closure are indicated in red font (red arrow); sequences believed to be the sites of intramolecular, non-allelic, homologous recombination to generate the deletion of one arm of the palindrome are underlined (black arrow). Colored highlights are included to illustrate the orientation and junctions created after formation of the amplicon and the deletion of one of the palindromic arms. (C) Map illustrating the structure of the original inferred inverted triplication, highlighting the short inverted repeats (red arrows) and the sites of homology (black arrows). Colored blocks are the same as in (B). The direct orientation of the two distal black arrows creates an opportunity for intramolecular, non-allelic, homologous recombination to remove the intervening sequences. (D) Confirmation of the structure of the centromere-proximal amplicon junction by indirect end-labeling. DNA from 10206-c1476 was digested with EcoNI, distributed to 9 tubes and digested with one of the indicated enzymes. A probe (black square) adjacent to the EcoNI site detects fragments that extend from the EcoNI site toward the centromere. The map in (C) illustrates the locations of sites in the ancestral genome; these fragment sizes are detected for the most centromere proximal copy of the SUL1 locus and for fragments completely contained within the two arms of the inverted amplicon. The second bands seen for ApaI, AflII, and KpnI are consistent with sizes expected for fragments that span the deletion. (E) Snap-back assays on EcoNI and ApaLI digested genomic DNA from 10206-c1476. Both ancestral and amplicon specific fragments are detected in native DNA. Denaturation and quick cooling produces a smear of ssDNA fragments along with duplex hairpins of approximately 12 kb for the EcoNI digest and 23 kb for the ApaLI digest. There is no change in size of the ApalI fragment after S1 nuclease digestion, but only a 7.8 kb duplex portion of the EcoNI hairpin remains after S1 digestion. The change in size is consistent with the EcoNI hairpin having lost a large single-stranded loop during S1 digestion.
Fig 9
Fig 9. SUL1 amplicon structures generated in the presence and absence of ARS228.
(A) Top: Seven sulfate limited chemostats were grown for ~200 generations with a strain deleted for ARS228. A single random clone was isolated from each chemostat and characterized by ApaLI snap-back assays (S5 Fig) and aCGH (the amplification junctions are marked by brackets above the dotted line, aligned with the chromosomal map of the right arm of chromosome II from coordinates 750 kb to telomere (813 kb)). Among the single clones (S10201 to 7) we identified four clones with interstitial inverted amplification events (blue brackets) and three clones which were inconsistent with inverted amplification structures (black brackets; 10202-c1474 also suffered a telomere deletion). Additional unique clones (designated as cA-cE, below the dotted line) were analyzed from each chemostat culture. Among the seven additional clones, one clone was a complex isochromosome with deletion of one copy of CEN2 (green clone). The junction sequence (green square) was not pursued further. (A) Bottom: Wild type cultures (ARS228) selected from the sulfate-limited chemostat cultures (~200 generations) were pooled from published work from our labs and their amplification junctions are shown below the chromosome map (red brackets). Molecular characterizations of chromosome II structures in these clones are consistent with interstitial inverted amplification. Pop 2–7 clones are from [4]; B9, 10, 11, and 13 are from [18]; and s1c2 and s2c1 are from [16]. The vertical orange bars mark the positions of known ARSs. (B) Sizes of amplified regions from the ARS228 and ars228Δ strains generate medians of 16.5 and 28.9 kb, respectively, with a Wilcoxon Mann Whitney significance p-value of 0.027.

Similar articles

Cited by

References

    1. Araya CL, Payen C, Dunham MJ, Fields S. Whole-genome sequencing of a laboratory-evolved yeast strain. BMC Genomics. 2010;11:88 Epub 2010/02/05. 10.1186/1471-2164-11-88 - DOI - PMC - PubMed
    1. Brewer BJ, Payen C, Raghuraman MK, Dunham MJ. Origin-dependent inverted-repeat amplification: a replication-based model for generating palindromic amplicons. PLoS Genet. 2011;7(3):e1002016 Epub 2011/03/26. 10.1371/journal.pgen.1002016 - DOI - PMC - PubMed
    1. Knijnenburg J, van Bever Y, Hulsman LO, van Kempen CA, Bolman GM, van Loon RL, et al. A 600 kb triplication in the cat eye syndrome critical region causes anorectal, renal and preauricular anomalies in a three-generation family. Eur J Hum Genet. 2012;20(9):986–9. 10.1038/ejhg.2012.43 - DOI - PMC - PubMed
    1. Payen C, Di Rienzi SC, Ong GT, Pogachar JL, Sanchez JC, Sunshine AB, et al. The dynamics of diverse segmental amplifications in populations of Saccharomyces cerevisiae adapting to strong selection. G3 (Bethesda). 2014;4(3):399–409. - PMC - PubMed
    1. McClintock B. The Stability of Broken Ends of Chromosomes in Zea Mays. Genetics. 1941;26(2):234–82. Epub 1941/03/01. - PMC - PubMed

Publication types