

Gray matter responsiveness to adaptive working memory training: a surface-based morphometry study
- PMID: 26701168
- PMCID: PMC4919225
- DOI: 10.1007/s00429-015-1168-7
Gray matter responsiveness to adaptive working memory training: a surface-based morphometry study
Abstract
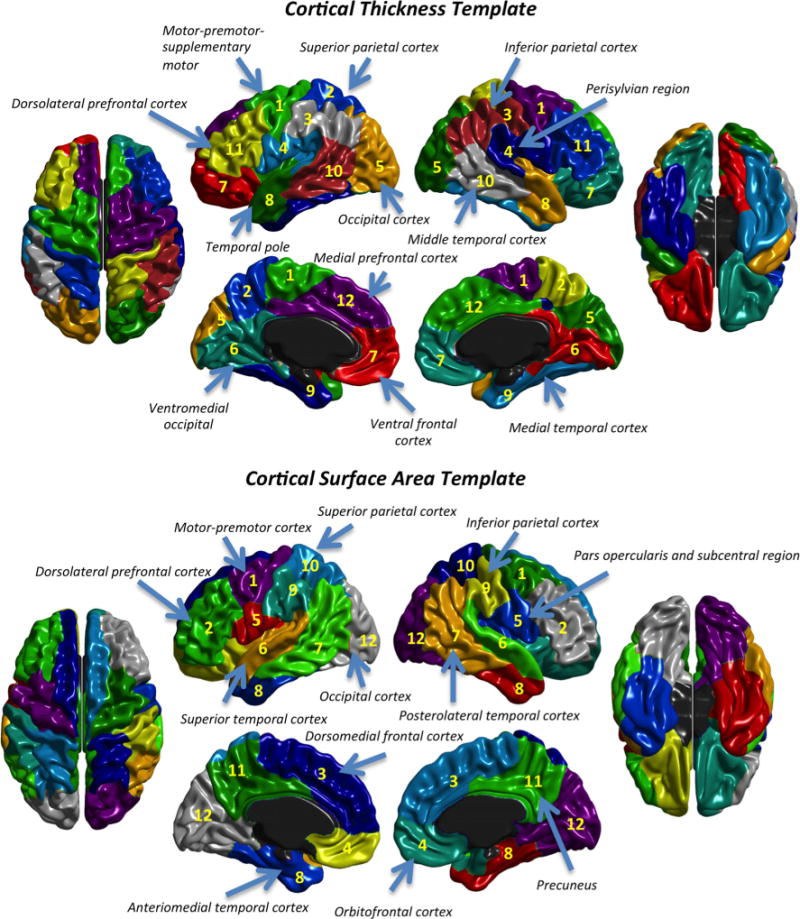
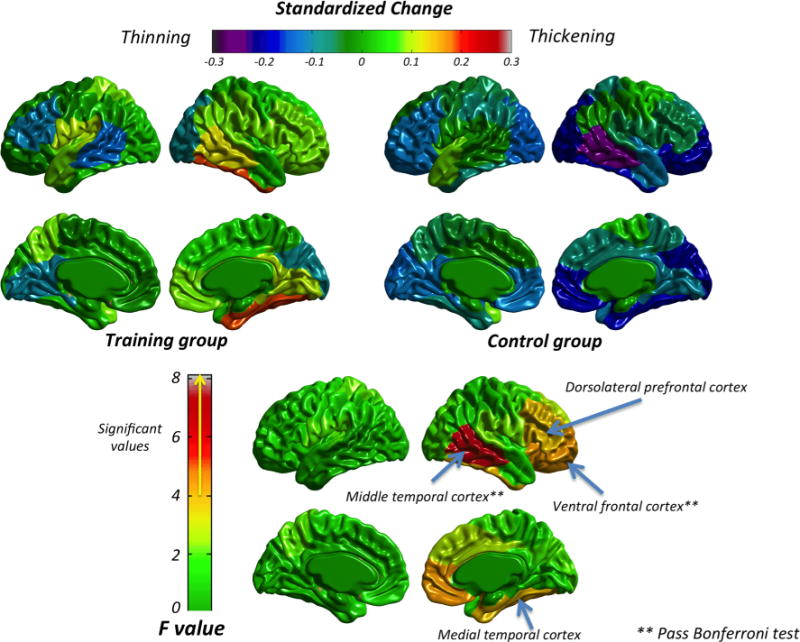
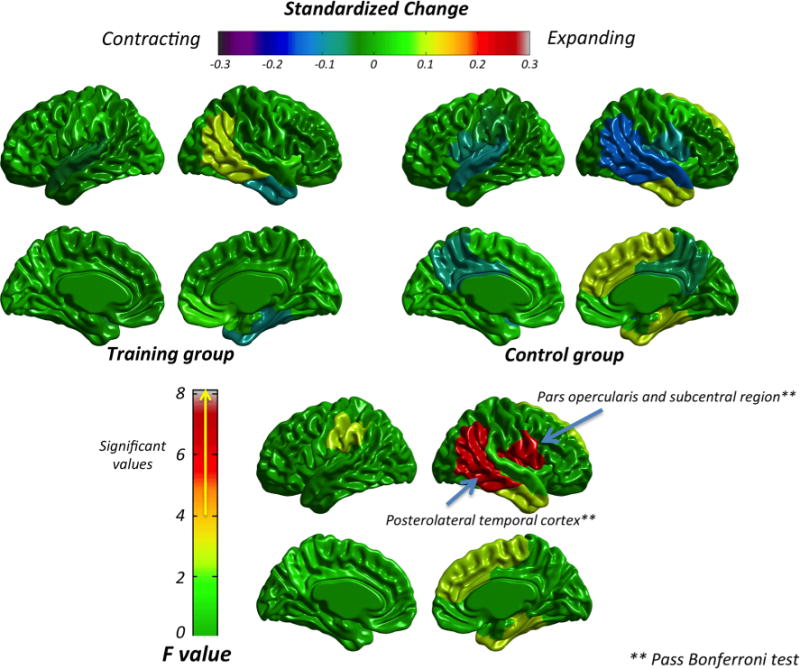
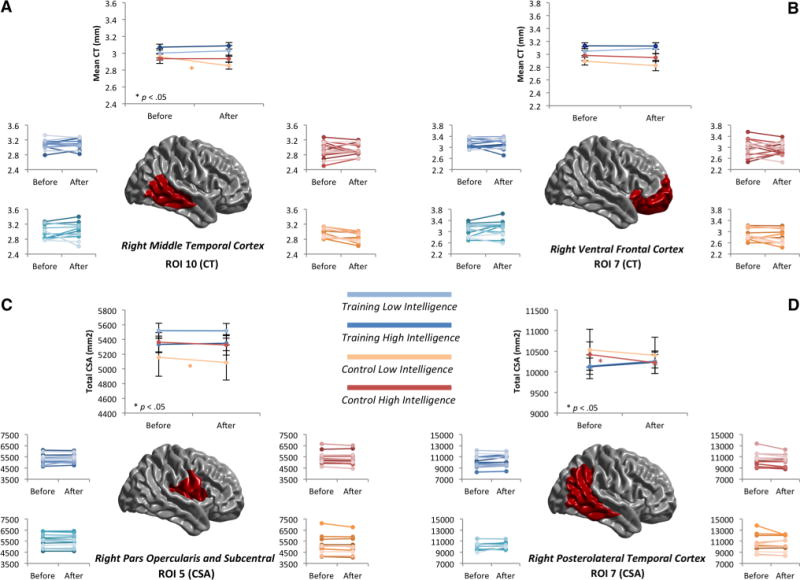
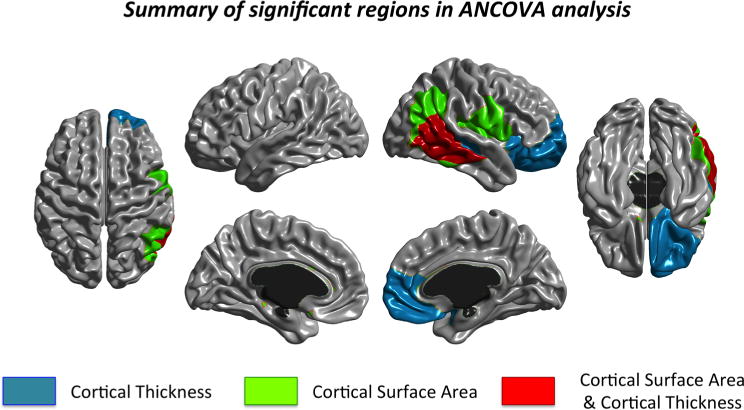
Here we analyze gray matter indices before and after completing a challenging adaptive cognitive training program based on the n-back task. The considered gray matter indices were cortical thickness (CT) and cortical surface area (CSA). Twenty-eight young women (age range 17-22 years) completed 24 training sessions over the course of 3 months (12 weeks, 24 sessions), showing expected performance improvements. CT and CSA values for the training group were compared with those of a matched control group. Statistical analyses were computed using a ROI framework defined by brain areas distinguished by their genetic underpinning. The interaction between group and time was analyzed. Middle temporal, ventral frontal, inferior parietal cortices, and pars opercularis were the regions where the training group showed conservation of gray matter with respect to the control group. These regions support working memory, resistance to interference, and inhibition. Furthermore, an interaction with baseline intelligence differences showed that the expected decreasing trend at the biological level for individuals showing relatively low intelligence levels at baseline was attenuated by the completed training.
Keywords: Brain plasticity; Cognitive training; Cortical surface area; Cortical thickness; Surface-based morphometry.
Figures
References
-
- Ad-Dab’bagh Y, Lyttelton O, Muehlboeck JS, Lepage C, Einarson D, Mok K, Ivanov O, Vincent RD, Lerch J, Fombonne E, Evans AC. In: Corbetta M, editor. The CIVET image processing environment: A fully automated comprehensive pipeline for anatomical neuroimaging research; Proceedings of the 12th Annual Meeting of the Organization for Human Brain Mapping NeuroImage; Florence, Italy. 2006.
-
- Aron AR, Robbins TW, Poldrack RA. Inhibition and the right inferior frontal cortex. Trends in cognitive sciences. 2004;8:170–177. - PubMed
-
- Au J, Sheehan E, Tsai N, Duncan GJ, Buschkuehl M, Jaeggi SM. Improving fluid intelligence with training on working memory: a meta-analysis. Psychonomic bulletin and review. 2014:1–12. - PubMed
-
- Blanton RE, Levitt JG, Thompson PM, Narr KL, Capetillo-Cunliffe L, Nobel A, Toga AW. Mapping cortical asymmetry and complexity patterns in normal children. Psychiatry Res Neuroimag. 2001;107:29–43. - PubMed
-
- Bueti D, Lasaponara S, Cercignani M, Macaluso E. Learning about time: plastic changes and interindividual brain differences. Neuron. 2012;75:725–737. - PubMed
Publication types
MeSH terms
Grants and funding
LinkOut - more resources
Full Text Sources
Other Literature Sources
Miscellaneous
