. 2016 Jan 1;30(1):64-77.
doi: 10.1101/gad.266098.115. Epub 2015 Dec 23.

p53 genes function to restrain mobile elements

Affiliations

p53 genes function to restrain mobile elements

Annika Wylie et al. Genes Dev. .

Abstract

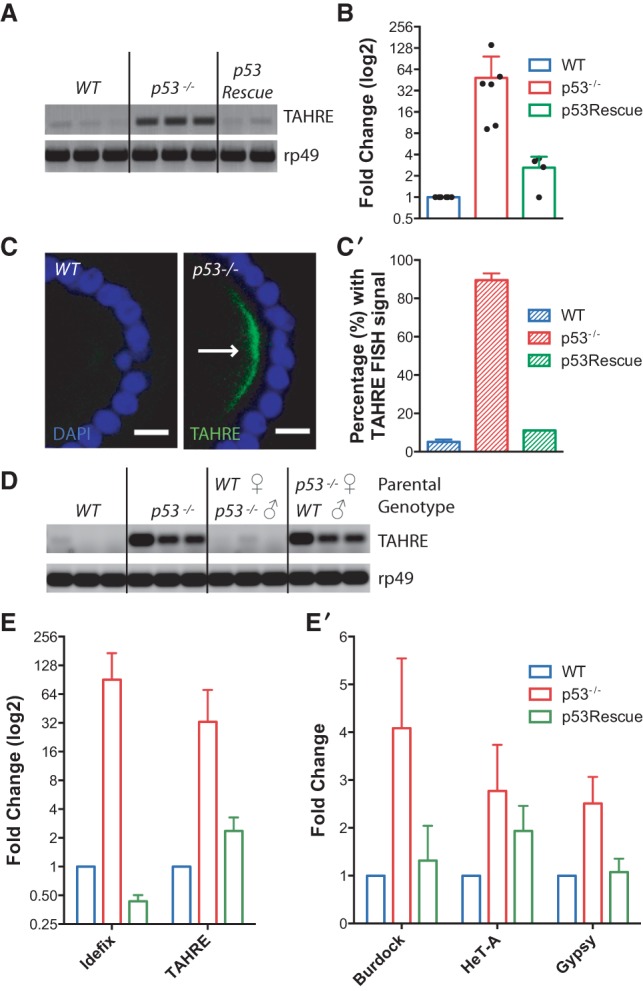
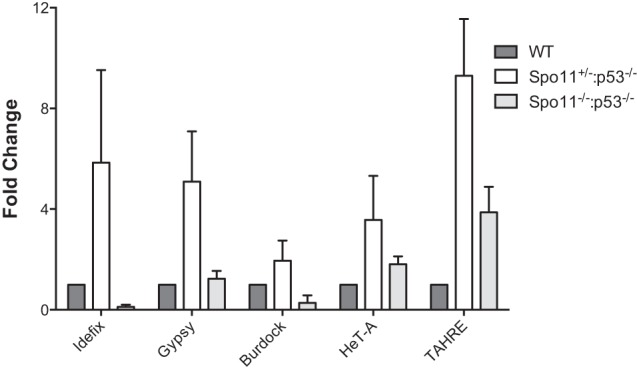
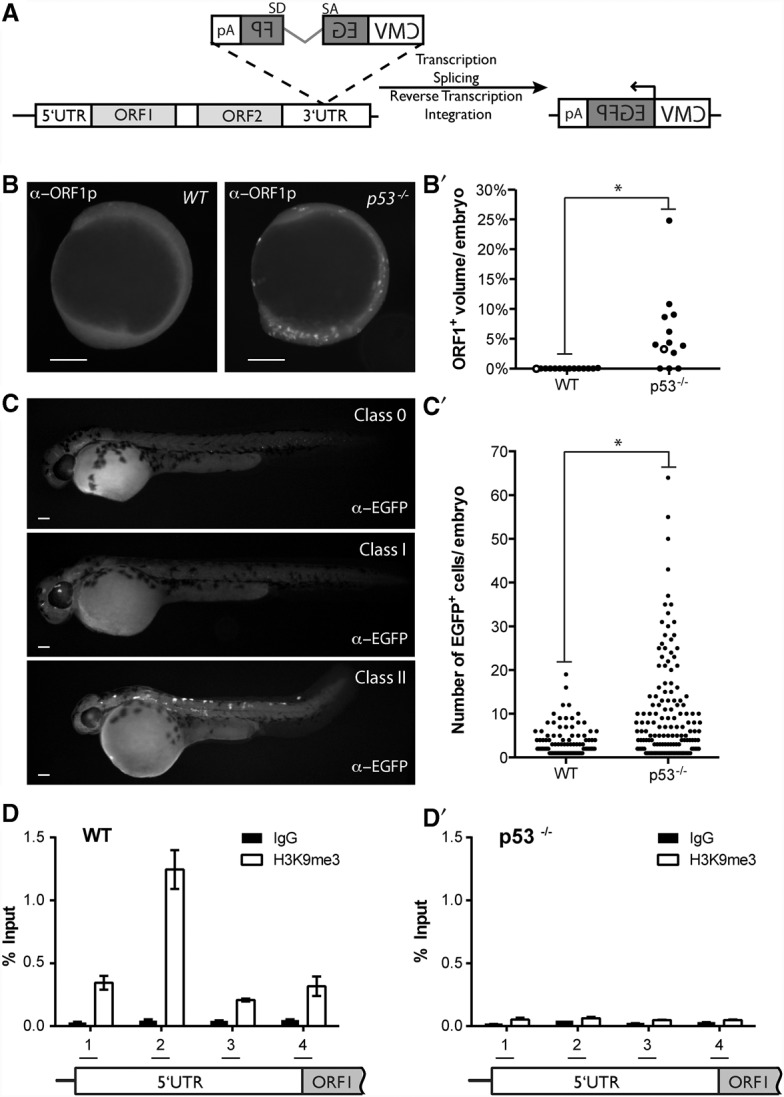
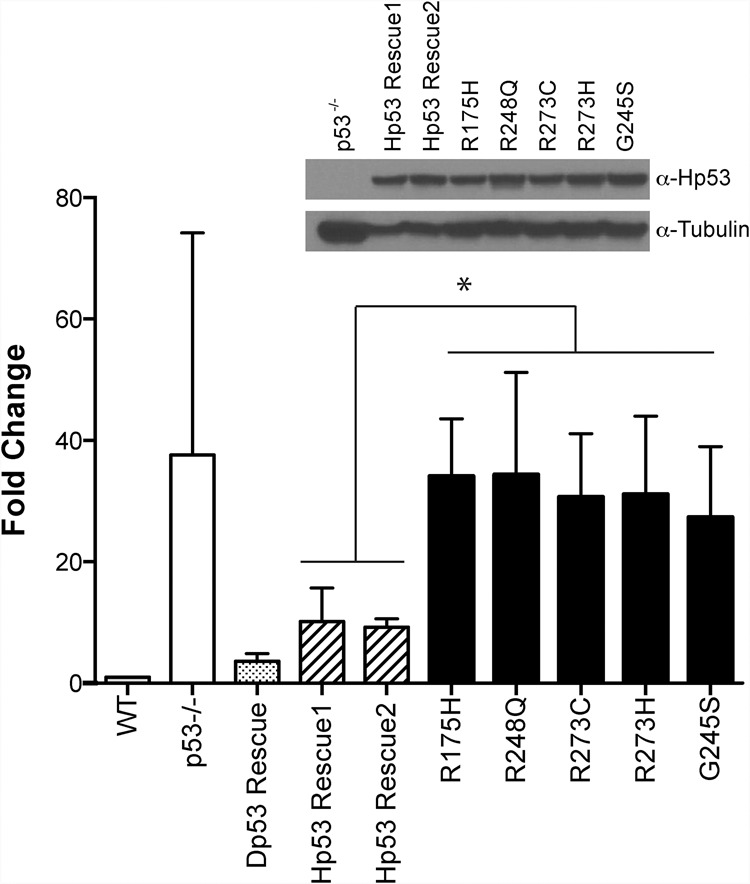
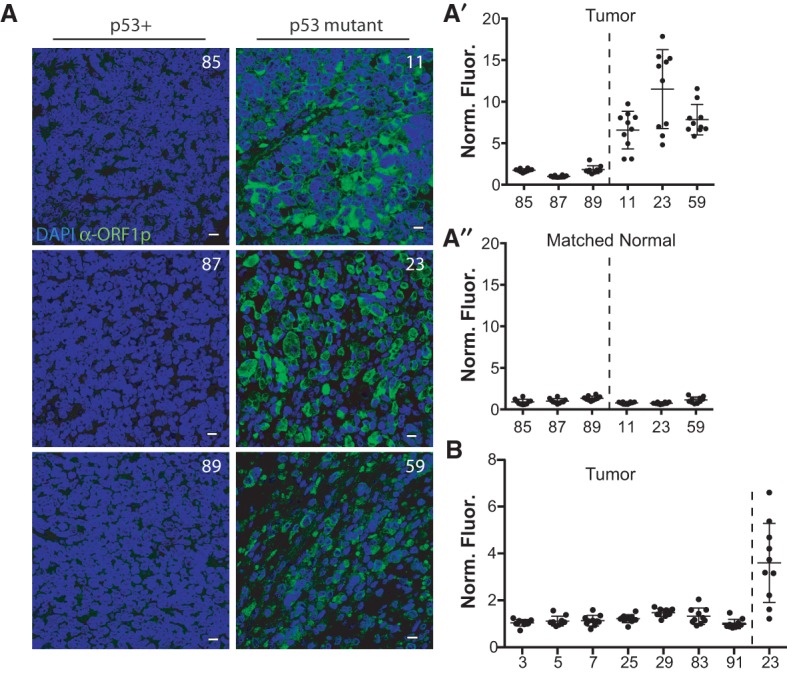
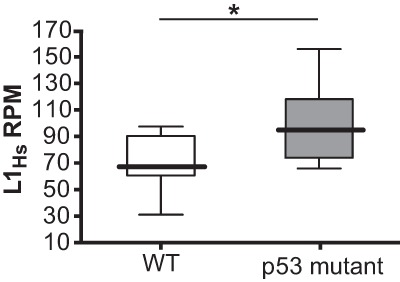
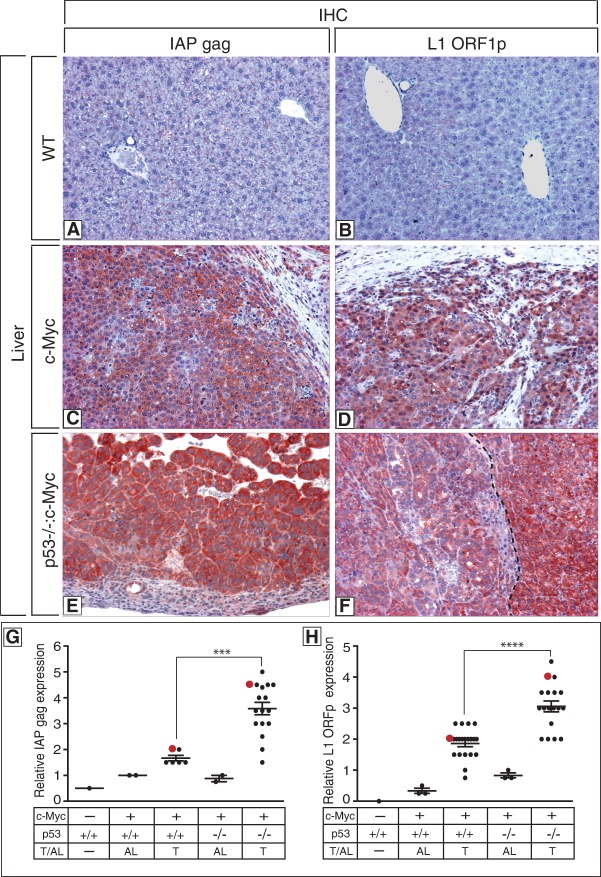
Throughout the animal kingdom, p53 genes govern stress response networks by specifying adaptive transcriptional responses. The human member of this gene family is mutated in most cancers, but precisely how p53 functions to mediate tumor suppression is not well understood. Using Drosophila and zebrafish models, we show that p53 restricts retrotransposon activity and genetically interacts with components of the piRNA (piwi-interacting RNA) pathway. Furthermore, transposon eruptions occurring in the p53(-) germline were incited by meiotic recombination, and transcripts produced from these mobile elements accumulated in the germ plasm. In gene complementation studies, normal human p53 alleles suppressed transposons, but mutant p53 alleles from cancer patients could not. Consistent with these observations, we also found patterns of unrestrained retrotransposons in p53-driven mouse and human cancers. Furthermore, p53 status correlated with repressive chromatin marks in the 5' sequence of a synthetic LINE-1 element. Together, these observations indicate that ancestral functions of p53 operate through conserved mechanisms to contain retrotransposons. Since human p53 mutants are disabled for this activity, our findings raise the possibility that p53 mitigates oncogenic disease in part by restricting transposon mobility.

Keywords: Drosophila; human cancers; mouse cancer models; p53; piRNAs; retrotransposons; zebrafish.


Figures

Figure 1.
Figure 1.
p53 restrains transposon activity in the Drosophila germline. (A) TAHRE retrotransposons, measured by RT–PCR, are highly expressed in dp53 ovaries but minimally expressed in parental wild-type or dp53 flies carrying p53Rescue. The control reference gene ribosomal protein L32 (rp49) is present at similar levels among all genotypes. (B) Derepression of TAHRE transcripts in ovaries of single animals was quantified using ddPCR standardized to the housekeeping gene rp49. Each dot represents measurements from an ovary pair from a single female. TAHRE retrotransposons were consistently dysregulated in dp53 animals (red bar). Normal repression, comparable with wild type (blue bar), occurred when the p53Rescue transgene was present in these mutants (green bar). p53 was significantly different from wild type (P-value = 0.0172) and p53Rescue (P = 0.0347) (see the Materials and Methods). (C,C′) TAHRE expression was assayed by FISH. In C, TAHRE RNAs (arrow) accumulate in the germ plasm of p53 oocytes (stage 9) of stage 9 and 10 egg chambers but not in wild-type egg chambers. (Green) TAHRE signal; (blue) DAPI counterstain. These data are quantified in C′, illustrating TAHRE derepression in p53 ovaries (red bar) Bars, 10 μm. Wild type was significantly different from p53 (P = 0.001) (see the Materials and Methods). (D) TAHRE transcripts, measured by RT–PCR, are maternally loaded into the 1- to 4-h-old embryo. TAHRE elements are derepressed in the p53 embryo (parental genotypes were p53−/−) but undetectable in the wild-type embryo (parental genotypes were wild type). Robust TAHRE expression was also observed in embryos from p53 mothers mated to wild-type fathers (parental genotypes are p53−/− female; wild-type male) but not in embryos from the reciprocal cross (wild-type female; p53−/− male). The control reference transcript rp49 is present at similar levels among all genotypes. Three independent biological replicates are shown for all genotypes. (E,E′) Expression from the indicated retroelements was measured by quantitative RT–PCR. In E the Idefix and TAHRE elements were highly derepressed in dp53 ovaries (red bars) relative to wild-type (blue bars) or p53Rescue (green bars) samples. In E′, retroelements from the Burdock, Gypsy, and HeT-A families (red bars) were similarly but more modestly derepressed in p53 ovaries. Note that in E, the fold change is plotted on a log2 scale to better appreciate differences in transcript levels between wild-type and p53Rescue flies. The error bars represent standard deviations. p53 samples were significantly different from wild type (P-value < 0.05) for Idefix, TAHRE, Burdock, HeT-A, and Gypsy. p53 samples were significantly different from p53Rescue (P -value < 0.05) for TAHRE, Burdock, and Gypsy.
Figure 2.
Figure 2.
Retrotransposon derepression in p53 animals requires Spo11 function. Expression from the indicated retroelements was measured in Drosophila ovaries of the indicated genotypes by qRT–PCR. Idefix, Gypsy, Burdock, HeT-A, and TAHRE elements are derepressed in spo11+/−; p53−/− ovaries (white bars), unlike wild-type (dark-gray bars) or spo11−/−;p53−/− (light-gray bars) samples. Error bars represent standard deviations from three biological replicates. For HeT-A, spo11+/−;p53−/− samples were significantly different from spo11−/−; p53−/−at the 90% confidence interval (P-value = 0.0803). For all other samples, spo11+/−;p53−/− was statistically significant from wild-type (P-value < 0.05) and spo11−/−;p53−/− (P-value < 0.05) samples (see the Materials and Methods).
Figure 3.
Figure 3.
Unrestrained retroelements in p53 fish are integration-competent and lack repressive chromatin marks. (A) pLRE3-mEGFPI is a widely used integration reporter (Coufal et al. 2009, 2011; Garcia-Perez et al. 2010) schematized here. It consists of a retrotransposition-competent human LINE-1 (LRE3) (Brouha et al. 2002) containing an internal RNA polymerase II promoter in its 5′ UTR (light-gray box), two ORFs (ORF1 [light-gray box] and ORF2 [light-gray box]), and the mEGFPI retrotransposition indicator cassette in its 3′ UTR (Ostertag et al. 2000; Garcia-Perez et al. 2010). The mEGFPI retrotransposition indicator cassette encodes a backward copy of a CMV-driven EGFP (dark-gray box) that is interrupted by an intron ([SD] splice donor; [SA] splice acceptor) that is in the same transcriptional orientation as LRE3 (Ostertag et al. 2000). The arrangement of the indicator cassette ensures that EGFP+ cells will arise only if the LRE3 transcript undergoes a successful round of retrotransposition. LRE3 expression levels were assayed using a previously described antibody that detects the human ORF1-encoded protein (α-ORF1p) (Rodic et al. 2014). LRE3 integration events were visualized using an antibody against EGFP (α-EGFP). (B,B′) Human LRE3 ORF1p expression in 11-hpf embryos injected with the pLRE3-mEGFPI expression construct. In B, ORF1p immunoreactivity is undetectable in wild-type embryos (left panel) but is abundant in p53 embryos (right panel). In B′, quantification of ORF1p expression in wild-type and p53 embryos is plotted. The X-axis indicates genotypes injected. The Y-axis plots the volume of ORF1 expression normalized to total embryonic volume (see the Materials and Methods) for individual animals (black dots). The two embryos shown in B are each represented as an open circle on the graph in B′. Note that prominent ORF1p expression is frequently observed in p53 embryos but is absent in wild-type animals. (*) P-value < 0.0025. (C,C′) Retrotransposition events derived from pLRE3-mEGFPI can be stratified into three classes in 48-hpf embryos, as indicated in C. Class 0 consists of embryos with no EGFP+ cells. Class I consists of embryos that have <13 EGFP+ cells. Class II consists of embryos that have ≥13 EGFP+ cells. Note that all animals in C are p53. In C′, the number of EGFP+ cells in class I and class II embryos is plotted for the indicated genotypes (X-axis). The Y-axis indicates the number of EGFP+ cells per embryo. Each dot represents an individual animal. Class II embryos were frequently observed in p53 embryos (27.3%) but were only rarely observed in wild-type animals (2.1%). (*) P-value < 0.0001. The pLRE3H230A-mEGFPI expression plasmid contains a missense mutation in the endonuclease domain of the LRE3 ORF2-encoded protein (ORF2p) (Coufal et al. 2011) and serves as a negative control (Supplemental Table 3). The pLRE3H230A-mEGFPI control plasmid produced only class 0 embryos when injected into wild-type and p53 animals (wild type, n = 149; p53−/−, n = 49) (Supplemental Table 3). Similarly, uninjected controls only produced class 0 animals (wild type, n = 209; p53−/−, n = 178) (Supplemental Table 3). Bars, 200 μm. (D,D′) H3K9 trimethylation across the LRE3 5′ UTR in wild-type (D) and p53 (D′) zebrafish. Chromatin immunoprecipitation (ChIP) analysis was performed in 4-hpf zebrafish embryos injected with the pLRE3-mEGFPI reporter construct using a H3K9 trimethyl (H3K9me3) antibody (open bars) and control IgG (closed bars). H3K9me3 levels were determined at four sites (1–4) spanning the L1 5′ UTR by ddPCR (see the schematic in the bottom panel). H3K9me3 marks were enriched in wild-type embryos, notably at primer pair 2 (D), but the signal for H3K9me3 was similar to background IgG controls in p53 embryos (D′). H3K9me3 levels were normalized to input, and mean values with 95% confidence intervals are presented. Total H3 levels were similar across the 5′ UTR for each genotype (Supplemental Fig. 7). See Supplemental Figure 7 for H3K9me3 levels normalized to total H3 and Supplemental Figure 6 for a second biological replicate.
Figure 4.
Figure 4.
Human p53 corrects dysregulated transposon activity in p53 flies, but variants commonly seen in patients do not. TAHRE retrotransposon expression was quantified in ovaries from humanized p53 Drosophila strains (see the text) using ddPCR (standardized to the housekeeping gene rp49). Note that dysregulation seen in p53 flies (white bar) is effectively corrected in rescue lines encoding either the fly p53 gene (Dp53 Rescue; dotted bar) or the wild-type human p53 gene (striped bars). Lines humanized with distinct p53 mutant alleles commonly seen in cancers (black bars) were not corrected for transposon dysregulation despite comparable expression from these alleles, as verified by Western blot shown using Drosophila Tubulin as a loading control (inset). Note that each cancer-associated allele (black bars) differs from wild-type human p53 (striped bars) by the single amino acid indicated, and all human transgenes are positioned at the same “landing site” in the fly genome (see the Materials and Methods). Hp53 Rescue1 and Hp53 Rescue2 are independently generated lines. All p53 cancer-associated alleles are significantly different from wild-type human p53 strains, denoted by the asterisk (P-value < 0.05) (see the Materials and Methods). Error bars represent standard deviations.
Figure 5.
Figure 5.
Deregulated retroelements stratify with p53 mutations in Wilms tumors. (A) Compared with Wilms tumors that are wild type for p53 (left panels: 85, 87, and 89), Wilms tumors that are mutant for p53 (right panels: 11, 23, and 59) show dramatically elevated human LINE-1 ORF1p expression (α-ORF1p [green]; counterstained with DAPI [blue]) (Rodic et al. 2014). Bars, 10 μm. (A′) Quantification of results in A was measured here using automated image analyses (see the Materials and Methods). On the X-axis, tumors wild type for p53 (tumors 85, 87, and 89) are separated by a dotted line from tumors mutant for p53 (tumors 11, 23, and 59). The Y-axis plots the normalized fluorescence intensity (Norm. Fluor.), where the fluorescence intensity of ORF1p expression is normalized to the DAPI volume (see the Materials and Methods) for individual fields of view, each represented as a dot. Ten fields of view were taken per tumor (shown in Supplemental Fig. 9). The normalized fluorescence intensity of tumors mutant for p53 (tumors 11, 23, and 59) is significantly different from the tumors wild type for p53 (tumors 85, 87, and 59) (P-value < 0.0001) (see the Materials and Methods). In A′′ note that fluorescence intensities were similar across all matched normal tissue. (B) Seven additional Wilms tumors wild type for p53 were quantified. On the X-axis, tumors wild type for p53 (tumors 3, 5, 7, 25, 29, 83, and 91) are separated by a dotted line from the tumor mutant for p53 (tumor 23, used as a positive control). The Y-axis plots the normalized fluorescence intensity (Norm. Fluor.), where the fluorescence intensity of ORF1p expression is normalized to the DAPI volume (see the Materials and Methods) for individual fields of view, each represented as a dot. Ten fields of view were taken per tumor. The normalized fluorescence intensity of the tumor mutant for p53 (tumor 23) is significantly different from the tumors wild type for p53 (tumors 3, 5, 7, 25, 29, 83, and 91) (P < 0.0001) (see the Materials and Methods). Note that p53 mutations appearing in these Wilms tumors are listed in Supplemental Table 5. Specificity controls for the human L1 ORF1p antibody are shown in Supplemental Figure 8.
Figure 6.
Figure 6.
Deregulated retroelements stratify with p53 mutations in colon cancers. L1Hs expression was analyzed in colon cancer patients corresponding to all TCGA single-end RNA-seq data sets for which matched normals and raw sequences were available. Eight patient samples were wild type for p53 (open box plot), and 10 patient samples were mutant for p53 (gray box plot). The X-axis indicates p53 status. The Y-axis indicates L1Hs reads per million (RPM). Medians are represented by thick lines, and, for each box, the top edge is the 75th percentile, and the bottom edge is the 25th percentile. The top and bottom whiskers are maximum and minimum values, respectively. Note that cancers bearing p53 mutations (gray) are elevated for L1Hs expression relative to cancers that are wild type for p53 (open). (*) P-value = 0.03. In contrast, RNA-seq reads corresponding to simple repeats or pseudogenes are similar for p53 wild-type and p53 mutant genotypes (see Supplemental Fig. 11). See Supplemental Table 5 and Petitjean et al. (2007) for p53 mutations in colon cancer samples.
Figure 7.
Figure 7.
Elevated retrotransposon expression in mouse tumors lacking p53. (AF) Photomicrographs of livers from a wild-type (A,B), a c-Myc-expressing (C,D), and a p53-null c-Myc-expressing (E,F) mouse depicting elevated expression of mouse IAP gag (red staining; left panels) (Dewannieux et al. 2004) and mouse L1 ORF1p (red staining; right panels) (Soper et al. 2008) in tumors (CF). The dotted line in F denotes the boundary between a tumor with modest expression of L1 ORF1p (left) and one expressing high levels of L1 ORF1p (right). Original magnifications, ×125. Specificity controls for antibody stainings are shown in Supplemental Figure 12 for IAP gag and L1 ORF1p. (G,H) Graphs showing quantitation of relative levels of IAP gag and L1 ORF1p in the wild-type liver, adjacent liver (AL), and liver tumors (T) in p53+/+:Myc and p53−/−:Myc mice. Quantitation was performed as described in the Materials and Methods and in Comerford et al. (2014). Red dots in G and H correspond to immunohistochemistry images in CF. In F, two distinct tumors are shown, and the matching red dot in H corresponds to the highest-expressing tumor at the right. The intensity of staining of IAP gag (G) and L1 ORF1p (H) in Myc-driven tumors in p53-null mice is significantly different from Myc-driven tumors in p53 wild-type mice, denoted by asterisks (P-value < 0.0001) (see the Materials and Methods).

References

    1. Aravin AA, Hannon GJ, Brennecke J. 2007. The Piwi–piRNA pathway provides an adaptive defense in the transposon arms race. Science 318: 761–764. - PubMed
    1. Beauregard A, Curcio MJ, Belfort M. 2008. The take and give between retrotransposable elements and their hosts. Annu Rev Genet 42: 587–617. - PMC - PubMed
    1. Beck CR, Collier P, Macfarlane C, Malig M, Kidd JM, Eichler EE, Badge RM, Moran JV. 2010. LINE-1 retrotransposition activity in human genomes. Cell 141: 1159–1170. - PMC - PubMed
    1. Berghmans S, Murphey RD, Wienholds E, Neuberg D, Kutok JL, Fletcher CD, Morris JP, Liu TX, Schulte-Merker S, Kanki JP, et al. 2005. tp53 mutant zebrafish develop malignant peripheral nerve sheath tumors. Proc Natl Acad Sci 102: 407–412. - PMC - PubMed
    1. Bogdanovic O, Fernández-Miñán A, Tena JJ, de la Calle-Mustienes E, Gómez-Skarmeta JL. 2013. The developmental epigenomics toolbox: ChIP-seq and MethylCap-seq profiling of early zebrafish embryos. Methods 62: 207–215. - PubMed

Publication types