. 2016 Jan 1;30(1):34-51.
doi: 10.1101/gad.270959.115. Epub 2015 Dec 23.

Differentiation of mammary tumors and reduction in metastasis upon Malat1 lncRNA loss

Affiliations

Differentiation of mammary tumors and reduction in metastasis upon Malat1 lncRNA loss

Gayatri Arun et al. Genes Dev. .

Abstract

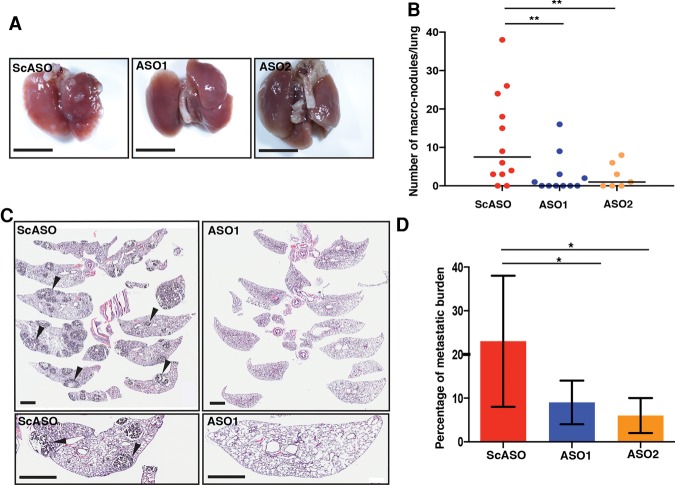
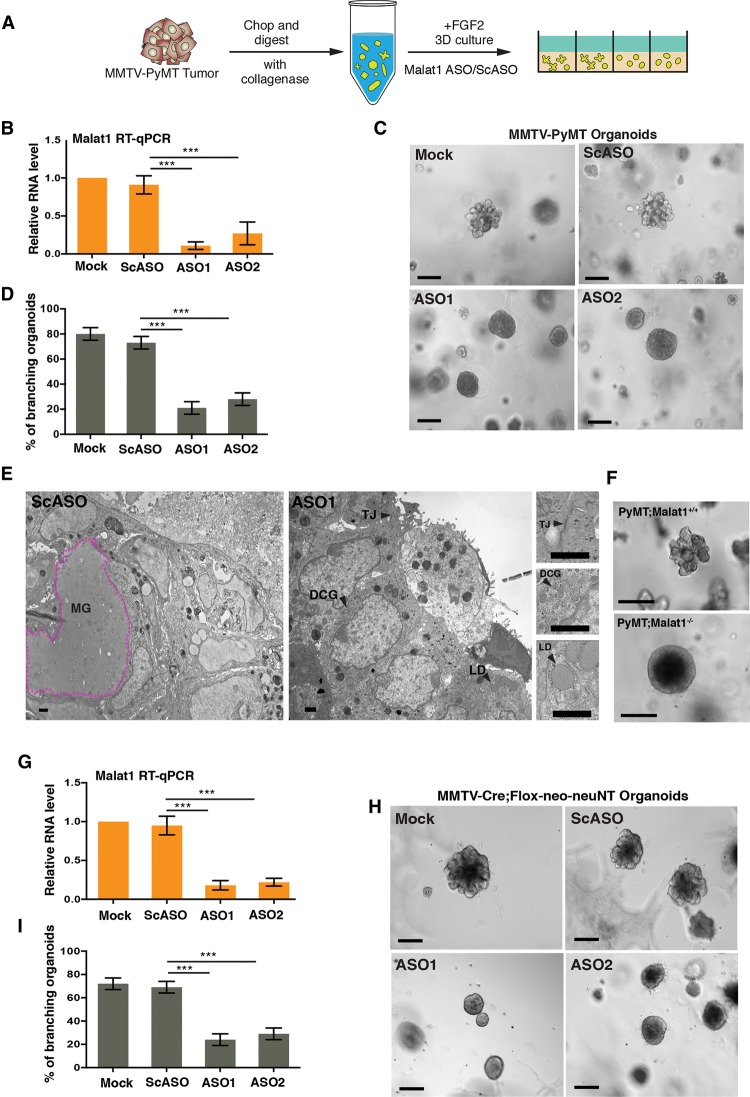
Genome-wide analyses have identified thousands of long noncoding RNAs (lncRNAs). Malat1 (metastasis-associated lung adenocarcinoma transcript 1) is among the most abundant lncRNAs whose expression is altered in numerous cancers. Here we report that genetic loss or systemic knockdown of Malat1 using antisense oligonucleotides (ASOs) in the MMTV (mouse mammary tumor virus)-PyMT mouse mammary carcinoma model results in slower tumor growth accompanied by significant differentiation into cystic tumors and a reduction in metastasis. Furthermore, Malat1 loss results in a reduction of branching morphogenesis in MMTV-PyMT- and Her2/neu-amplified tumor organoids, increased cell adhesion, and loss of migration. At the molecular level, Malat1 knockdown results in alterations in gene expression and changes in splicing patterns of genes involved in differentiation and protumorigenic signaling pathways. Together, these data demonstrate for the first time a functional role of Malat1 in regulating critical processes in mammary cancer pathogenesis. Thus, Malat1 represents an exciting therapeutic target, and Malat1 ASOs represent a potential therapy for inhibiting breast cancer progression.

Keywords: Malat1; antisense therapy; breast cancer; metastasis; noncoding RNA; tumor differentiation; tumor organoids.


Figures

Figure 1.
Figure 1.
Impaired tumor progression and metastasis in MMTV-PyMT mice lacking Malat1. (A) Kaplan-Meier curves for tumor-free survival in MMTV-PyMT;Malat1+/+ (n = 18) and MMTV-PyMT;Malat1−/− (n = 24) mice. (B) Total tumor burden in MMTV-PyMT;Malat1+/+ (n = 8) and MMTV-PyMT;Malat1−/− (n = 12) mice from the detection of tumors (∼6 mm) over a period of 9 wk. Error bars represent SEM. (C) Surgically removed tumors from MMTV-PyMT;Malat1+/+ (left panel) and MMTV-PyMT;Malat1−/− (right panel) mice. Bar, 2 mm. (D) H&E-stained sections of primary tumors from MMTV-PyMT;Malat1+/+ and MMTV-PyMT;Malat1−/− mice. The entire tumor section and a higher magnification of a small region are shown from both genotypes. Bars: 2 mm and 200 µm for the different magnifications, respectively. (E) Whole-lung images showing lung metastatic nodules in MMTV-PyMT;Malat1+/+ (left panel) compared with MMTV-PyMT;Malat1−/− (right panel). Bar, 5 mm. (F) Quantitation of number of macrometastatic nodules per lungs (total nodules/2). Error bars represent standard deviation (SD). (***) P < 0.001 by Wilcoxon signed rank test. (G) H&E-stained lung sections showing regions of micrometastasis in MMTV-PyMT;Malat1+/+ lungs (left panel) and MMTV-PyMT;Malat1−/− lungs (right panel). Bar, 2 mm. (H) Percentage of lung metastatic burden over total lung area of MMTV-PyMT;Malat1+/+mice (n = 7) and MMTV-PyMT;Malat1−/− mice (n = 4). Error bars represent SD. (***) P < 0.001 by Wilcoxon signed rank test.
Figure 2.
Figure 2.
Efficient knockdown of Malat1 in tumors using ASOs. (A) RNA-FISH using a MALAT1-specific probe on matched human primary tumor and lung metastases from breast cancer patients. Bar, 200 µm. Magnification scale is 15× using Aperio Scanscope. (B) Quantitation of MALAT1 FISH signal in primary tumor and lung metastasis tissue array samples from breast cancer patients. (C) Schematic of the ASO treatment protocol in MMTV-PyMT mice. (D) RT-qPCR of Malat1 knockdown in tumors of mice treated with scrambled ASO compared with Malat1 ASO1 or ASO2. Relative fold change calculated based on the geometric mean of Gapdh, β-actin, and Hprt RNA levels. Error bars represent SD. (**) P < 0.01 by Student's t-test. (E) RNA-FISH of tumor sections using a Malat1-specific probe. Bar, 100 µm. Magnification scale is 20× using Aperio Scanscope. (F) Normalized tumor growth curve of MMTV-PyMT mice treated with control scrambled ASO (ScASO) (n = 12), Malat1 ASO1 (n = 11), or Malat1 ASO2 (n = 7). Error bars represent SEM. (*) P < 0.05; (**) P < 0.01 by ANOVA. (G) Percentage of Ki-67-positive cells in ScASO-treated tumors or Malat1 ASO1- or ASO2-treated tumors. n = 3 tumors from each group, with at least two sections from each tumor. Error bars represent SD. (*) P < 0.05; (**) P < 0.01 by Student's t-test.
Figure 3.
Figure 3.
Malat1 knockdown results in differentiation of MMTV-PyMT tumors. (A) Representative H&E-stained primary tumor sections from mice treated with ScASO (top panels) or Malat1 ASO1 or ASO2 (bottom panels). Bar, 100 µm. (B) The frequency of occurrence of different histologic grades in scrambled versus Malat1 ASO-treated tumor sections stained with H&E. n ≥ 20 tumors from each group. (*) P < 0.05 by Fisher's exact test. (C) Percentage of cystic area in the tumor sections from scrambled (n = 4) versus Malat1 ASO1-treated (n = 6) and ASO2-treated (n = 4) mice. Error bars represent SD. (**) P < 0.01 by Wilcoxon signed rank test. (D) Representative E-cadherin immunolabeling on cryosections of tumors from ScASO- or Malat1 ASO2-treated mice. Bars, 100 µm. (E) Representative β-casein immunolabeling on cryosections of tumors from ScASO-treated mice or Malat1 ASO1-treated mice. Bars, 100 µm.
Figure 4.
Figure 4.
Lung metastasis is impaired in Malat1 knockdown mice. (A) Representative lungs with metastatic nodules from ScASO-treated and Malat1 ASO1- or ASO2-treated mice. (B) Quantitation of lung metastatic nodules from ScASO-treated and Malat1 ASO1- or ASO2-treated mice. Each dot represents one mouse. (*) P < 0.05; (**) P < 0.01 by Wilcoxon signed rank test. (C) Representative H&E-stained lung sections from ScASO-treated and Malat1 ASO1-treated mice. Arrowheads indicate representative micrometastases. Bar, 2 mm. (D) Quantitation of the percentage of lung metastatic burden from ScASO-treated and Malat1 ASO1- or ASO2-treated mice. n = 5 lung sections from each group. Error bars represent SD. (*) P < 0.05 by Wilcoxon signed rank test.
Figure 5.
Figure 5.
Malat1 knockdown affects branching morphogenesis in the tumor-derived organoids. (A) Schematic of preparation of tumor-derived organoids. (B) qRT–PCR of relative Malat1 RNA level in MMTV-PyMT tumor-derived organoids mock-treated or treated with ScASO or Malat1 ASO1 or ASO2. n = 4 independent experiments. Error bars represent SD. (C) Differential interference contrast (DIC) images of organoids that were mock treated or treated with ScASO or Malat1 ASO1 or ASO2 after 6 d of culturing. Mock represents PBS-treated organoids. Bar, 125 µm. (D) Percentage of branched organoids from PyMT tumors subjected to mock, ScASO, or Malat1 ASO1 or ASO2 treatments. n = ≥ 200 organoids from four biological replicates. Error bars represent SD. (E) Representative transmission electron microscopy (TEM) images of a ScASO-treated PyMT organoid showing loosely opposed tumor cells with prominent internal deposit of Matrigel material (MG) and a Malat1 ASO1-treated PyMT organoid showing closely opposed polarized tumor cells with tight junctions (TJs) and evidence of secretory dense-core granules (DCGs) and lipid droplets (LDs). The insets are higher-magnification images of tight junctions, dense-core granules, and lipid droplets. Bars, 1 µm. (F) DIC images of tumor organoids from MMTV-PyMT;Malat1+/+ (top panel) and MMTV-PyMT;Malat1−/− (bottom panel). Bar, 100 µm. (G) RT-qPCR of relative Malat1 RNA level in MMTV-Cre;FL-neo-NeuNT tumor-derived organoids. n = 3 biological replicates. Error bars represent SD. (H) DIC image of MMTV-Cre;FL-neo-NeuNT organoids treated with mock, ScASO, and Malat1 ASO1 and ASO2 after 6 d of culturing. Bar, 125 µm. (I) Percentage of branched organoids from MMTV-Cre;FL-neo-NeuNT tumors subjected to treatment. n = ≥80 organoids from three biological replicates. Error bars represent SD.
Figure 6.
Figure 6.
Knockdown of Malat1 affects tumor progression by altering many signaling pathways. (A) Top 10 significantly up-regulated genes. (B) Top 10 significantly down-regulated genes. (C) GSEA of tumor data sets showing enrichment of genes that affect tumor progression upon Malat1 knockdown. (D) List of pathways that were significantly affected in tumors after Malat1 ASO1 or ASO2 treatment compared with a ScASO-treated control. Highlighted in gray are common pathways that are affected in both organoids and tumors. (E) Representative example of the integrin pathway that was significantly altered in Malat1 ASO-treated tumors versus the control. (F) De novo and known motif analyses of the promoters of differentially expressed genes.
Figure 7.
Figure 7.
Malat1 knockdown impacts alternative pre-mRNA splicing of the pre-mRNAs. (A) Venn diagram showing the total number of splicing changes in ASO1- and ASO2-treated tumors and tumor organoids with respect to scrambled-treated controls. Nearly 60% of changes overlap between ASO1- and ASO2-treated groups in at least two biological replicates. (B) Different types of splicing changes that are affected and the number of genes that are alternatively spliced upon MALAT1 ASO treatment in each of them. (C) University of California at Santa Cruz (UCSC) screenshot showing an example of an alternatively spliced exon in the Esr1 transcript. (D) UCSC screenshot showing an example of alternatively spliced exons in the Itga2b transcript resulting in partial intron retention. (E) Schematic of a working model of Malat1 RNA levels. Malat1 is expressed at a lower level in the differentiated mammary gland (normal) and early lesions (hyperplasia). Malat1 up-regulation in mammary tumors (carcinoma) is concomitant with dedifferentiation and metastasis of the tumors. (F) Schematic of the proposed molecular mechanism. The lncRNA Malat1 (green squiggles) shuttles between nuclear speckles and TSSs (arrowhead), where it can serve as a scaffold to regulate efficient transcription and alternative pre-mRNA splicing (red line).

References

    1. Aartsma-Rus A, Janson AA, Kaman WE, Bremmer-Bout M, van Ommen GJ, den Dunnen JT, van Deutekom JC. 2004. Antisense-induced multiexon skipping for Duchenne muscular dystrophy makes more sense. Am J Hum Genet 74: 83–92. - PMC - PubMed
    1. Ades F, Zardavas D, Bozovic-Spasojevic I, Pugliano L, Fumagalli D, de Azambuja E, Viale G, Sotiriou C, Piccart M. 2014. Luminal B breast cancer: molecular characterization, clinical management, and future perspectives. J Clin Oncol 32: 2794–2803. - PubMed
    1. Anczukow O, Rosenberg AZ, Akerman M, Das S, Zhan L, Karni R, Muthuswamy SK, Krainer AR. 2012. The splicing factor SRSF1 regulates apoptosis and proliferation to promote mammary epithelial cell transformation. Nat Struct Mol Biol 19: 220–228. - PMC - PubMed
    1. Anders S, Pyl PT, Huber W. 2015. HTSeq—a Python framework to work with high-throughput sequencing data. Bioinformatics 31: 166–169. - PMC - PubMed
    1. Andrechek ER, Hardy WR, Siegel PM, Rudnicki MA, Cardiff RD, Muller WJ. 2000. Amplification of the neu/erbB-2 oncogene in a mouse model of mammary tumorigenesis. Proc Nat Acad Sci 97: 3444–3449. - PMC - PubMed

Publication types

MeSH terms

Substances