. 2016 Feb 19:315:150-61.
doi: 10.1016/j.neuroscience.2015.12.012. Epub 2015 Dec 14.

Synergies in the space of control variables within the equilibrium-point hypothesis

Affiliations

Synergies in the space of control variables within the equilibrium-point hypothesis

S Ambike et al. Neuroscience. .

Abstract

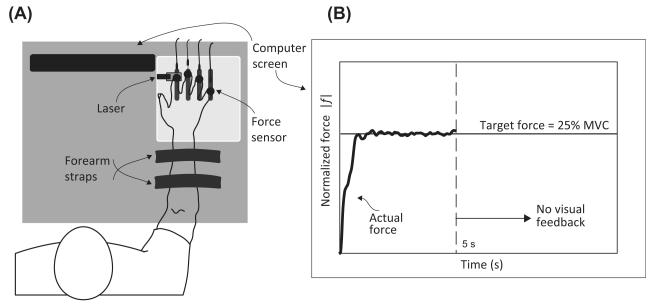
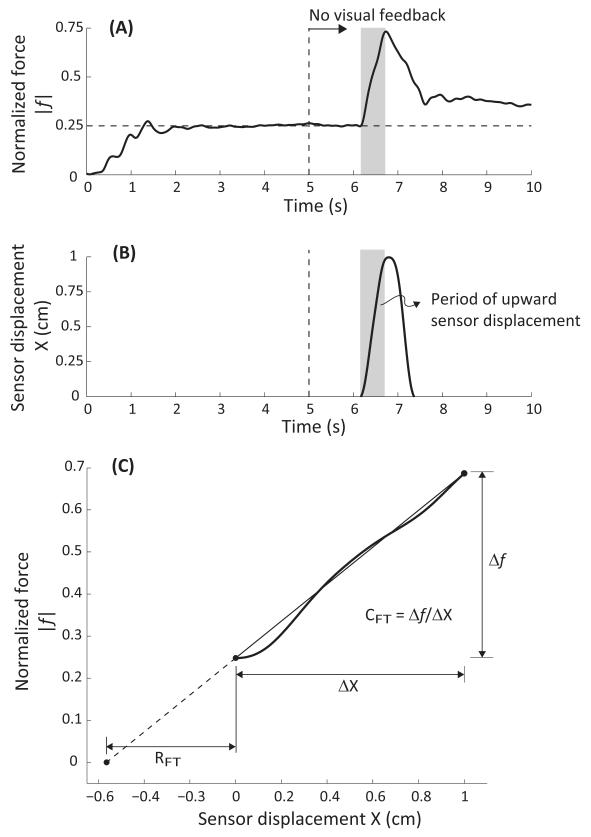
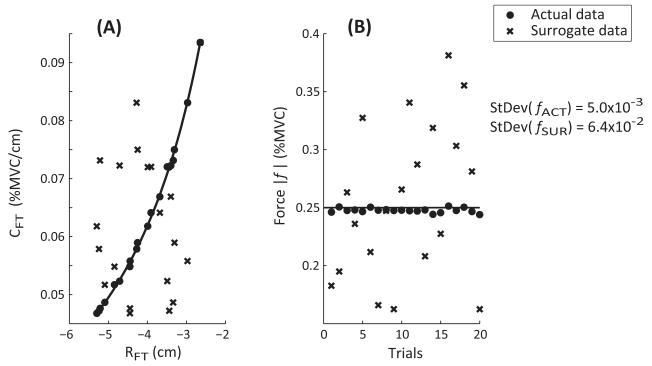
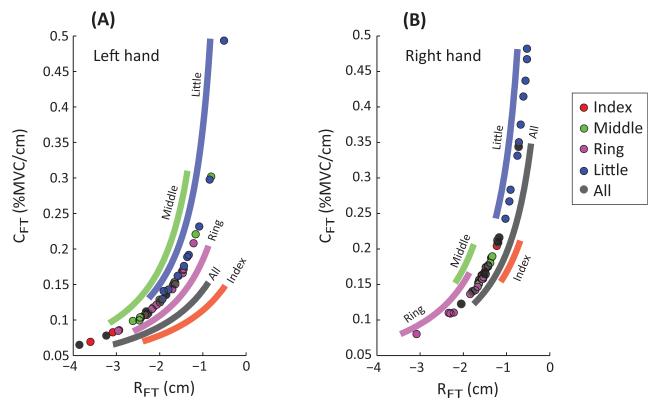
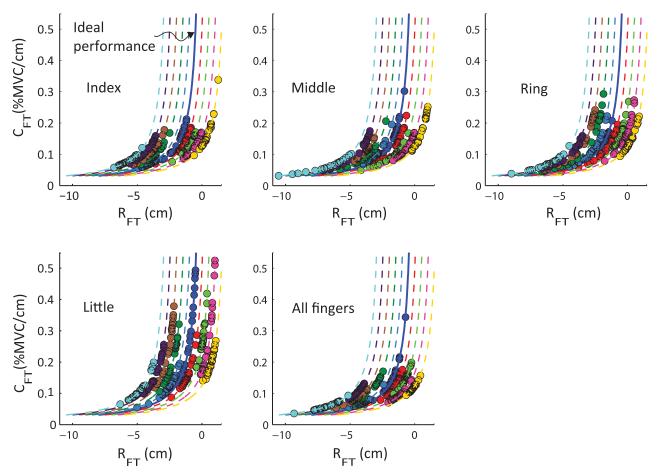
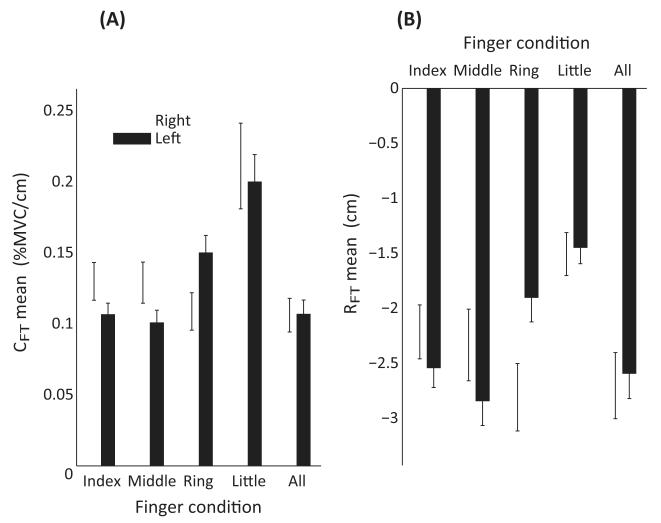
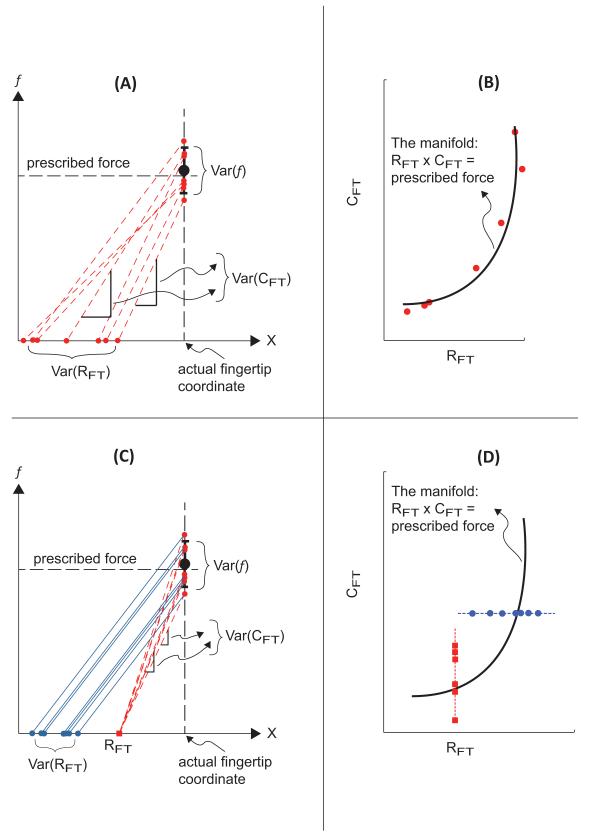
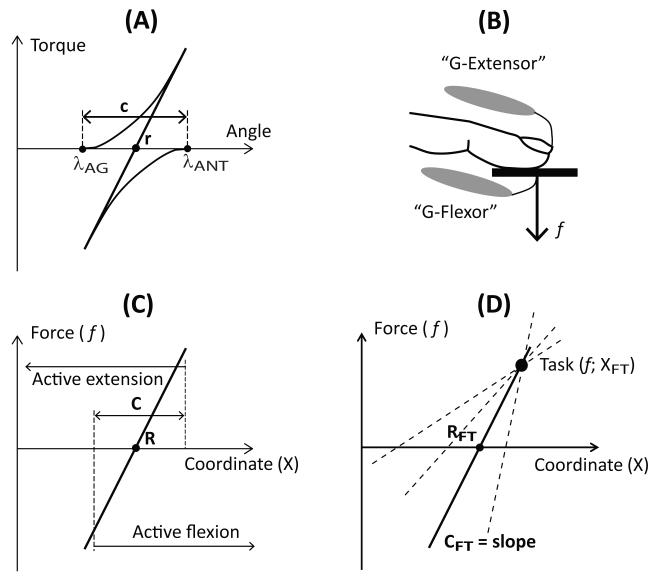
We use an approach rooted in the recent theory of synergies to analyze possible co-variation between two hypothetical control variables involved in finger force production based on the equilibrium-point (EP) hypothesis. These control variables are the referent coordinate (R) and apparent stiffness (C) of the finger. We tested a hypothesis that inter-trial co-variation in the {R; C} space during repeated, accurate force production trials stabilizes the fingertip force. This was expected to correspond to a relatively low amount of inter-trial variability affecting force and a high amount of variability keeping the force unchanged. We used the "inverse piano" apparatus to apply small and smooth positional perturbations to fingers during force production tasks. Across trials, R and C showed strong co-variation with the data points lying close to a hyperbolic curve. Hyperbolic regressions accounted for over 99% of the variance in the {R; C} space. Another analysis was conducted by randomizing the original {R; C} data sets and creating surrogate data sets that were then used to compute predicted force values. The surrogate sets always showed much higher force variance compared to the actual data, thus reinforcing the conclusion that finger force control was organized in the {R; C} space, as predicted by the EP hypothesis, and involved co-variation in that space stabilizing total force.

Keywords: apparent stiffness; equilibrium-point hypothesis; finger force; isometric; synergy; uncontrolled manifold hypothesis.


Figures

Figure 1
Figure 1
Model for finger force generation. Finger force generated by the fingertip in proportion to the difference between the nervous-system-defined referent coordinate (RFT) and the fingertip actual configuration (XFT). In Panels (A) and (B), the lab-fixed coordinate frame is conveniently located at the actual fingertip position, and the distance coordinate is measured positive upwards. Panels A and B depict the initial configuration and the configuration at the end of the upward perturbation of the sensor, respectively. Panel (C) depicts the sensor displacement vs fingertip force (absolute value) relation. The slope provides an estimate of the apparent fingertip stiffness (CFT), and the force-axis intercept provides the estimate of RFT.
Figure 2
Figure 2
The experimental setup. Panel (A) shows the subject with the fingers of the test hand resting on four force sensors. The laser measures the sensor displacement, and visual feedback of the produced force is presented on a computer screen placed in front of the subject. Panel (B) shows the visual feedback. The target force is presented as a solid horizontal line. The subject’s output force is displayed as a continuous trace moving from the left to the right for the first 5 s of the trial. Then the feedback disappears.
Figure 3
Figure 3
Typical subject response and computation of the referent variables. Panel (A) shows the temporal evolution of the normalized fingertip force (absolute value). Panel (B) plots the sensor displacement against time. Visual feedback is removed at the 5-s mark. The sensor was lifted and lowered in each trial. However, only the initial portion when the sensor height increased was used for further analysis. This portion is indicated by shaded rectangles in Panels (A) and (B). Panel (C) plots the fingertip force against the sensor displacement during the rising phase of the sensor displacement. It also depicts the computation of the referent fingertip position RFT and the fingertip apparent stiffness CFT.
Figure 4
Figure 4
Generation of surrogate data. Panel (A) shows a set of twenty {RFT; CFT} pairs for one finger condition (data is pooled across the hands) as the solid dots that align with the hyperbolic curve. The surrogate data {RFTsur; CFTsur} obtained by permuting RFT and CFT are depicted as crosses. Panel (B) depicts the actual forces obtained from the original data set as solid dots, and the surrogate forces obtained from the permuted data as crosses. The standard deviation (StDev) in the original forces is lower than that in the forces generated using the surrogate data (fsur).
Figure 5
Figure 5
Referent variables for a random subject for all finger conditions are depicted as solid dots for the left and right hands in Panels (A) and (B), respectively. The solid bands represent the spread of the data for each condition. The bands are displaced along the horizontal axis for clarity.
Figure 6
Figure 6
The referent fingertip position RFT is plotted against the apparent stiffness CFT for each finger condition. Data is poled across all subjects. The data for nine subjects are displaced horizontally along the RFT axis to illustrate the spread for each subject. The dashed lines are linearly-displaced replicates of the hyperbola for ideal performance (the solid curve): RFT × CFT = −0.25.
Figure 7
Figure 7
The across-subject mean ± SE of the mean apparent stiffness CFT and the referent fingertip RFT coordinate for all finger conditions and both hands are shown in Panel (A) and Panel (B), respectively.
Figure 8
Figure 8
Possible across-trials changes in {RFT; CFT} that yield the same force variance. Panel (A) depicts finger force (f) plotted against the fingertip coordinate (X). Force variability over repeated trials results from co-variation of RFT and CFT. These data are spread along the hyperbolic UCM depicted in Panel (B). Panel (C) depicts two hypothetical behaviors that yield the same force variance. In one example (dashed inclined lines), RFT is constant (square point on the X axis), and the force variability stems from the variability in CFT. In the other example (solid inclined lines), the slope (CFT) is constant and force variability stems from RFT variability. These data appear as vertical and horizontal lines, respectively, in Panel (D).
Figure 9
Figure 9
(A): The control of a single joint can be described with two variables (thresholds of the tonic stretch reflex, λ) for the agonist (λAG) and antagonist (λANT) muscles. The overall joint behavior will be defined by its torque-angle characteristic (the solid line), which is the algebraic sum of the muscle characteristics (solid curves). Its location is defined by the r-command (the mid-point between the two λs), while its slope is defined by the c-command (the spatial range where both muscles are activated). (B): Force production by the fingertip may be viewed as an interaction between groups of muscles: generalized flexors (G-flexor) and generalized extensors (G-extensor). (C): Neural commands change the spatial ranges of activation of the G-flexor and G-extensor muscles, which may be viewed as changing the mid-point (R) and the range (C) where both muscles are active on the force-coordinate plane. (D): Changing the R and C commands results in a shift of the X intercept (RFT) and slope (CFT) of the fingertip force-coordinate characteristic. A given task may be accomplished by different combinations {R; C} resulting in different combinations {RFT; CFT} shown by different force-coordinate lines.

References

    1. Ambike S, Paclet F, Zatsiorsky VM, Latash ML. Factors affecting grip force: anatomy, mechanics, and referent configurations. Exp Brain Res. 2014;232:1219–1231. - PMC - PubMed
    1. Ambike S, Zhou T, Zatsiorsky VM, Latash ML. Moving a hand-held object: Reconstruction of referent coordinate and apparent stiffness trajectories. Neurosci. 2015;298:336–356. - PMC - PubMed
    1. Asatryan DG, Feldman AG. Functional tuning of the nervous system with control of movements or maintenance of a steady posture. I. Mechanographic analysis of the work of the limb on execution of a postural task. Biophysics. 1965;10:925–935.
    1. Bernstein N. The Coordination and Regulation of Movements. Pergamon Press; Oxford: 1967.
    1. Bizzi E, Giszter SF, Loeb E, Mussa-Ivaldi FA, Saltiel P. Modular organization of motor behavior in the frog's spinal cord. Trends Neurosci. 1995;18:442–446. - PubMed

Publication types

LinkOut - more resources