. 2016 Feb 2;7(5):6243-54.
doi: 10.18632/oncotarget.6668.

The significance of Brf1 overexpression in human hepatocellular carcinoma

Affiliations

The significance of Brf1 overexpression in human hepatocellular carcinoma

Qian Zhong et al. Oncotarget. .

Abstract

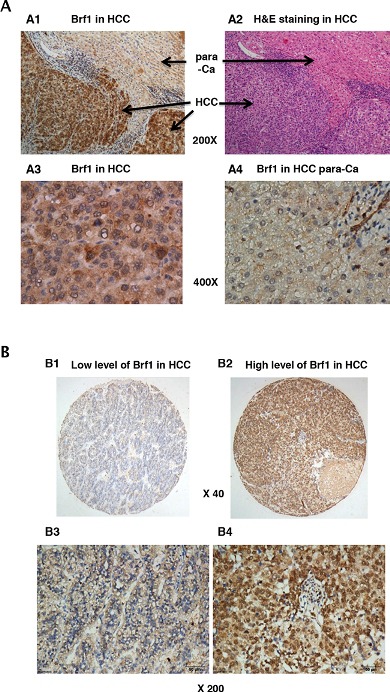
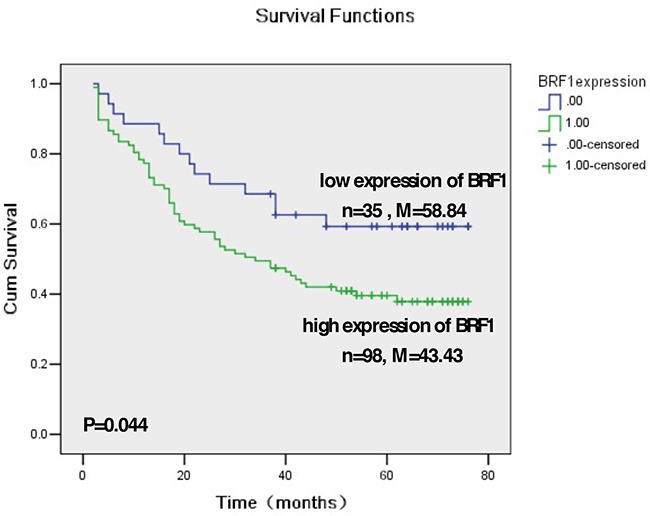
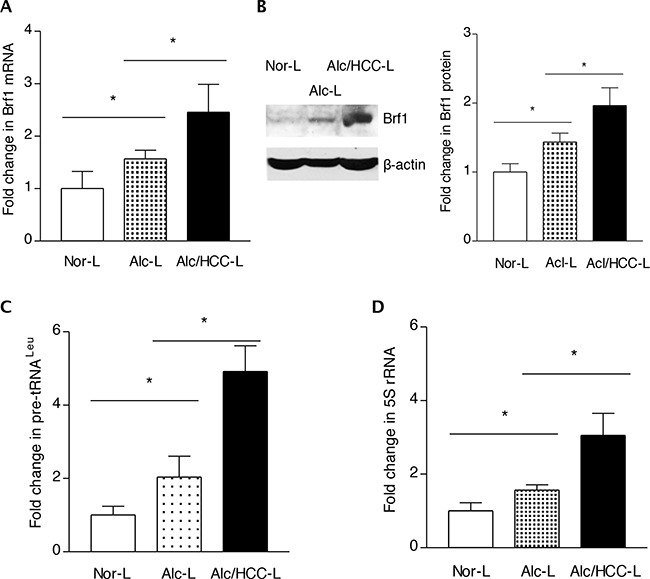
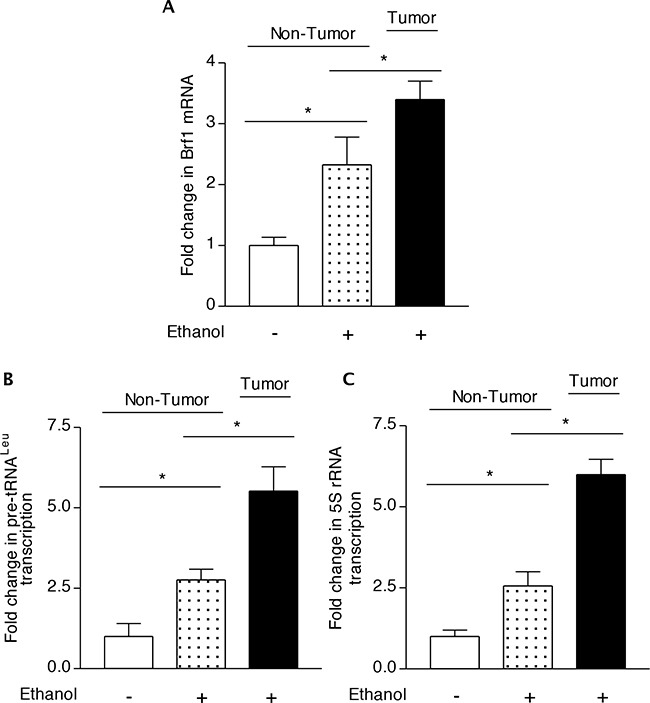
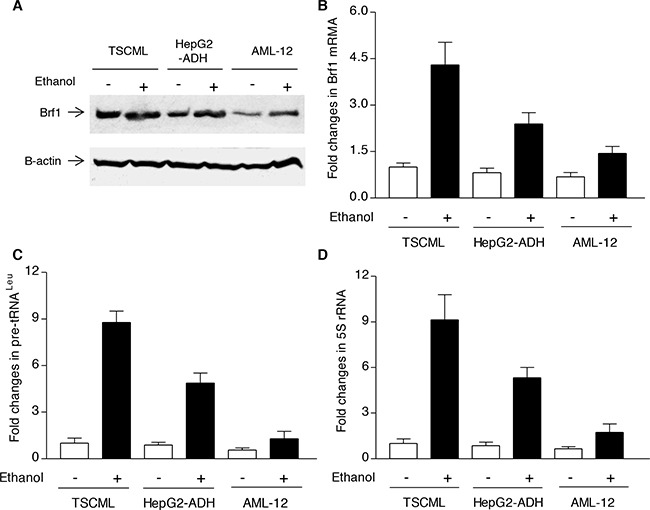
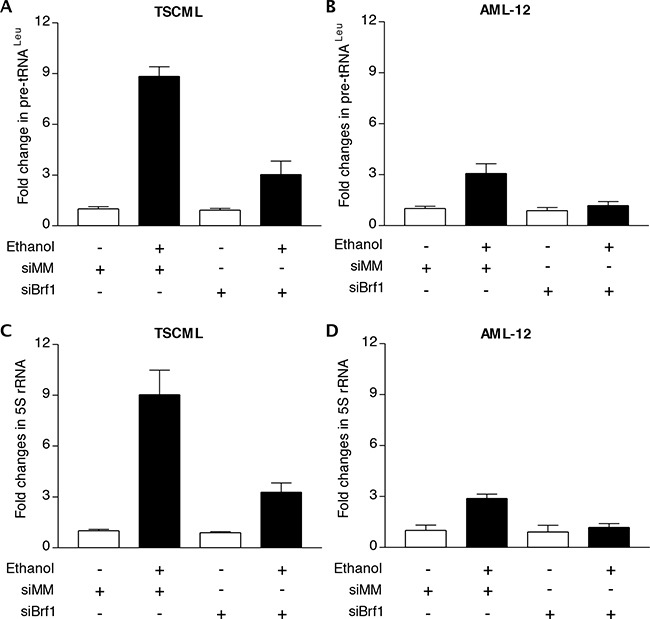
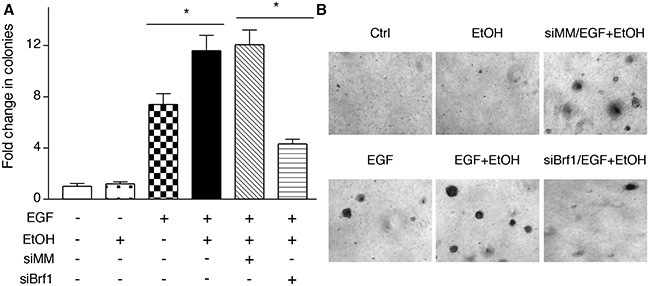
Brf1 (TFIIB-related factor 1) plays a crucial role in cell transformation and tumorigenesis. However, the significance of Brf1 expression in human HCC (hepatocellular carcinoma) cases remains to be addressed. In this study, biopsies of human HCC, liver tumor samples of mice and cell lines of normal and tumor liver were utilized to determine the alteration of Brf1 expression using cytological and molecular biological approaches. Brf1 expression is increased in human HCC cases, which is correlated with shorter survival times. Levels of Brf1 and Pol III (RNA polymerase III-dependent) gene transcription in HCC patients with alcohol consumption are higher than the cases of non-HCC with or without alcohol intake. Induction of Brf1 and Pol III genes by ethanol in hepatoma cells is higher than in non-tumor cells. Ethanol increases the rate of cell transformation. Repression of Brf1 inhibits alcohol-promoted cell transformation. Alcohol consumption enhances Brf1 expression to promote cell transformation. These studies demonstrate that Brf1 is a new biomarker of HCC.

Keywords: Brf1; Pol III genes; alcohol; hepatocellular carcinoma; survival.


Conflict of interest statement

CONFLICTS OF INTEREST

The authors who have taken part in this study declared that they do not have anything to disclose regarding funding or conflict of interest with respect to this manuscript.

Figures

Figure 1
Figure 1. Immunohistochemistry (IHC) staining of Brf1 in human HCC
A. Brf1 staining. (A1) IHC staining of Brf1 in HCC; (A2) H&E staining of HCC liver tissue; (A3) IHC staining of Brf1 in cancer foci of HCC; (A4) IHC staining of Brf1 in the para-Ca tissue of HCC. (A1 & A2) 200 X magnification; (A3 & A4) 400 X magnification. A representative staining of Brf1 in HCC. B. Weak and strong staining of Brf1 (B1 & B3) are low expression of Brf1 in HCC; (B2 & B4) are high expression of Brf1. (B1 & B2) 40 x magnification; (B3 & B4) 200 x magnification.
Figure 2
Figure 2. Kaplan-Meier survival curve and log-rank test analysis of the association between Brf1 expression and HCC patient survival
A. Brf1 expression of 133 HCC cases wasdetermined by pathological analysis and immunohistochemistry staining. n = number of patients in the subgroup, M = median survival in months of the subgroup.
Figure 3
Figure 3. Expression of Brf1 and Pol III genes in HCC cases with alcohol consumption
The total RNA and tissue lysates were extracted from the human liver tissues of normal (Nor-L, n=6), alcohol consumption (Alc-L, n=8) and HCC cases with alcohol consumption (Alc/HCC-L, n=7). Immunoblot analysis was performed to determine cellular levels of Brf1 protein (right) and its quantify data (left) B. RT-qPCR was carried out to measure the amounts of Brf1 mRNA A. pre-tRNALeu C. 5S rRNA D. The transcription levels of the genes were calculated by normalizing to the amount of GAPDH mRNA. The fold change was normalized by Nor-L. The bars represent Mean ± SE of at least three independent determinations. *: p<0.05 as indicated.
Figure 4
Figure 4. Transcription of Brf1 and Pol III genes in chronic alcohol administration in mice
C57BL/6 transgenic mice harboring the HCV NS5A gene were fed with 3.5% ethanol in the Lieber-DeCarli liquid diet or control diet for 12 months. Liver tissues were harvested from these mice. RNA was extracted from the non-tumor or tumor portion of the livers and RT-qPCR was used to measure the amounts of Brf1 A. pre-tRNALeu B. 5S rRNA C. relative to GAPDH. The values represent means ± SE from three independent experiments. Each group of mice includes at least five mice. The fold change was calculated in each group by normalizing to the mice fed with control diet. *: p<0.05 as indicated.
Figure 5
Figure 5. Brf1 and Pol III gene expression in non-tumor and tumor liver cell lines
The cells of TSCML, HepG2-ADH and AML-12 cell lines were starved in DMEM-F12 for 4h. Cells were treated with or without 50 mM ethanol for another 1 h: The cell lysates were extracted from these cells to determine the levels of Brf1 protein by immunoblot analysis A. Total RNAs were extracted from these cells and RT-qPCR was performed to measure the amounts of Brf1 mRNA B. pre-tRNALeu C. and 5S rRNA D. The fold change was calculated by normalizing to the amount of GAPDH mRNA. The bars represent Mean ± SE of at least three independent determinations.
Figure 6
Figure 6. Repression of Brf1 decreases the induction of Pol III genes caused by alcohol
The cells of TSCML and AML-12 were transfected with mismatch RNA (mmRNA) or Brf1 siRNA for 48 h. The cells were treated as described in Figure 5. Total RNAs were extracted from these cells and RT-qPCR was performed to measure the amounts of pre-tRNALeu A, B. and 5S rRNA C, D. The fold change was calculated by normalizing to the amount of GAPDH mRNA. The bars represent Mean ± SE of at least three independent determinations.
Figure 7
Figure 7. Reducing the amounts of cellular Brf1 inhibits alcohol-increased the rate of cell transformation
AML-12 cells were poured in triplicate into 6-well plate with 0.35% agar containing 50 mM ethanol or PBS as control and grown in the medium with or without 50 mM ethanol and plus EGF (20ng/ml) for 4 weeks or longer. The cells were analyzed for colony formation in soft agar. Colonies were counted at 3-4 weeks after plating. Values are the means ± SE (n≥C3). *: p < 0.05 as indicated.

References

    1. Lieber C. Hepatic, metabolic, and nutritional disorders of alcoholism: from pathogenesis to therapy. Crit Rev Clin Lab Sci. 2000;37:551–584. - PubMed
    1. Seitz HK, Poschl G, Simanowski UA. Alcohol and cancer. Recent Dev Alcohol. 1998;14:67–95. - PubMed
    1. Seitz HK, Stickel F. Molecular mechanisms of alcohol-mediated carcinogenesis. Nat Rev Cancer. 2007;7:599–612. - PubMed
    1. Bagnardi V, Blangiardo M, La Vecchia C, Corrao G. A meta-analysis of alcohol drinking and cancer risk. Br J Cancer. 2001;85:1700–1705. - PMC - PubMed
    1. Yuan JM, Govindarajan S, Arakawa K, Yu MC. Synergism of alcohol, diabetes, and viral hepatitis on the risk of hepatocellular carcinoma in blacks and whites in the U.S. Cancer. 2004;101:1009–1017. - PubMed

Publication types

MeSH terms

Substances