. 2016 Apr 5;7(14):18558-72.
doi: 10.18632/oncotarget.6670.

Adenoviral targeting of malignant melanoma for fluorescence-guided surgery prevents recurrence in orthotopic nude-mouse models

Affiliations

Adenoviral targeting of malignant melanoma for fluorescence-guided surgery prevents recurrence in orthotopic nude-mouse models

Shuya Yano et al. Oncotarget. .

Abstract

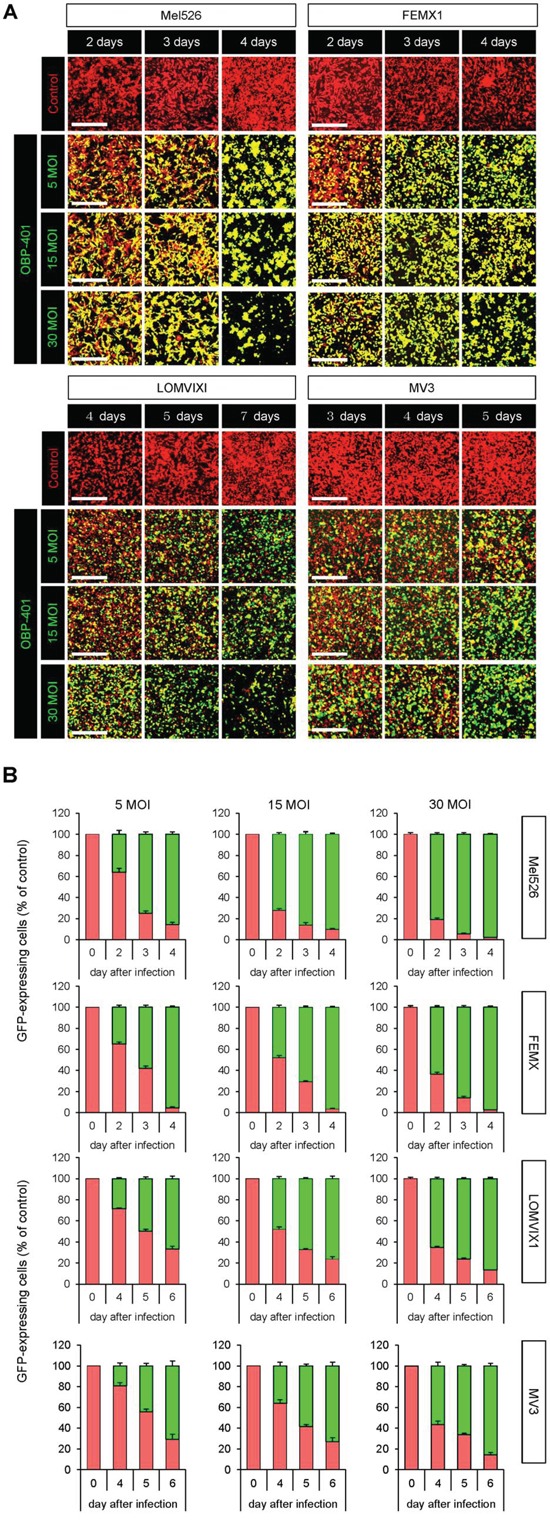
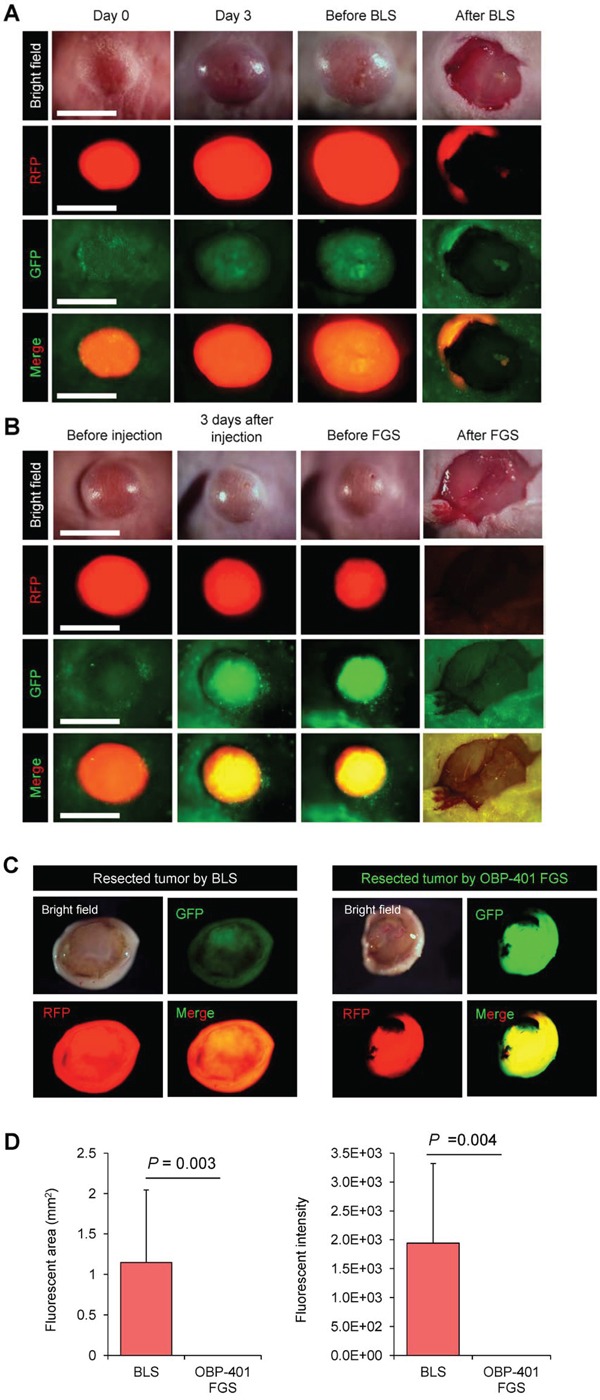
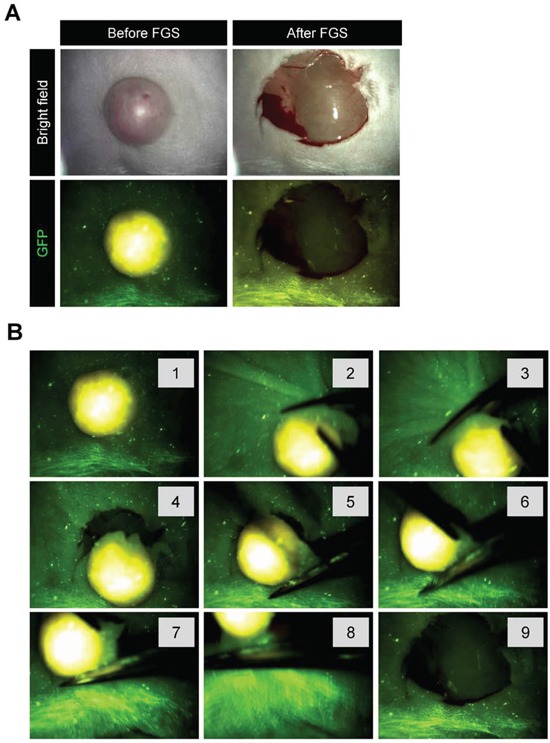
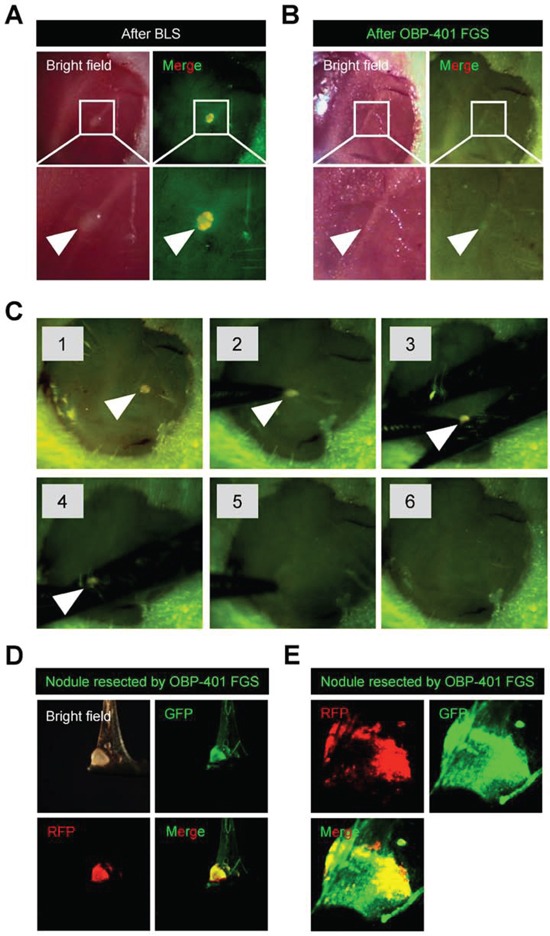
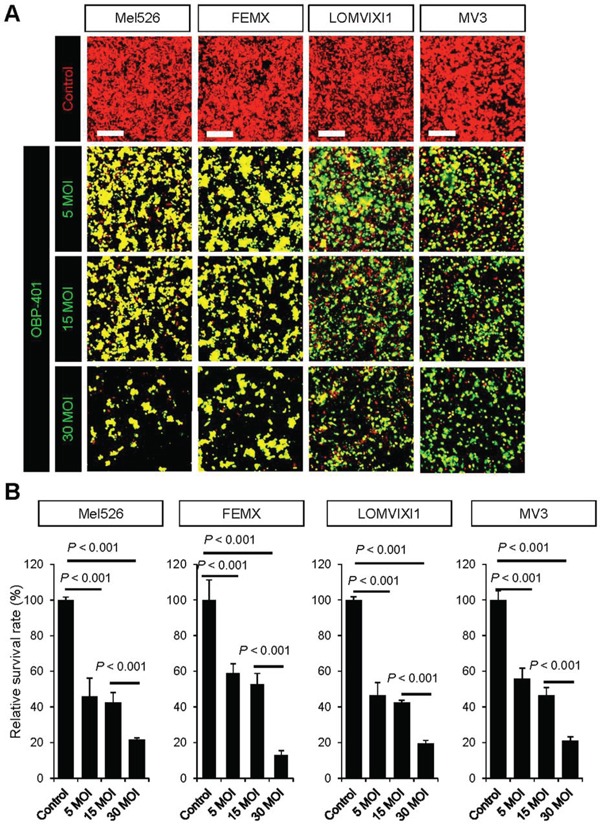
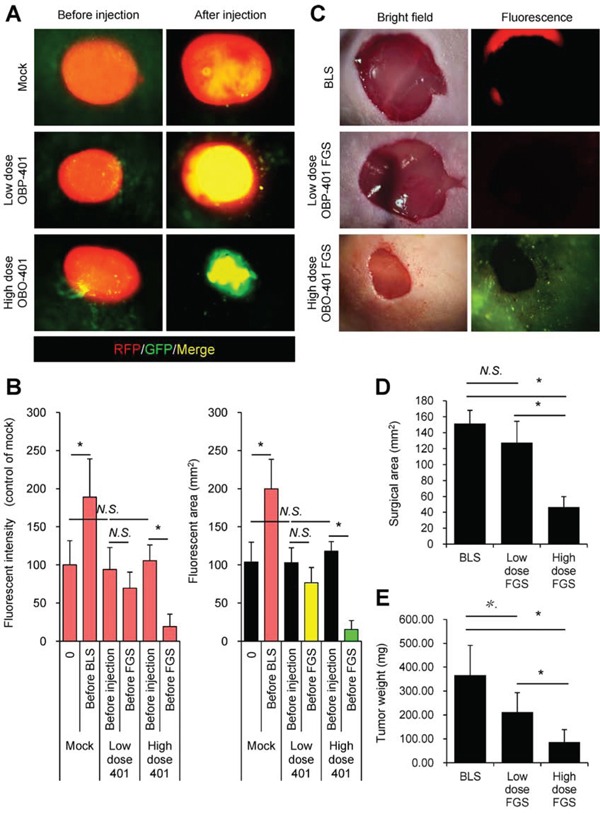
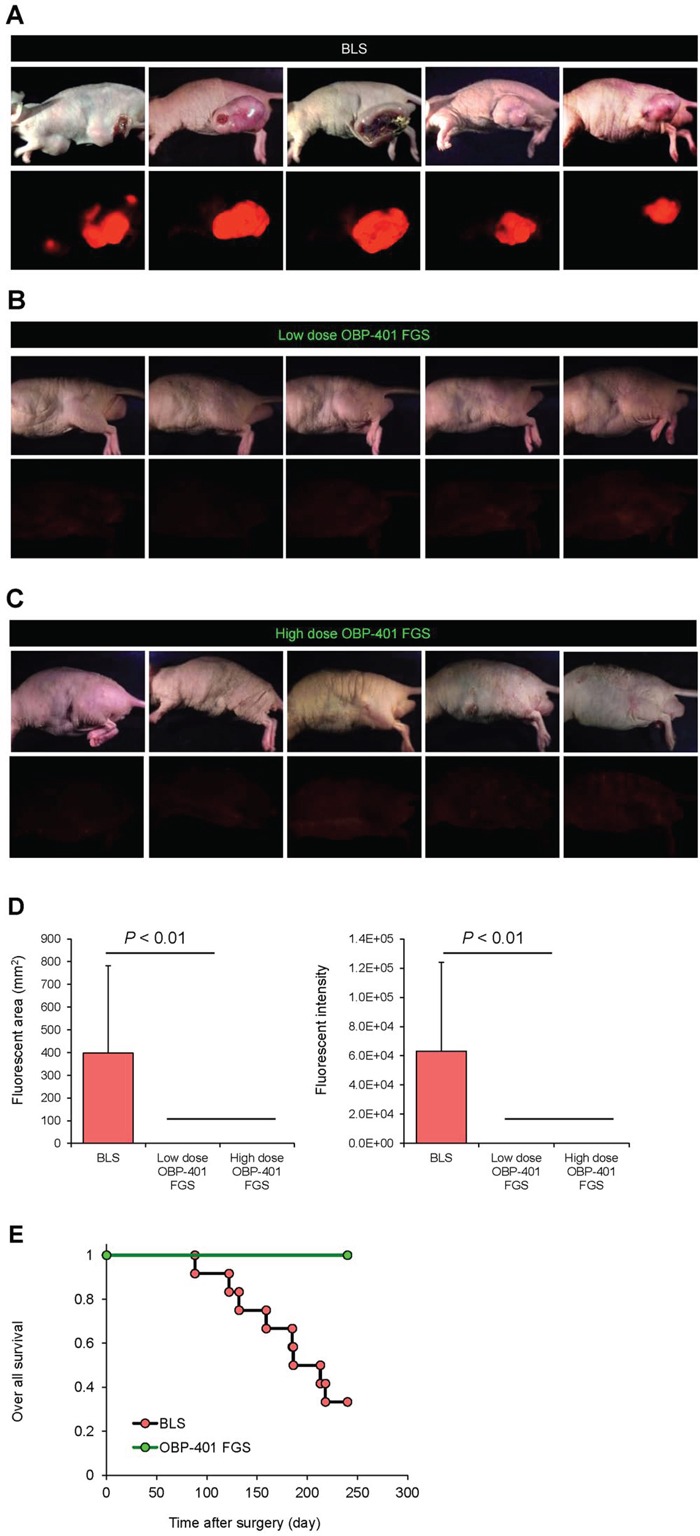
Malignant melanoma requires precise resection in order to avoid metastatic recurrence. We report here that the telomerase-dependent, green fluorescent protein (GFP)-containing adenovirus OBP-401 could label malignant melanoma with GFP in situ in orthotopic mouse models. OBP-401-based fluorescence-guided surgery (FGS) resulted in the complete resection of malignant melanoma in the orthotopic models, where conventional bright-light surgery (BLS) could not. High-dose administration of OBP-401 enabled FGS without residual cancer cells or recurrence, due to its dual effect of cancer-cell labeling with GFP and killing.

Keywords: OBP-401; adenovirus; fluorescence-guided surgery (FGS); melanoma; nude mice.


Conflict of interest statement

CONFLICTS OF INTEREST

Y. Urata is President & CEO of Oncolys BioPharma, Inc., the manufacturer of OBP-401. T. Fujiwara is a consultant of Oncolys BioPharma, Inc. S. Yano, K. Takehara, and R. M. Hoffman are or were unsalaried associates at AntiCancer, Inc.

Figures

Figure 1
Figure 1. OBP-401 targets human malignant melanoma cell lines with GFP in vitro
RFP-expressing human malignant melanoma cell lines, Mel526, FEMX1, LOMVIXI, MV3 were seeded on 6 well plates (1×10⁵ cells well). OBP-401 was added at the indicated multiple of infection (MOI) 24 hours after cell seeding. Images were acquired with an FV1000 confocal laser scanning microscope (Olympus). A. Time-course images of Mel526, FEMX1, LOMVIXI, MV3 cells 2, 3, and 4 days after infection with OBP-401, at indicated MOIs. B. Histograms show the frequency of GFP-expressing Mel526, FEMX1, LOMVIXI, MV3 cells at indicated days after infection with OBP-401. Data are shown as average ± SD. N = 5. Scale bars = 500 μm.
Figure 2
Figure 2. Comparison of OBP-401-targeted fluorescence-guided surgery with bright-light surgery for orthotopic malignant melanoma using a stationary imaging system
RFP-expressing FEMX1 cells (5×10⁶) in 20 μl Matrigel (BD) were inoculated in the femoral skin of nude mice (5 weeks old). OBP-401 (1×10⁸ PFU) was injected intratumorally when tumors reached approximately 100 mm3 (6 mm diameter). A. Representative whole-tumor images of mock-infected REP-expressing orthotopic melanoma before and after bright-light surgery (BLS). B. Representative whole-tumor images of OBP-401-GFP labeled, RFP-expressing orthotopic malignant melanoma before and after OBP-401-based fluorescence-guided surgery (OBP-401 FGS). C. Representative whole-tumor images of a tumor resected by BLS and a tumor resected by OBP-401 FGS using the OV100 whole body imaging system. D. Bar graph shows the comparison of fluorescent area in the surgical bed after BLS or OBP-401 FGS (left). Bar graph shows the comparison of fluorescence intensity in the surgical bed after BLS or OBP-401 FGS (right). Fluorescent area and fluorescence intensity are calculated with ImageJ software. Data are shown as average ± SD. N = 12. Scale bars = 1 cm.
Figure 3
Figure 3. OBP-401 based FGS of melanoma using the Dino-Lite hand-held portable fluorescence scope
A. Representative whole tumor images of OBP-401-GFP labeled, RFP-expressing orthotopic malignant melanoma before and after OBP-401-FGS using the Dino-Lite hand-held fluorescence scope. B. Step-by-step procedure for OBP-401 based FGS of malignant melanoma using the Dino-Lite hand-held-fluorescence scope.
Figure 4
Figure 4. OBP-401 targeting visualizes residual malignant melanoma cells after BLS
A. Representative high-magnification images of the surgical bed of orthotopic malignant melanoma after BLS. B. OBP-401 targeting enabled visualization of residual tumor after BLS and results in complete resection. Representative high-magnification images of surgical bed after FGS of malignant melanoma. C. Step-by-step procedure of OBP-401 based FGS of residual malignant melanoma after BLS using the Dino-Lite hand-held fluorescence scope. D. Representative images of resected malignant melanoma nodule by FGS. Images were acquired with the OV100. E. Representative single-cell level images of resected malignant melanoma nodule after FGS. Images were acquired with the FV1000 confocal microscope.
Figure 5
Figure 5. OBP-401 kills human malignant melanoma cell lines in vitro
A. Representative images of RFP-expressing human malignant melanoma cell lines, Mel526-RFP, FEMX1-RFP, LOMVIXI-RFP, and MV3-RFP, 7 days after targeting with OBP-401 at a MOI of 5, 15, and 30. B. Bar graphs show the surviving fraction of Mel526-RFP, FEMX1-RFP, LOMVIXI-RFP, and MV3-RFP cells 7 days after targeting with OBP-401 in vitro. The number of live cells was counted. Data are shown as average ± SD. N = 5. Scale bars = 250 μm.
Figure 6
Figure 6. OBP-401 enables minimal precise surgery for orthotopic melanoma
A. Representative whole-tumor images of orthotopic malignant melanoma before and after mock-infection or before and after i.t. administration of low-dose OBP-401 (1×10⁸ PFU) or high-dose OBP-401 (at 3×10⁸ PFU). B. Bar graphs show the fluorescence intensity of a control tumor and low-dose or high-dose OBP-401-targeted tumors (left). Fluorescent area is calculated with ImageJ software. Bar graphs show the fluorescence area of control tumor and low-dose or high-dose OBP-401-targeted tumors (right). Fluorescence intensity is calculated with ImageJ software. Data are shown as average ± SD. N = 10. C. Representative images of surgical area after BLS (upper) and low-dose (middle) or high-dose OBP-401-FGS (lower). Bright field images (left panels) and fluorescence images (right panels). D. Bar graphs show the comparison of surgical area after BLS, low-dose FGS, or high doe FGS. E. Bar graphs show the comparison of tumor weight after BLS, low-dose FGS, or high-dose FGS. Data are shown as average ± SD. N=10, *p<0.05.
Figure 7
Figure 7. OBP-401-based FGS prevents local recurrence
A. Representative whole-body images of orthotopic malignant melanoma 90 days after BLS. B. Representative whole body images of orthotopic malignant melanoma 90 days after low-dose OBP-401-FGS. C. Representative whole body images of orthotopic malignant melanoma 90 days after precise minimal FGS with high-dose administration of OBP-401. Upper panels in A, B, C: brightfield; lower panels: fluorescence. D. Comparison of fluorescent areas of recurrent tumors after BLS, low-dose OBP-401-FGS, or high-dose OBP-401-FGS (left panel). Fluorescent area is calculated with ImageJ software. Comparison of fluorescence intensity of recurrent tumors after BLS, low-dose OBP-401-FGS, or high-dose OBP-401-FGS (right panel). Fluorescence intensity is calculated with ImageJ software. Data are shown as average ± SD. N = 10. E. Kaplan-Meyer curves show the over-all survival after BLS or OBP-401-FGS.

Similar articles

Cited by

References

    1. Slominski AT, Carlson AJ. Melanoma resistance: bright future for academicians and challenge for patient advocates. Mayo Clin Proc. 2014;89:429–433. - PMC - PubMed
    1. Hoffman RM. The multiple uses of fluorescent proteins to visualize cancer in vivo. Nature Reviews Cancer. 2005;5:796–806. - PubMed
    1. Hoffman RM, Yang M. Subcellular imaging in the live mouse. Nature Protocols. 2006;1:775–782. - PubMed
    1. Kishimoto H, Zhao M, Hayashi K, Urata Y, Tanaka N, Fujiwara T, Penman S, Hoffman RM. In vivo internal tumor illumination by telomerase-dependent adenoviral GFP for precise surgical navigation. Proc Natl Acad Sci USA. 2009;106:14514–14517. - PMC - PubMed
    1. Kishimoto H, Aki R, Urata Y, Bouvet M, Momiyama M, Tanaka N, Fujiwara T, Hoffman RM. Tumor-selective adenoviral-mediated GFP genetic labeling of human cancer in the live mouse reports future recurrence after resection. Cell Cycle. 2011;10:2737–2741. - PMC - PubMed

Publication types