. 2015 Dec;5(12):150209.
doi: 10.1098/rsob.150209.

Over-expression of Plk4 induces centrosome amplification, loss of primary cilia and associated tissue hyperplasia in the mouse

Affiliations

Over-expression of Plk4 induces centrosome amplification, loss of primary cilia and associated tissue hyperplasia in the mouse

Paula A Coelho et al. Open Biol. 2015 Dec.

Abstract

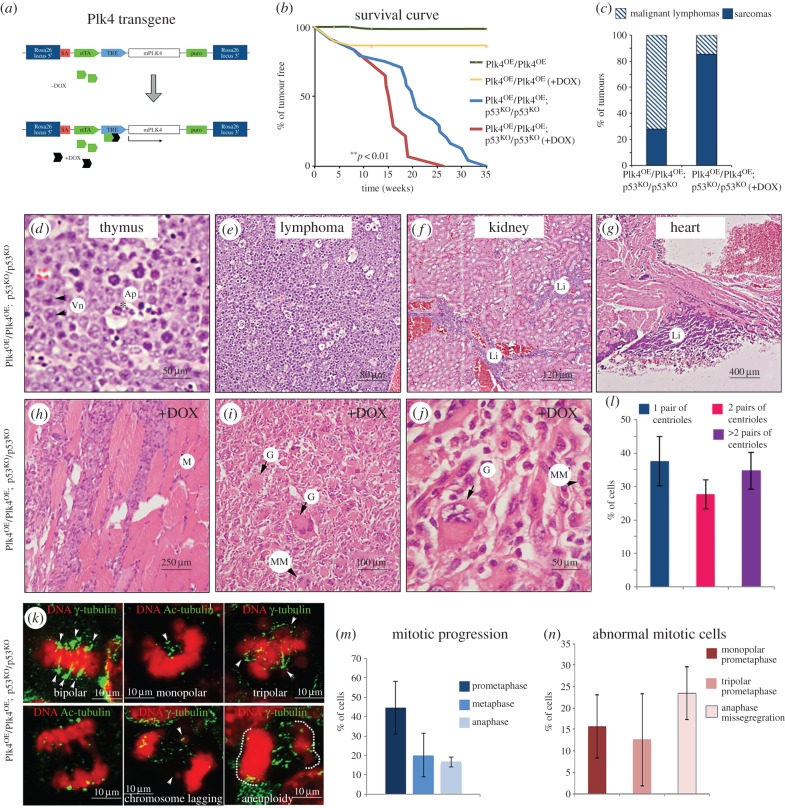
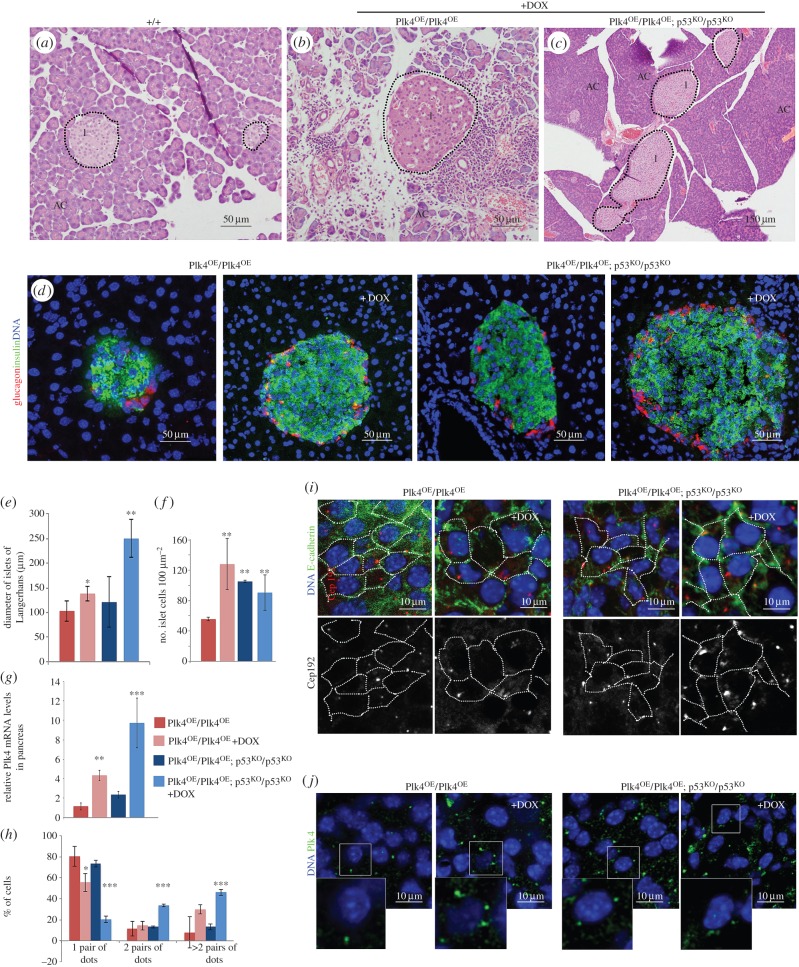
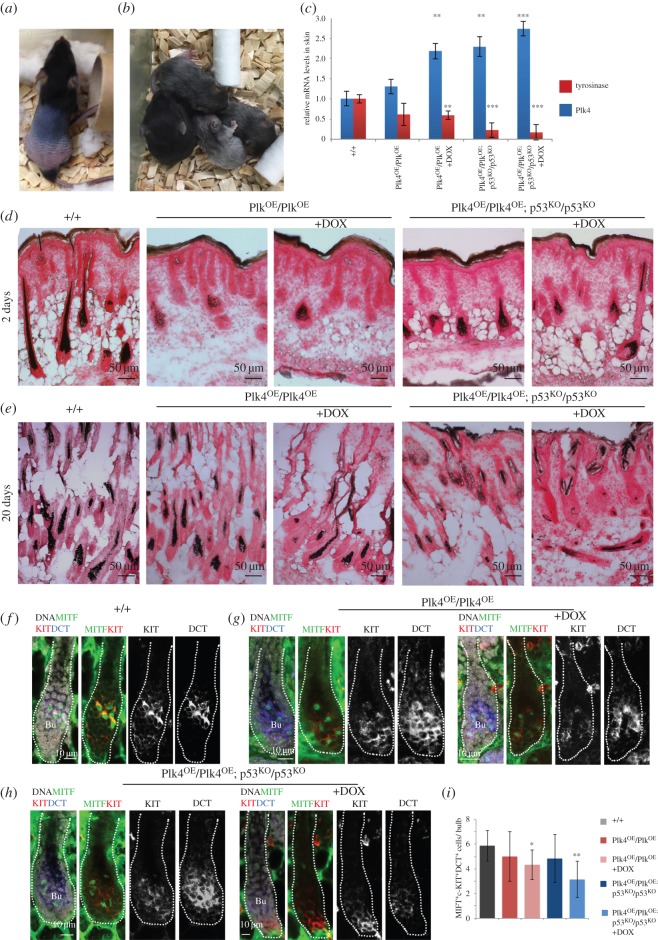
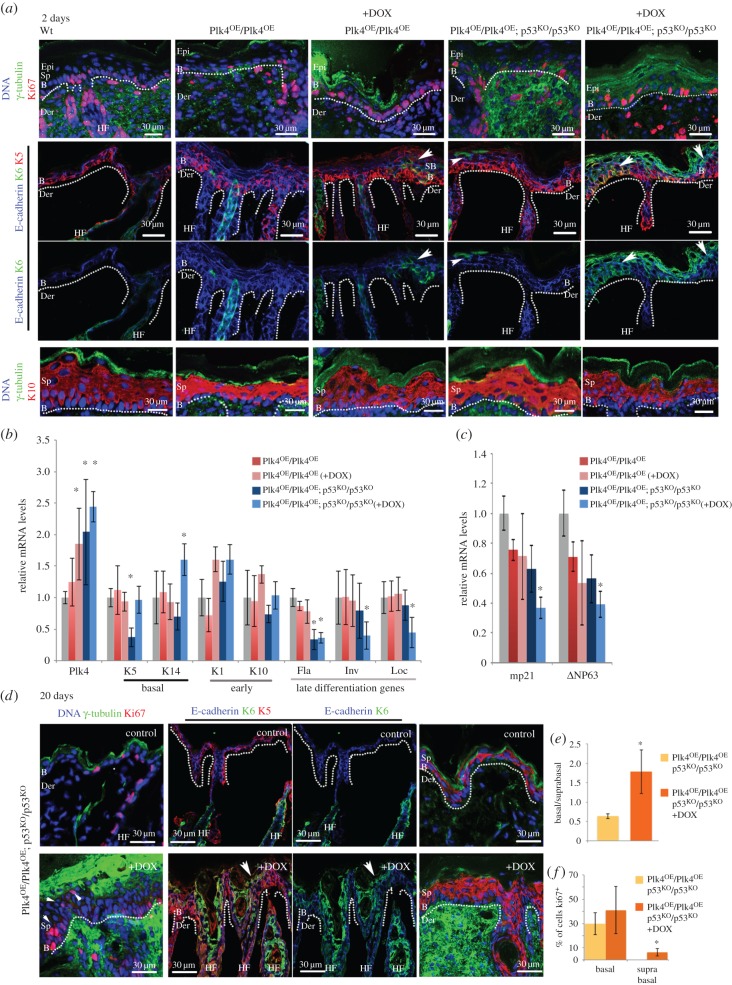
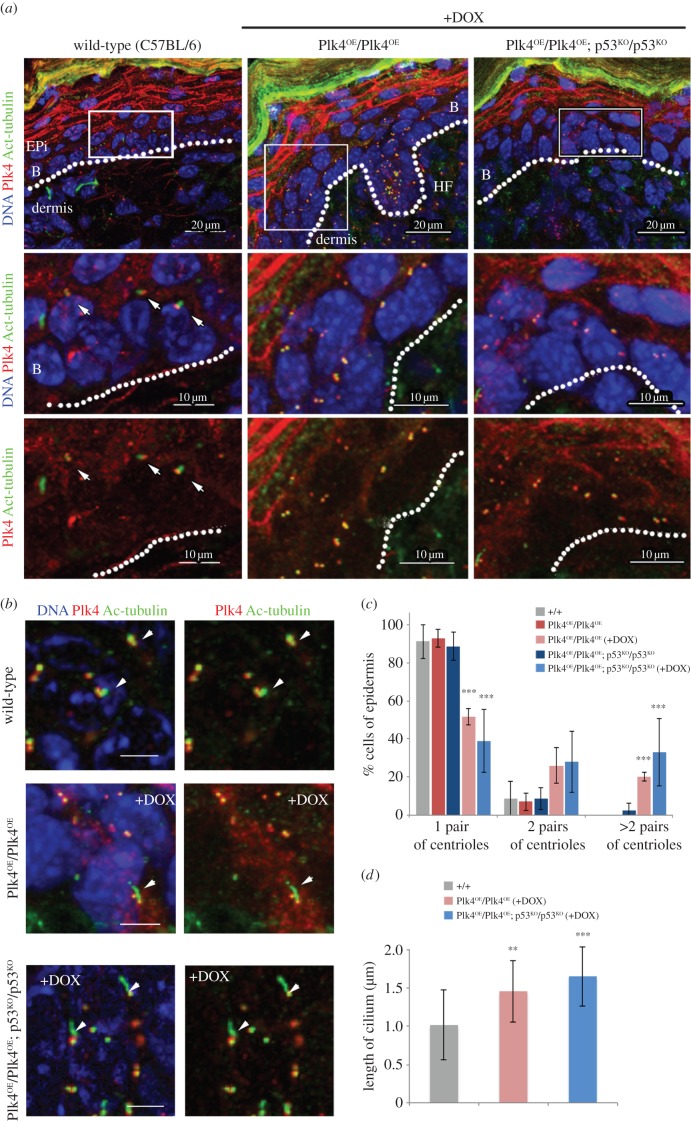
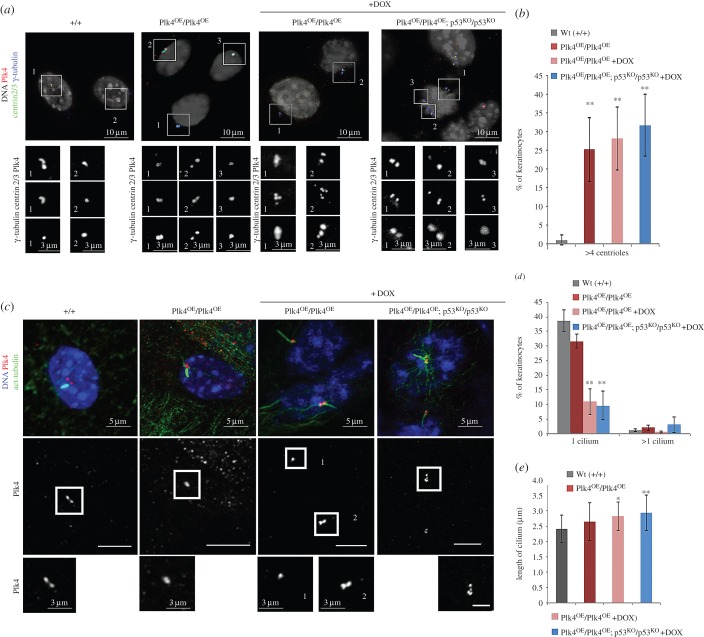
To address the long-known relationship between supernumerary centrosomes and cancer, we have generated a transgenic mouse that permits inducible expression of the master regulator of centriole duplication, Polo-like-kinase-4 (Plk4). Over-expression of Plk4 from this transgene advances the onset of tumour formation that occurs in the absence of the tumour suppressor p53. Plk4 over-expression also leads to hyperproliferation of cells in the pancreas and skin that is enhanced in a p53 null background. Pancreatic islets become enlarged following Plk4 over-expression as a result of equal expansion of α- and β-cells, which exhibit centrosome amplification. Mice overexpressing Plk4 develop grey hair due to a loss of differentiated melanocytes and bald patches of skin associated with a thickening of the epidermis. This reflects an increase in proliferating cells expressing keratin 5 in the basal epidermal layer and the expansion of these cells into suprabasal layers. Such cells also express keratin 6, a marker for hyperplasia. This is paralleled by a decreased expression of later differentiation markers, involucrin, filaggrin and loricrin. Proliferating cells showed an increase in centrosome number and a loss of primary cilia, events that were mirrored in primary cultures of keratinocytes established from these animals. We discuss how repeated duplication of centrioles appears to prevent the formation of basal bodies leading to loss of primary cilia, disruption of signalling and thereby aberrant differentiation of cells within the epidermis. The absence of p53 permits cells with increased centrosomes to continue dividing, thus setting up a neoplastic state of error prone mitoses, a prerequisite for cancer development.

Keywords: Polo-like-kinase-4; centrosome amplification; pancreas; primary cilia; skin; tumour development.


Figures

Figure 1.
Figure 1.
Tumour formation following tetracycline-inducible conditional Plk4 expression. (a) Doxycycline associates with the rtTA that binds the TRE, leading to transcriptional activation of Plk4. (b) Tumour incidence in Plk4 transgenic mice in wild-type background (Plk4OE/Plk4OE) or p53 null background (Plk4OE/Plk4OE; p53KO/p53KO) with or without treatment with doxycycline (+DOX) to promote Plk4 over-expression. The differences observed between Plk4OE/Plk4OE; p53KO/p53KO (n = 24) and Plk4OE/Plk4OE; p53KO/p53KO +DOX (n = 14) survival curves are significant (**p < 0.01; Student's t-test). (c) Proportions of sarcomas and lymphomas. Note that animals that developed sarcomas also showed lymphomas. (d) Architecture of thymus and lymph nodes is obliterated and replaced by sheets of large, round cells with vesicular nuclei (Vn, black arrows). Apoptotic cells were also present (Ap, black asterisk). (e) Multicentric high-grade large cell lymphoma. (f) Kidney has normal architecture but contains multifocal cortical interstitial and sub-capsular infiltrates of large lymphocytes (Li). (g) Large sheets of lymphocytes (Li) attached to pericardial surface of heart wall. (hj) These tumours are sarcomas isolated from Plk4OE/Plk4OE; p53KO/p53KO mice. Typically, large masses of cells extended into muscle fibre bundles (M) and into attached adipose surrounding nerves and blood vessels. (i,j) Higher magnifications of sarcomas showing pleomorphic and anaplastic cells. Examples of giant (G) or multinucleated (MM) cells are indicated. These tumours were found close to the front limbs with high percentage of mitotic cells (an average of 5–10/40× field). (k) Paraffin section of samples from sarcomas where stained to reveal γ-tubulin or acetylated-tubulin (green). DNA is shown in red. Three different samples were analysed and showed a high mitotic index (8.55 ± 2.53%, n = 1400 cells/sample) in agreement with histological analysis made after H&E staining. (l) Proportion of cells that show one pair or two pairs of centrioles per cell or show centriole/centrosome amplification (more than 2 pairs of centrioles). (m) Mitotic progression in sarcomas from cryostat sections. (n) Proportions of mitotic abnormalities in sarcomas. Quantification in (ln) performed in three different sarcomas; 500–1000 cells analysed per sarcoma.
Figure 2.
Figure 2.
Plk4 over-expression leads to hyperplasia of the pancreatic islets. (ac) Haematoxylin–eosin-stained sections of mouse pancreas. (a) Control (+/+) pancreas shows normal acinar cells (AC), islets of Langerhans (I) and lobular architecture. (b) Pancreas of Plk4OE/Plk4OE (+DOX) male has normal lobular architecture, intact acinar cell clusters within lobes and islets of variable size. Lymphocytes are seen surrounding islets and between clusters of acinar cells (black arrows). (c) Pancreas from a Plk4OE/Plk4OE; p53KO/p53KO male showing normal lobular architecture and very large islets. (d) Immunofluorescence of pancreas cryosections showing β-cells detected by anti-insulin (red) and α-cells detected by anti-glucagon (green) in islets. DNA is blue. (e) Diameter of islets (mean ± s.d., n = 12) in mice of indicated genotypes without or with (+DOX) doxycycline treatment. (f) Density of insulin or glucagon-positive cells (mean ± s.d., n = 12) in islets of indicated genotypes without and with doxycline (+DOX) treatment. (g) Q-RT-PCR analysis of relative levels of Plk4 transcripts in pancreatic extracts of indicated genotypes without or with (+DOX) doxycycline treatment. Average from three biological samples (three replicates for each). (h) Proportion of cells showing 1 (one pair of dots), 2 (two pairs of dots) centrosomes or centrosome amplification (more than two pairs of dots) in pancreatic islets. Centrosomes quantified by counting punctate Cep192 or γ-tubulin staining. (i) Pancreas cryosections stained to reveal E-cadherin (green), centrosome component Cep192 (red in merge; white in monochrome) and DNA (blue). Cell borders identified by E-cadherin outlined in monochrome image. Note: increase in the number of centrosomes/cell following treatment with doxycycline (+DOX). (j) Pancreas cryosections stained to reveal Plk4 (green) and DNA (blue). Note: increase in the number per cell and size of anti-Plk4-stained dots following treatment with doxycycline (+DOX). Significance was determined by Student's t-test. *p < 0.05, **p < 0.01, ***p < 0.005.
Figure 3.
Figure 3.
Plk4 over-expression leads to loss of hair and its pigmentation. (a) Plk4OE/Plk4OE; p53KO/p53KO mouse exhibiting typical hair loss phenotype. (b) Plk4OE/Plk4OE; p53KO/p53KO mice showing varying degrees of greying hair. (c) Q-RT-PCR analysis of Plk4 and tyrosinase transcripts in extracts of total back skin from mice of indicated genotypes and treatment indicating mean ± s.e. for three independent biological samples and three replicates/sample (+DOX indicates doxycycline treatment). (d) Fontana-Masson staining of cryosections of P2 back skin from mice of indicated genotypes. +DOX indicates treatment with doxycycline. (e) Fontana-Masson staining of P20 back skin cryosections from mice of indicated genotypes and treated with doxycycline where indicated (+DOX). (f) Anagen hair follicle in wild-type back skin immunostained to reveal melanocyte markers KIT (red in merge; white, monochrome), MITF (green) and DCT (blue in merge; white in monochrome). DNA is represented in white. Differentiated melanocytes identified by triple KIT+MITF+DCT+ staining. (g) P2 back skin from Plk4OE/Plk4OE mice without or with Plk4 over-expression (+DOX) showing anagen hair follicle immunostained to reveal melanocyte markers KIT (red in merge; white in monochrome), MITF (green) and DCT (blue in merge; white in monochrome). DNA is white in merge. Note reduction in differentiated melanocytes identified by triple KIT+MITF+DCT+-positive immunostaining. (h) P2 back skin from Plk4OE/Plk4OE; p53KO/p53KO mice without or with Plk4 over-expression (+DOX) showing hair follicles immunostained for melanocyte markers KIT (red in merge; white in monochrome), MITF (green) and DCT (blue in merge; white in monochrome). DNA is white in merge. Differentiated melanocytes (KIT+MITF+DCT+) are reduced in Plk4OE/Plk4OE; p53KO/p53KO (+DOX) mice. (i) Mean numbers ± s.d. of differentiated melanocytes (KIT+MITF+DCT+) per bulb in indicated genotypes and treatments. Significance determined by Student's t-test. *p < 0.05, **p < 0.01 and ***p < 0.005.
Figure 4.
Figure 4.
Plk4 over-expression leads to hyperproliferation and abnormal differentiation of cells in suprabasal layers. (a) Immunofluorescence of cryosections of P2 back skin from mice of indicated genotypes treated with doxycycline as indicated (+DOX). Note: Ki67 reveals proliferating cells in basal and suprabasal (white asterisk) epidermal layers of Plk4OE/Plk4OE; p53KO/p53KO (+DOX) mice; K6, restricted to hair follicles in controls, is present in epidermis following Plk4 induction (arrowheads). Basal layer marker K5 present throughout epidermis following Plk4 induction; distribution of early differentiation marker, K10 not affected and does not reveal differences between the experimental samples and the control at this stage. B, basal; Der, dermis; Epi, epidermis; Sp, suprabasal; dotted lines, dermo-epidermal border. (b) Quantitative RT-PCR assays for levels of indicated transcripts in total back skin from 2 day pups of indicated genotypes and treatment (n = 3 and three replicates for each sample). Note: elevated Plk4 transcripts consistently correlate with low expression of late differentiation genes filaggrin (Fla), involucrin (Inv) and loricrin (Loc). (c) Quantitative RT-PCR assays as in (b) for P21 (mp21) and ΔNP63. (d) Immunofluorescence analysis of back skin from 20 day pups of indicated genotypes and treatment. Note: Ki67-positive cells in basal and suprabasal cells (arrowheads) and K6 in multiple layers co-localizing with K5 (white arrow) in Plk4OE/Plk4OE; p53KO/p53KO (+DOX) mice; expanded staining of K5 and K10. (e) Ratio of basal to suprabasal cells indicated as mean ± s.d. (f) Proportion of cycling cells in epidermis. Mean ± s.d. % of cells showing Ki67-positive immunostaining. Significance determined by Student's t-test. *p < 0.05.
Figure 5.
Figure 5.
Over-expression of Plk4 leads to multiple centrosomes and loss of primary cilia. (a) Immunostaining of back skin of P2 pups of indicated genotypes and treatment to reveal Plk4 (red), acetylated tubulin (green) and DNA (blue). Arrows indicate individual primary cilia (anti-acetylated tubulin) that are apically oriented in basal and suprabasal cells in wild-type control. Note: induction of Plk4 leads to extra centrioles and loss of primary cilia. (b) Immunostaining of hair follicles in mice of indicated genotypes and treatment. Note: primary cilia (arrowheads) are still observed in hair follicles after Plk4 induction although they appear longer than in control. (c) Quantification of centriole pairs in basal and superbasal layers. Mean ± s.d., n = 30–50 cells/condition. (d) Quantification of primary cilium length in samples illustrated in (b). Mean ± s.d., n = 30–50 cells per condition. Significance determined by Student's t-test. **p < 0.01, ***p < 0.005.
Figure 6.
Figure 6.
Over-expression of Plk4 leads to multiple centrosomes and loss of primary cilia in primary keratinocytes. (a) Primary culture of keratinocytes isolated from Wt, Plk4OE/Plk4OE and Plk4OE/Plk4OE; p53KO/p53KO dorsal skin under low calcium conditions. Plk4 over-expression promoted by addition of doxycycline (DOX). Immunostaining reveals Plk4 (red), centrin 2/3 (green) and γ-tubulin (blue). DNA stained with DAPI (white). Individual regions magnified in insets showing example of centriole over-duplication after Plk4 over-expression. (b) Quantitation of centrioles in three independent experiments. Mean values ± s.d.; more than 200 cells quantified for each condition. (c) In vitro, addition of Ca2+ induces primary cilia formation in control, Plk4OE/Plk4OE and Plk4OE/Plk4OE; p53KO/p53KO. In control and Plk4OE/Plk4OE, 38.70 ± 3.80% and 31.70 ± 2.38% of keratinocytes, respectively, formed a primary cilium after higher Ca2+ conditions. If Plk4 is over-expressed, the percentage of keratinocytes showing primary cilia is reduced to 1/3 in Plk4OE/Plk4OE compared to controls (11.00 ± 4.38%). Similar results were obtained in Plk4OE/Plk4OE; p53KO/p53KO over-expressing Plk4 (9.66 ± 4.87%). (d) Quantitation of percentage of keratinocytes exhibiting one or more primary cilia under indicated conditions. (e) Quantitation of primary cilium length under indicated conditions. Significance evaluated by Student's t-test and compared to wild-type (*p < 0.05 and **p < 0.01).

References

    1. Scheer U. 2014. Historical roots of centrosome research: discovery of Boveri's microscope slides in Würzburg. Phil. Trans. R. Soc. B 369, 20130469 (doi:10.1098/rstb.2013.0469) - DOI - PMC - PubMed
    1. Krämer A, Neben K, Ho AD. 2005. Centrosome aberrations in hematological malignancies. Cell Biol. Int. 29, 375–383. (doi:10.1016/j.cellbi.2005.03.004) - DOI - PubMed
    1. Lingle WL, Lutz WH, Ingle JN, Maihle NJ, Salisbury JL. 1998. Centrosome hypertrophy in human breast tumors: Implications for genomic stability and cell polarity. Proc. Natl Acad. Sci. USA 95, 2950–2955. (doi:10.1073/pnas.95.6.2950) - DOI - PMC - PubMed
    1. Pihan GA, Purohit A, Wallace J, Knecht H, Woda B, Quesenberry P, Doxsey SJ. 1998. Centrosome defects and genetic instability in malignant tumors. Cancer Res. 58, 3974–3985. - PubMed
    1. Hsu L-C, Kapali M, DeLoia JA, Gallion HH. 2005. Centrosome abnormalities in ovarian cancer. Int. J. Cancer 113, 746–751. (doi:10.1002/ijc.20633) - DOI - PubMed

Publication types