

Eliminating medullary 5-HT neurons delays arousal and decreases the respiratory response to repeated episodes of hypoxia in neonatal rat pups
- PMID: 26702023
- PMCID: PMC4773643
- DOI: 10.1152/japplphysiol.00560.2014
Eliminating medullary 5-HT neurons delays arousal and decreases the respiratory response to repeated episodes of hypoxia in neonatal rat pups
Abstract
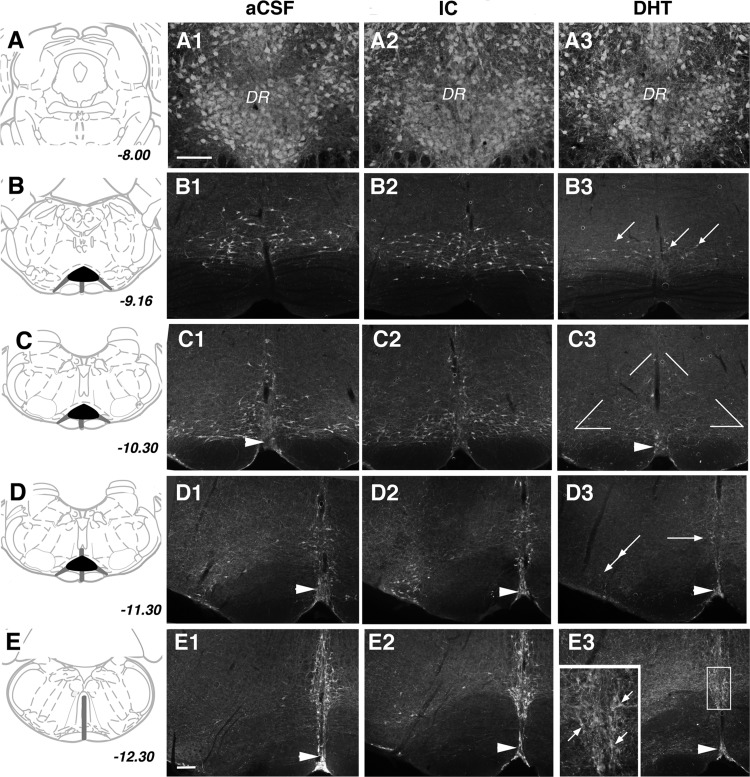
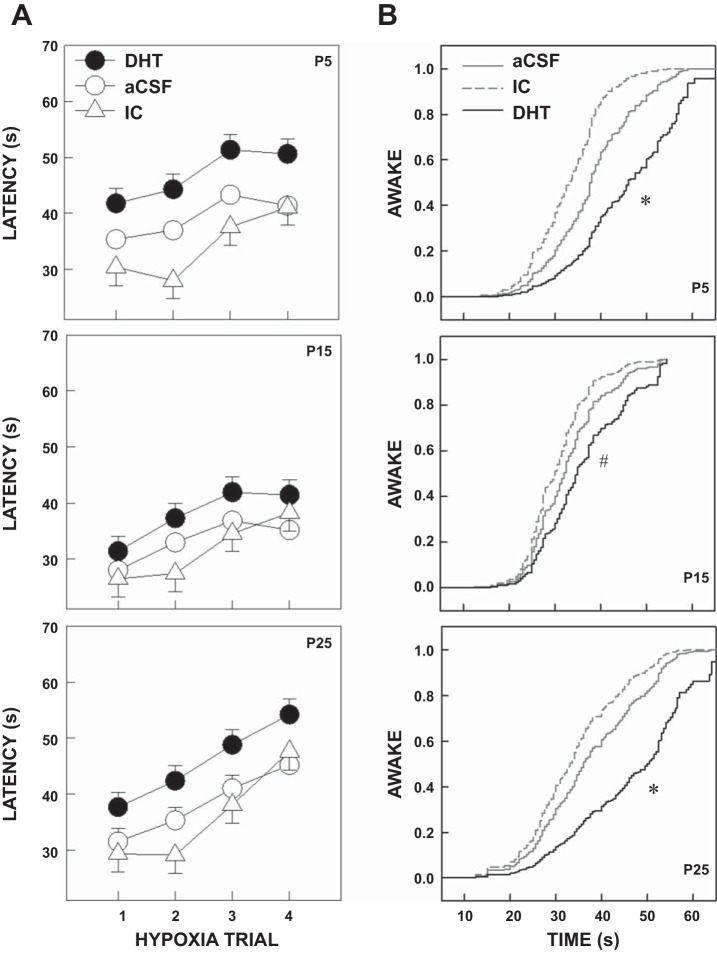
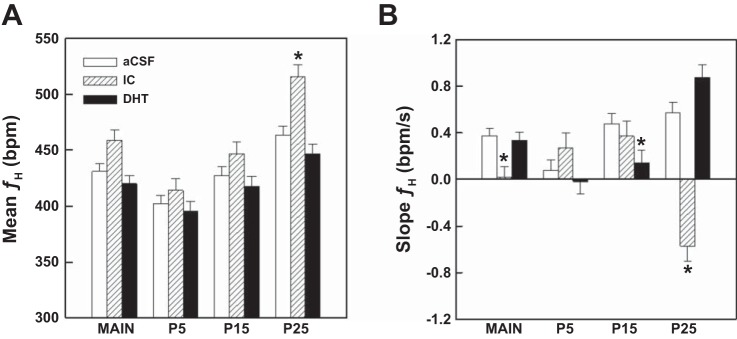
Arousal from sleep is a critical defense mechanism when infants are exposed to hypoxia, and an arousal deficit has been postulated as contributing to the etiology of the sudden infant death syndrome (SIDS). The brainstems of SIDS infants are deficient in serotonin (5-HT) and tryptophan hydroxylase (TPH) and have decreased binding to 5-HT receptors. This study explores a possible connection between medullary 5-HT neuronal activity and arousal from sleep in response to hypoxia. Medullary raphe 5-HT neurons were eliminated from neonatal rat pups with intracisterna magna (CM) injections of 5,7-dihydroxytryptamine (DHT) at P2-P3. Each pup was then exposed to four episodes of hypoxia during sleep at three developmental ages (P5, P15, and P25) to produce an arousal response. Arousal, heart rate, and respiratory rate responses of DHT-injected pups were compared with pups that received CM artificial cerebrospinal fluid (aCSF) and those that received DHT but did not have a significant reduction in medullary 5-HT neurons. During each hypoxia exposure, the time to arousal from the onset of hypoxia (latency) was measured together with continuous measurements of heart and respiratory rates, oxyhemoglobin saturation, and chamber oxygen concentration. DHT-injected pups with significant losses of medullary 5-HT neurons exhibited significantly longer arousal latencies and decreased respiratory rate responses to hypoxia compared with controls. These results support the hypothesis that in newborn and young rat pups, 5-HT neurons located in the medullary raphe contribute to the arousal response to hypoxia. Thus alterations medullary 5-HT mechanisms might contribute to an arousal deficit and contribute to death in SIDS infants.
Keywords: arousal; medulla; response to hypoxia; rodent development; serotonin.
Copyright © 2016 the American Physiological Society.
Figures


Similar articles
-
Arousal from sleep in response to intermittent hypoxia in rat pups is modulated by medullary raphe GABAergic mechanisms.Am J Physiol Regul Integr Comp Physiol. 2012 Mar 1;302(5):R551-60. doi: 10.1152/ajpregu.00506.2011. Epub 2011 Dec 7. Am J Physiol Regul Integr Comp Physiol. 2012. PMID: 22160541 Free PMC article.
-
Active sleep unmasks apnea and delayed arousal in infant rat pups lacking central serotonin.J Appl Physiol (1985). 2017 Oct 1;123(4):825-834. doi: 10.1152/japplphysiol.00439.2017. Epub 2017 Aug 3. J Appl Physiol (1985). 2017. PMID: 28775068 Free PMC article.
-
Decreased serotonergic receptor binding in rhombic lip-derived regions of the medulla oblongata in the sudden infant death syndrome.J Neuropathol Exp Neurol. 2000 May;59(5):377-84. doi: 10.1093/jnen/59.5.377. J Neuropathol Exp Neurol. 2000. PMID: 10888367
-
The serotonergic anatomy of the developing human medulla oblongata: implications for pediatric disorders of homeostasis.J Chem Neuroanat. 2011 Jul;41(4):182-99. doi: 10.1016/j.jchemneu.2011.05.004. Epub 2011 May 27. J Chem Neuroanat. 2011. PMID: 21640183 Free PMC article. Review.
-
Medullary serotonergic network deficiency in the sudden infant death syndrome: review of a 15-year study of a single dataset.J Neuropathol Exp Neurol. 2001 Mar;60(3):228-47. doi: 10.1093/jnen/60.3.228. J Neuropathol Exp Neurol. 2001. PMID: 11245208 Review.
Cited by
-
Altered 5-HT2A/C receptor binding in the medulla oblongata in the sudden infant death syndrome (SIDS): Part II. Age-associated alterations in serotonin receptor binding profiles within medullary nuclei supporting cardiorespiratory homeostasis.J Neuropathol Exp Neurol. 2024 Feb 21;83(3):144-160. doi: 10.1093/jnen/nlae004. J Neuropathol Exp Neurol. 2024. PMID: 38323418 Free PMC article.
-
Influence of Sensory Needs on Sleep and Neurodevelopmental Care in At-Risk Neonates.Children (Basel). 2025 Jun 16;12(6):781. doi: 10.3390/children12060781. Children (Basel). 2025. PMID: 40564739 Free PMC article. Review.
-
Intensity of Respiratory Cortical Arousals Is a Distinct Pathophysiologic Feature and Is Associated with Disease Severity in Obstructive Sleep Apnea Patients.Brain Sci. 2021 Feb 25;11(3):282. doi: 10.3390/brainsci11030282. Brain Sci. 2021. PMID: 33668974 Free PMC article.
-
Role of raphe magnus 5-HT1A receptor in increased ventilatory responses induced by intermittent hypoxia in rats.Respir Res. 2022 Mar 3;23(1):42. doi: 10.1186/s12931-022-01970-6. Respir Res. 2022. PMID: 35241072 Free PMC article.
-
Altered 5-HT2A/C receptor binding in the medulla oblongata in the sudden infant death syndrome (SIDS): Part I. Tissue-based evidence for serotonin receptor signaling abnormalities in cardiorespiratory- and arousal-related circuits.J Neuropathol Exp Neurol. 2023 May 25;82(6):467-482. doi: 10.1093/jnen/nlad030. J Neuropathol Exp Neurol. 2023. PMID: 37226597 Free PMC article.
References
-
- Anderson GW, Schoonover CM, Jones SA. Control of thyroid hormone action in the developing rat brain. Thyroid 13: 1039–1046, 2003. - PubMed
-
- Bayer SA, Altman J, Russo RJ, Zhang X. Timetables of neurogenesis in the human brain based on experimentally determined patterns in the rat. Neurotoxicology 14: 83–144, 1993. - PubMed
-
- Berry RB, Gleeson K. Respiratory arousal from sleep: mechanisms and significance. Sleep 20: 654–675, 1997. - PubMed
-
- Bjorklund A, Baumgarten HG, Lachenmayer L, Rosengren E. Recovery of brain noradrenaline after 5,7-dihydroxytryptamine-induced axonal lesions in the rat. Cell Tissue Res 161: 145–155, 1975. - PubMed
Publication types
MeSH terms
Substances
Grants and funding
LinkOut - more resources
Full Text Sources
Other Literature Sources
Miscellaneous