. 2016 Feb 19;291(8):4197-210.
doi: 10.1074/jbc.M115.700278. Epub 2015 Dec 23.

Functional and Structural Divergence in Human TRPV1 Channel Subunits by Oxidative Cysteine Modification

Affiliations

Functional and Structural Divergence in Human TRPV1 Channel Subunits by Oxidative Cysteine Modification

Nozomi Ogawa et al. J Biol Chem. .

Abstract

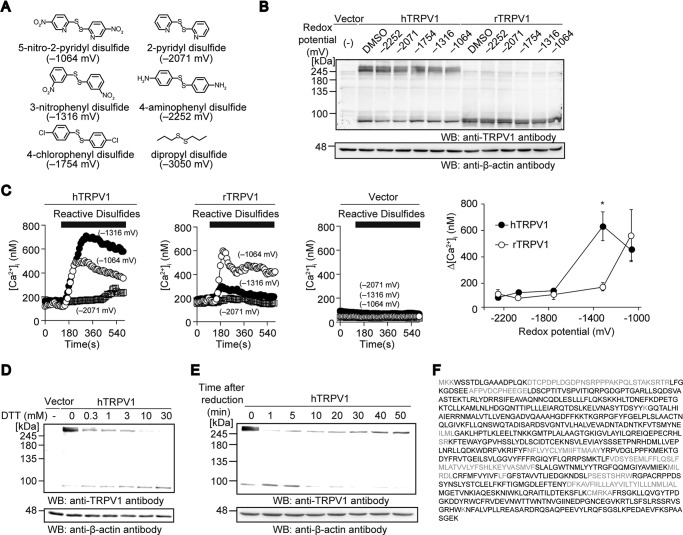
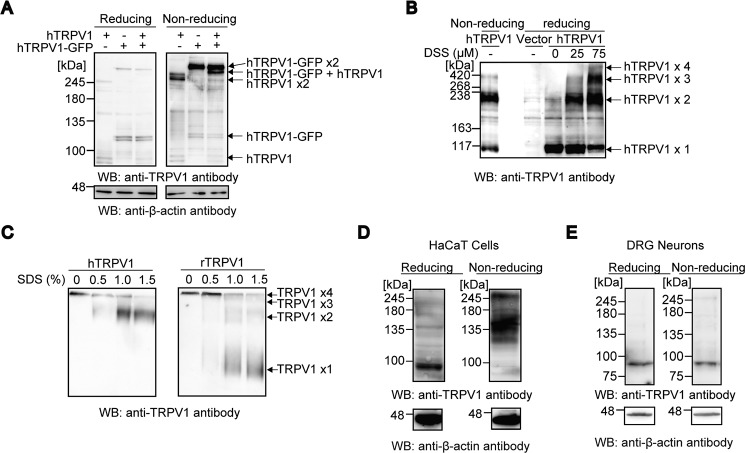
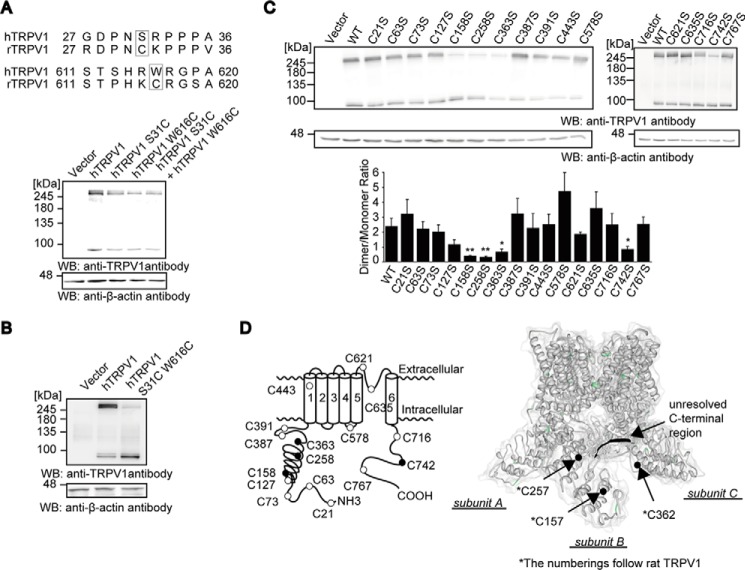
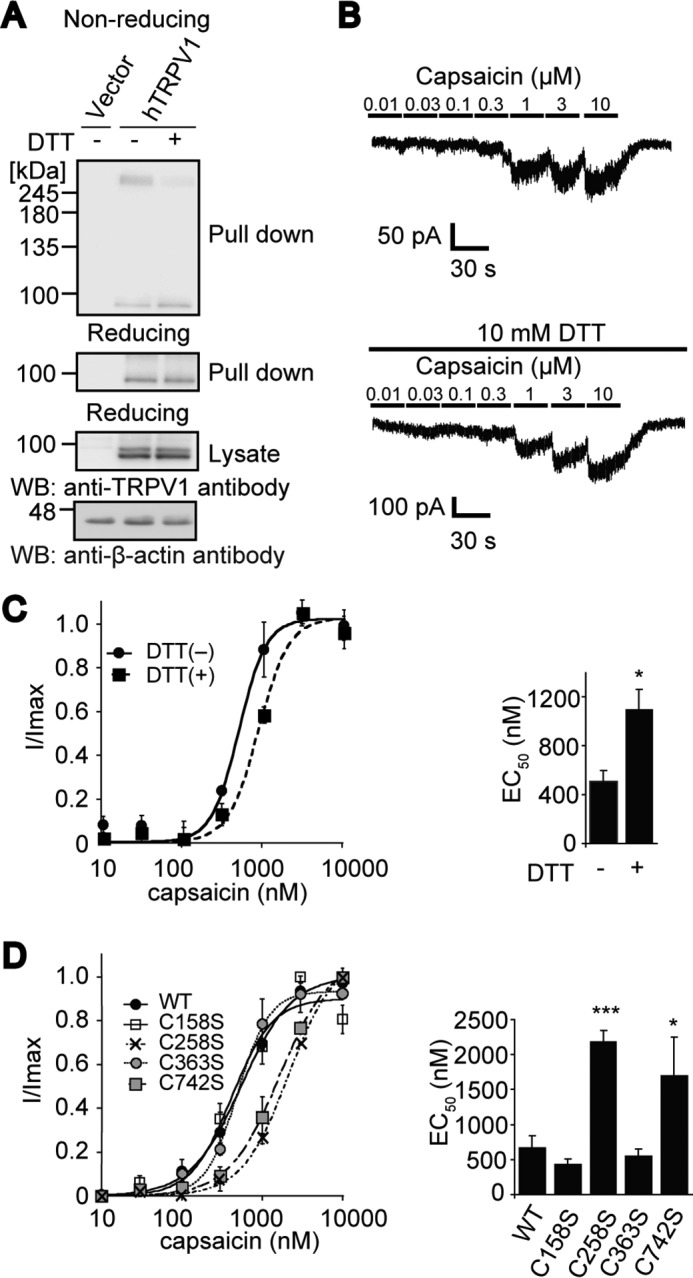
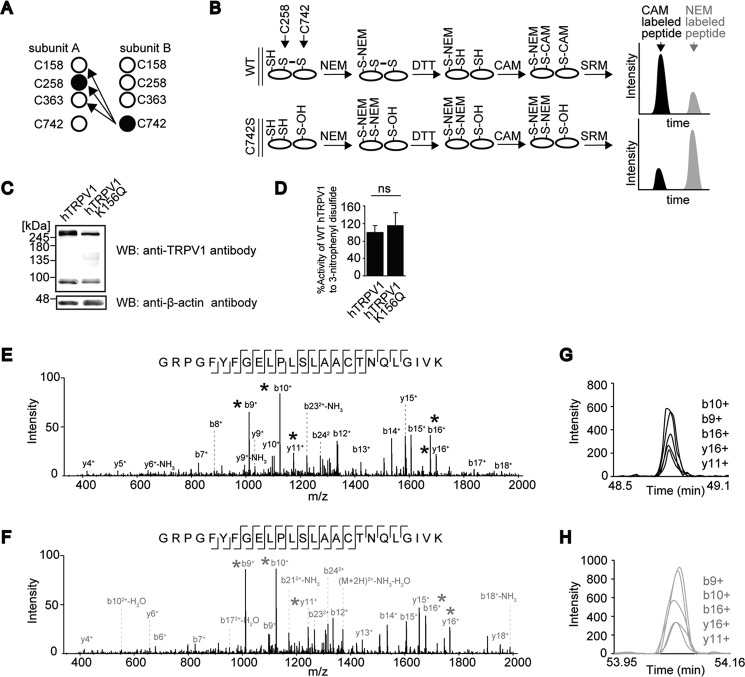
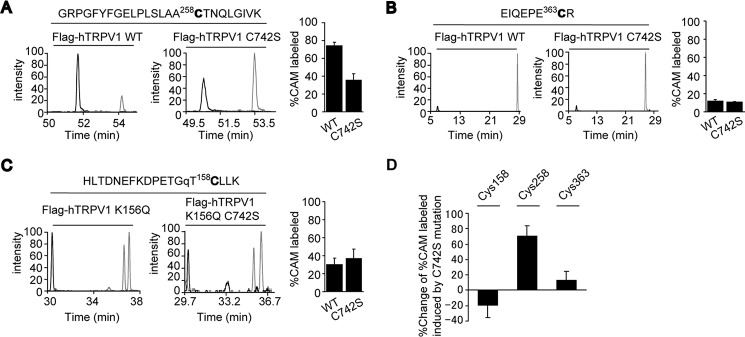
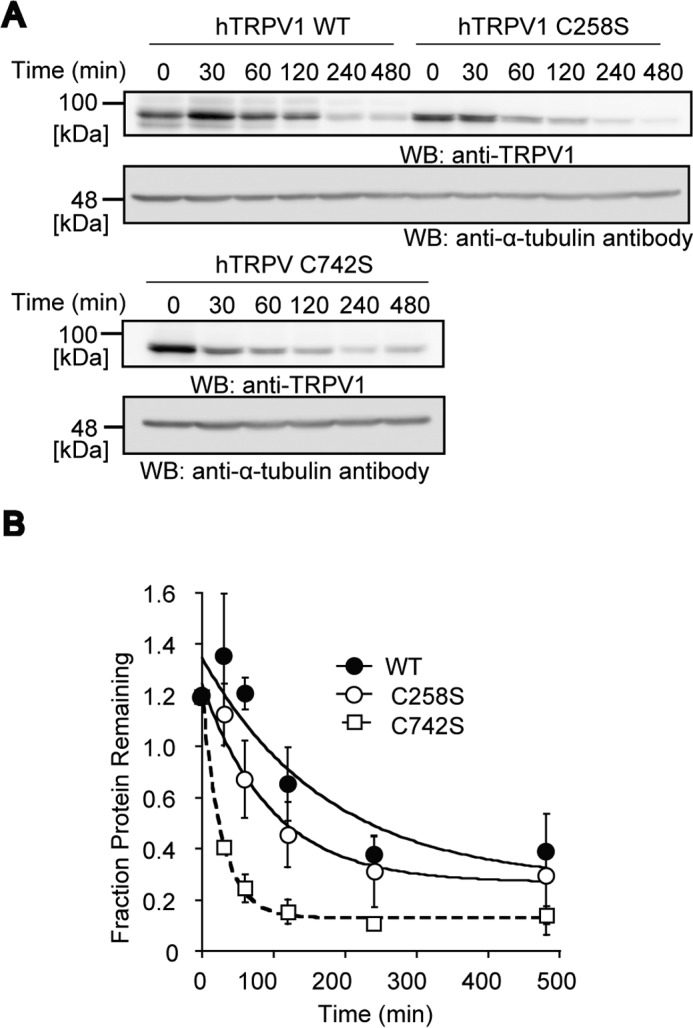
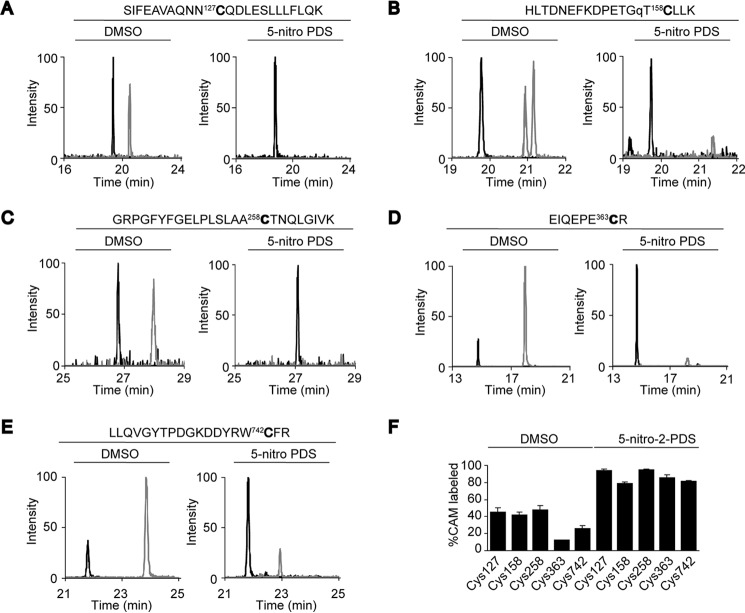
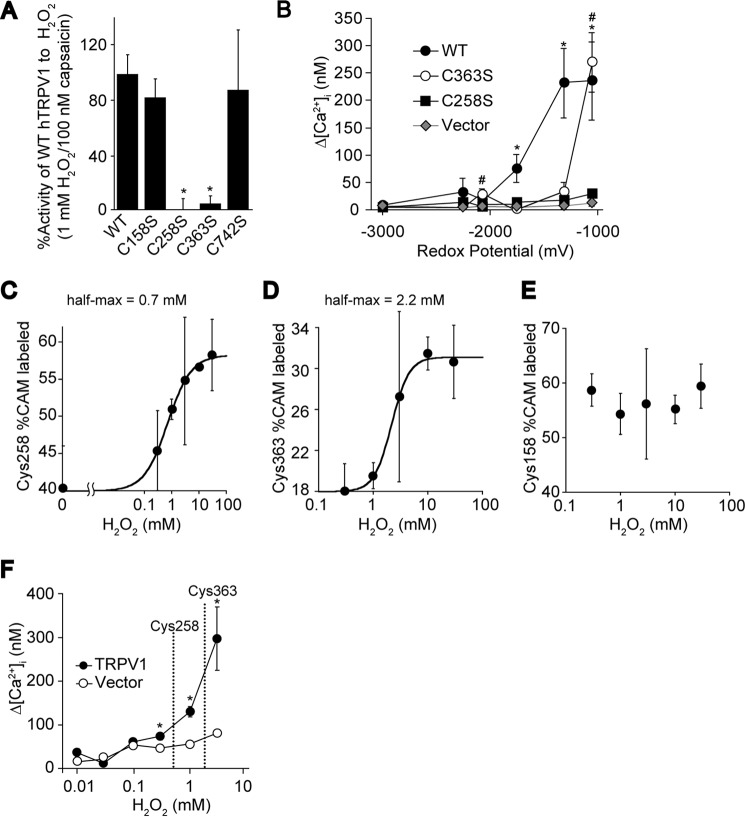
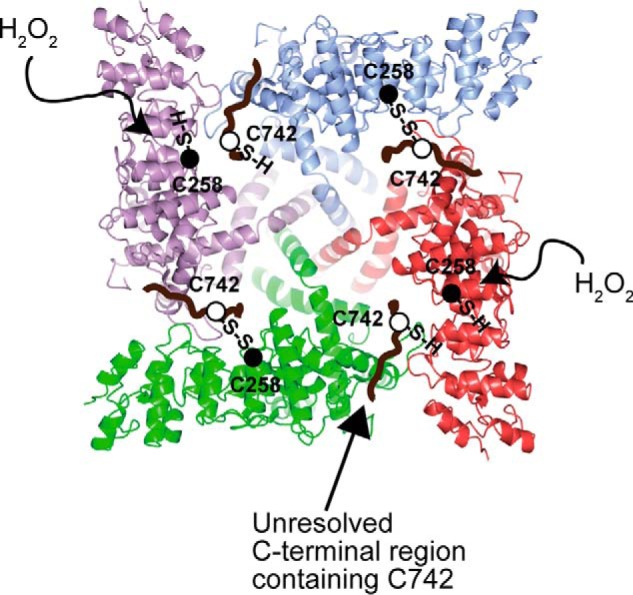
Transient receptor potential vanilloid 1 (TRPV1) channel is a tetrameric protein that acts as a sensor for noxious stimuli such as heat and for diverse inflammatory mediators such as oxidative stress to mediate nociception in a subset of sensory neurons. In TRPV1 oxidation sensing, cysteine (Cys) oxidation has been considered as the principle mechanism; however, its biochemical basis remains elusive. Here, we characterize the oxidative status of Cys residues in differential redox environments and propose a model of TRPV1 activation by oxidation. Through employing a combination of non-reducing SDS-PAGE, electrophysiology, and mass spectrometry we have identified the formation of subunit dimers carrying a stable intersubunit disulfide bond between Cys-258 and Cys-742 of human TRPV1 (hTRPV1). C258S and C742S hTRPV1 mutants have a decreased protein half-life, reflecting the role of the intersubunit disulfide bond in supporting channel stability. Interestingly, the C258S hTRPV1 mutant shows an abolished response to oxidants. Mass spectrometric analysis of Cys residues of hTRPV1 treated with hydrogen peroxide shows that Cys-258 is highly sensitive to oxidation. Our results suggest that Cys-258 residues are heterogeneously modified in the hTRPV1 tetrameric complex and comprise Cys-258 with free thiol for oxidation sensing and Cys-258, which is involved in the disulfide bond for assisting subunit dimerization. Thus, the hTRPV1 channel has a heterogeneous subunit composition in terms of both redox status and function.

Keywords: dimerization; disulfide bond; pain; post-translational modification (PTM); reactive oxygen species (ROS); redox regulation; transient receptor potential channels (TRP channels).


Figures

FIGURE 1.
FIGURE 1.
Oxidative modification and its impacts on human and rat TRPV1. A, congeneric series of reactive disulfides with their redox potentials (mV). Compounds with less negative redox potentials have stronger electrophilicity. B, non-reducing SDS-PAGE and WB analysis of hTRPV1- or rTRPV1-transfected HEK293 cells treated with congeneric series of reactive disulfides (10 μm) for 10 min at room temperature. WB for β-actin are also shown (bottom). C, averaged time courses of [Ca2+]i rises evoked by reactive disulfides with indicated redox potentials for 8 min in HEK293 cells expressing hTRPV1, rTRPV1, or vector (left). Plots of maximal rise of Ca2+ (Δ[Ca2+]i) induced by 10 μm concentrations of reactive disulfides for 8 min in HEK293 cells expressing hTRPV1 or rTRPV1 (n = 10–52) (right). Data points are the mean ± S.E. *, p < 0.01 compared with rTRPV1. D, Non-reducing SDS-PAGE and WB analysis of hTRPV1-transfected HEK293 cells treated with various concentrations of DTT for 10 min at 37 °C. E, hTRPV1-transfected HEK293 cells were treated with 10 mm DTT for 10 min, washed with HBS twice, and recovered as lysates after the indicated time points to be analyzed with non-reducing SDS-PAGE and WB. F, identification of the FLAG-hTRPV1 245-kDa band isolated from HEK293T cells by mass spectrometric analysis. The excised 245-kDa band was subjected to enzymatic digestion (combination of trypsin or chymotrypsin or trypsin/glu-C) and analyzed with liquid chromatography coupled with tandem mass spectrometry. The amino acids in black were identified.
FIGURE 2.
FIGURE 2.
The hTRPV1 channel has an intersubunit disulfide bond between two subunits. A, hTRPV1 and hTRPV1-GFP were transfected individually and co-transfected to HEK293 cells. The lysates were analyzed with reducing and non-reducing SDS-PAGE and WB. B, cell lysates from hTRPV1-transfected HEK293 cells with and without treatment of indicated concentrations of disuccinimidyl suberate (DSS) were subjected to reducing SDS-PAGE and WB. C, cell lysates of hTRPV1- or rTRPV1-expressing HEK293 cells were treated with or without various concentration of SDS and subjected to non-reducing blue native PAGE. D and E, reducing and non-reducing SDS-PAGE and WB analysis of native hTRPV1 and rTRPV1 in HaCaT cells (D) and rat DRG neurons (E), respectively.
FIGURE 3.
FIGURE 3.
Formation of the intersubunit disulfide bond between C and N termini in the hTRPV1 channel. A, alignments of partial amino acid sequences of rat with human TRPV1 where Cys residues are not conserved (GenBankTM accession number NM_018727 and NM_031982, respectively). Non-reducing SDS-PAGE and WB analysis of HEK293 cells expressing WT, S31C, W616C, or S31C + W616C hTRPV1 is shown. B, non-reducing SDS-PAGE and WB analysis of HEK293 cells expressing WT or double S31C + W616C hTRPV1 mutant. C, non-reducing SDS-PAGE and WB analysis of hTRPV1 mutants with single Cys substitution transiently expressed in HEK293T cells. The amounts of transfected vectors were adjusted to elicit comparative expression level. The extent of intersubunit disulfide bond formation was quantified by the ratio between the dimer and monomer band (top) (n = 5 independent experiments). Quantitative densitometric analysis of bands shown in the top panel (bottom). Data points are the mean ± S.E. *, p < 0.05 and **, p < 0.01, compared with WT. D, hTRPV1 Cys mutants with significant reductions in dimer/monomer ratio are indicated as black circles on a schematic topology of hTRPV1 (left). Shown is a ribbon structure model of rTRPV1 adapted from Liao et al. (3) showing views from side (right). Cys residues are marked with green, and the residues implicated in intersubunit disulfide bond are marked black and indicated with arrows. Unresolved C-terminal electron density that is predicted to contain Cys-742 is also highlighted in black.
FIGURE 4.
FIGURE 4.
Electrophysiology analysis of hTRPV1 with the disrupted intersubunit disulfide bond. A, cell surface expression of hTRPV1-expressing HEK293 cells treated with or without 10 mm DTT for 10 min. Cell lysates prepared after exposure to sulfo-NHS-SS-biotin were incubated with NeutrAvidin beads and subjected to non-reducing SDS-PAGE and WB. B, whole-cell currents from hTRPV1-expressing HEK293 cells in response to various concentration of capsaicin in the presence or absence of 10 mm DTT. C, relative amplitudes of whole-cell currents of experiments shown in B (n = 3–4). EC50 are summarized on the right. *, p < 0.05 compared with DTT (−). D, relative amplitudes of whole-cell currents in hTRPV1 mutants-transfected HEK293 cells in response to various doses of capsaicin (n = 3–7). EC50 are summarized on the right. *, p < 0.05 and ***, p < 0.001, compared with WT. The plots were fitted to the Hill equation ƒ(x) = A0 + (Amax − A0)/(1 + (EC50/x)n, where A0 is the basal response, Amax is the maximum response, x is the capsaicin concentration, and n is the Hill coefficient. A holding potential of −80 mV was used, and the current amplitudes were normalized with the maximum current amplitudes obtained by capsaicin concentration that elicited the largest response (I/I max). Data points are the mean ± S.E.
FIGURE 5.
FIGURE 5.
Quantitative mass spectrometric analyses of disulfide bond pairing. A, disulfide bond pairings that were tested. B, schematic description of the protocol employed for elucidation of disulfide pairing. C, non-reducing SDS-PAGE and WB analysis of WT and K156Q hTRPV1-expressing HEK293 cells. D, maximal Ca2+ responses (Δ[Ca2+]i) to 10 μm 3-nitrophenyl disulfide stimulation (n = 19–33) were normalized to responses to 10 μm capsaicin (n = 28–42) for K156Q hTRPV1 mutant expressed in HEK293 cells. Differences not statistically significant are labeled as ns. E and F, MS/MS spectra of CAM (E)- and NEM (F)-labeled GRPGFYFGELPLSLAACTNQLGIVK (C is Cys-258) peptide, which were generated from tryptic digestion of FLAG-hTRPV1 purified from HEK293T cells. The asterisks (*) denote peaks used in multiple reaction monitoring transitions. G and H, representative multiple reaction monitoring analysis of CAM (black)- and NEM (gray)-labeled Cys-258-containing peptides.
FIGURE 6.
FIGURE 6.
An intersubunit disulfide bond between Cys-258 and Cys-742 in hTRPV1 channel. A and B, representative SRM experiments of peptides containing Cys-258 and Cys-363, which were generated from tryptic digestion of purified WT and C742S FLAG-hTRPV1. C, SRM experiments for peptides containing Cys-158, which were generated from tryptic digestion of purified FLAG-hTRPV1 mutants, K156Q and K156Q/C742S FLAG-hTRPV1. The transitions used to quantify CAM (black)- and NEM (gray)-labeled peptides containing Cys-258, Cys-363, and Cys-158 are shown below. The mode of modification is followed by transitions for the peptides containing the respective Cys residues: CAM (1354.72(z = +2) > 1124.55(b10+)) and NEM (1388.73(z = +2) > 1124.55(b10+)) for Cys-258, CAM (530.74(z = +2) > 561.25(y4+)) and NEM (564.75(z = +2) > 629.27(y4+)) for Cys-363, and CAM (749.36(z = +3) > 1146.58(y10+)) and NEM (772.04(z = +3) > 1214.61(y10+)) for Cys-158. The K156Q mutation is labeled as lowercase q. The extent of Cys oxidation is represented by %CAM labeled peptide, which is the peak area of CAM-labeled peptide/(peak area of CAM-labeled peptide + peak area of NEM-labeled peptide) (left). D, SRM experiments shown in A–C are summarized as % change in %CAM labeled peptide between WT and C742S for Cys-258 and Cys-363 (between K156Q and K156Q/C742S for Cys-158). Data points are the mean ± S.D. of three analytical replicates.
FIGURE 7.
FIGURE 7.
Decreased protein stability of C258S and C742S hTRPV1 mutants. A, HEK293T cells expressing WT, C258S, and C742S hTRPV1 were cultured in the presence of cycloheximide for the indicated time periods. The cell lysates were subjected to reducing SDS-PAGE and WB. The levels of hTRPV1 were quantified through normalization by those of α-tubulin. B, quantitative densitometric analysis of the protein levels of WT, C258S, and C742S normalized to those of α-tubulin (n = 3). Data points are the mean ± S.E. The plots were fitted to the exponential decay equation ƒ(t) = C + A0e−λt, where C is the constant, A0 is the initial amount, x is the time after cycloheximide administration, and λ is the decay constant. The half-life (t½) was calculated by ln(2)/λ.
FIGURE 8.
FIGURE 8.
Cys residues at the interface are accessible by oxidants. A–E, Cys oxidation of WT or K156Q FLAG-hTRPV1 induced by 500 μm 5-nitro-2-PDS treatment for 30 min at 37 °C. Oxidized and reduced Cys of WT or K156Q FLAG-hTRPV1 (for Cys-158 only) treated with or without 500 μm 5-nitro-2-PDS were masked with CAM (black) and NEM (gray), respectively. The samples were subjected to SRM analysis after purification from HEK293T cells and trypsinization. %CAM-labeled peptides were determined for Cys-127, Cys-158, Cys-258, Cys-363, and Cys-742 using the following SRM transitions: Cys-127 CAM (894.13(z = +3) > 1017.52(y172+)) and NEM (916.80(z = +3) > 1051.53(y172+)) for A; Cys-158 CAM (749.36(z = +3) > 1146.58(y10+)) and NEM (772.04(z = +3) > 1214.61(y10+)) for B; Cys-258 CAM (1354.72(z = +2) > 1124.55(b10+)) and NEM (1388.73(z = +2) > 1124.55(b10+)) for C; Cys-363 CAM (530.74(z = +2) > 561.25(y4+)) and NEM (564.75(z = +2) > 629.27(y4+)) for D; Cys-742 CAM (797.05(z = +3) > 968.43(y152+)) and NEM (819.73(z = +3) > 1002.44(y152+)) for E. F, summary of %CAM-labeled peptides for the respective Cys residues. Data points are the mean ± S.D. of three analytical replicates.
FIGURE 9.
FIGURE 9.
Quantification of hTRPV1 Cys oxidation induced by H2O2. A, maximal Ca2+ responses (Δ[Ca2+]i) to 1 mm H2O2 stimulation at 37 °C (n = 22–100) were normalized to responses to 100 nm capsaicin (n = 12–46) for disulfide-less hTRPV1 mutants expressed in HEK293 cells. *, p < 0.01 compared with WT. B, oxidation sensitivity of disulfide-less hTRPV1 mutants. Plots of Δ[Ca2+]i evoked by 10 μm concentrations of the congeneric series of reactive disulfides (see Fig. 1A) in HEK293 cells expressing hTRPV1 or hTRPV1 Cys mutants (n = 5–37). p < 0.05 compared with vector for hTRPV1 WT (*) and C363S mutant (#). Data points are the means ± S.E. C–E, oxidized and reduced Cys of FLAG-hTRPV1 (for Cys-258 and Cys-363) or FLAG-hTRPV1 K156Q (for Cys-158) treated with various doses of H2O2 for 30 min at 37 °C were masked with CAM and NEM, respectively. The samples were subjected to SRM analysis after purification from HEK293T cells and trypsinization. The half-max was derived by fitting the plots to the Hill equation (Cys-258half-max = 0.7 mm, Cys-363half-max = 2.2 mm): Hill equation, ƒ(x) = A0 + (AmaxA0)/(1 + (EC50/x)n, where A0 is then basal %CAM-labeled peptide, Amax is maximum %CAM-labeled peptide, x is the H2O2 concentration, and n is the Cyshalf-max. Data points are the means ± S.D. of three analytical replicates. F, the half-maximal saturation of H2O2 for Cys-258 and Cys-363 is indicated as dotted lines on a dose-response curve of H2O2 analyzed at 37 °C stimulated for 8 min (n = 41–115). Data points are the mean ± S.E. *, p < 0.01 compared with vector.
FIGURE 10.
FIGURE 10.
Schematic representation of hTRPV1 activation by oxidants. Schematic of hTRPV1 tetrameric complex viewed from the cytoplasmic side (assuming identical structure with the rTRPV1 structure reported by Liao et al. (3)). Four subunits of hTRPV1 are shown in different colors (green, red, purple, and blue) and the respective Cys-258 (black circle) and the unresolved C-terminal electron density (brown) predicted to contain Cys-742 (white circle) are indicated.

References

    1. Clapham D. E. (2003) TRP channels as cellular sensors. Nature 426, 517–524 - PubMed
    1. Clapham D. E., Julius D., Montell C., and Schultz G. (2005) International Union of Pharmacology. XLIX. Nomenclature and structure-function relationships of transient receptor potential channels. Pharmacol. Rev. 57, 427–450 - PubMed
    1. Liao M., Cao E., Julius D., and Cheng Y. (2013) Structure of the TRPV1 ion channel determined by electron cryo-microscopy. Nature 504, 107–112 - PMC - PubMed
    1. Kozai D., Ogawa N., and Mori Y. (2014) Redox regulation of transient receptor potential channels. Antioxid. Redox. Signal. 21, 971–986 - PubMed
    1. Susankova K., Tousova K., Vyklicky L., Teisinger J., and Vlachova V. (2006) Reducing and oxidizing agents sensitize heat-activated vanilloid receptor (TRPV1) current. Mol. Pharmacol. 70, 383–394 - PubMed

Publication types

Associated data

LinkOut - more resources