. 2016 Feb 18;127(7):869-81.
doi: 10.1182/blood-2015-10-673236. Epub 2015 Dec 23.

Targetable genetic features of primary testicular and primary central nervous system lymphomas

Affiliations

Targetable genetic features of primary testicular and primary central nervous system lymphomas

Bjoern Chapuy et al. Blood. .

Abstract

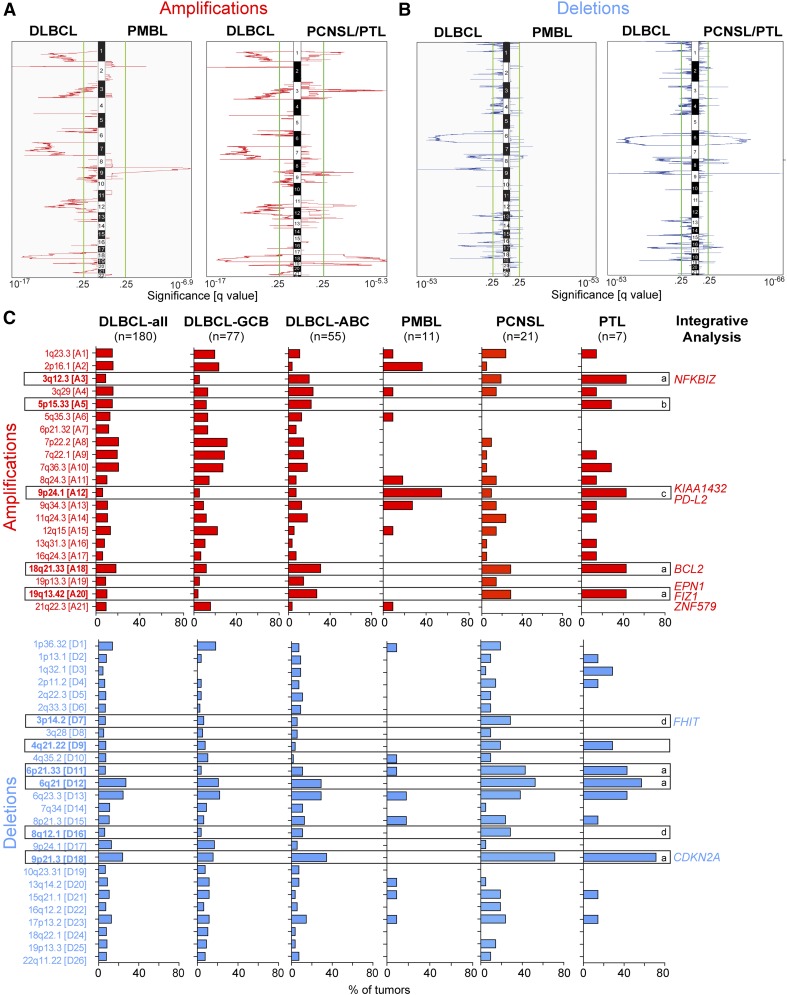
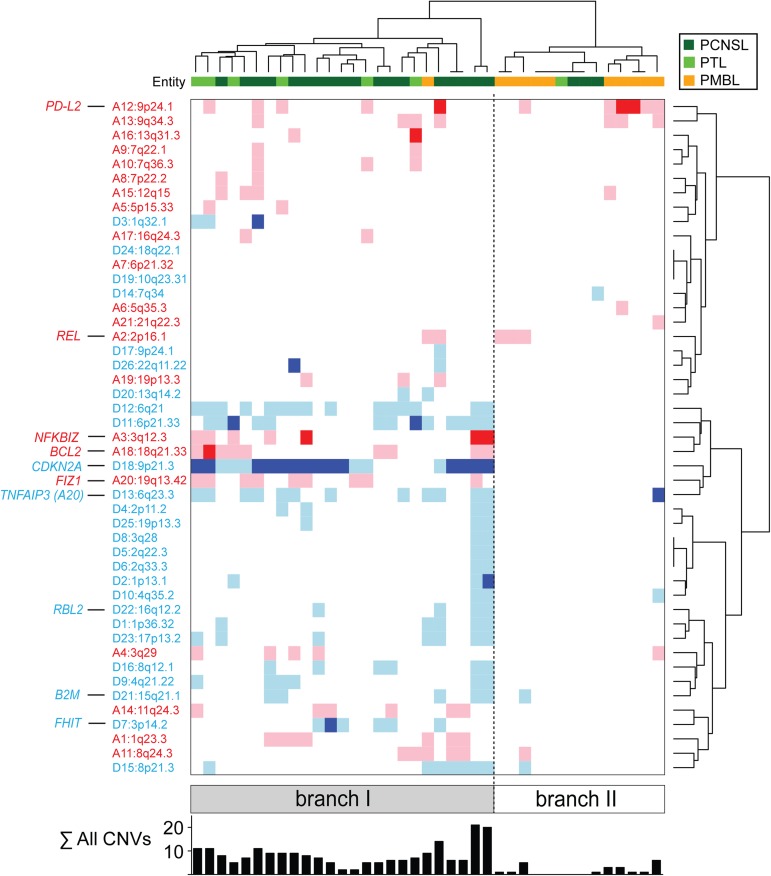
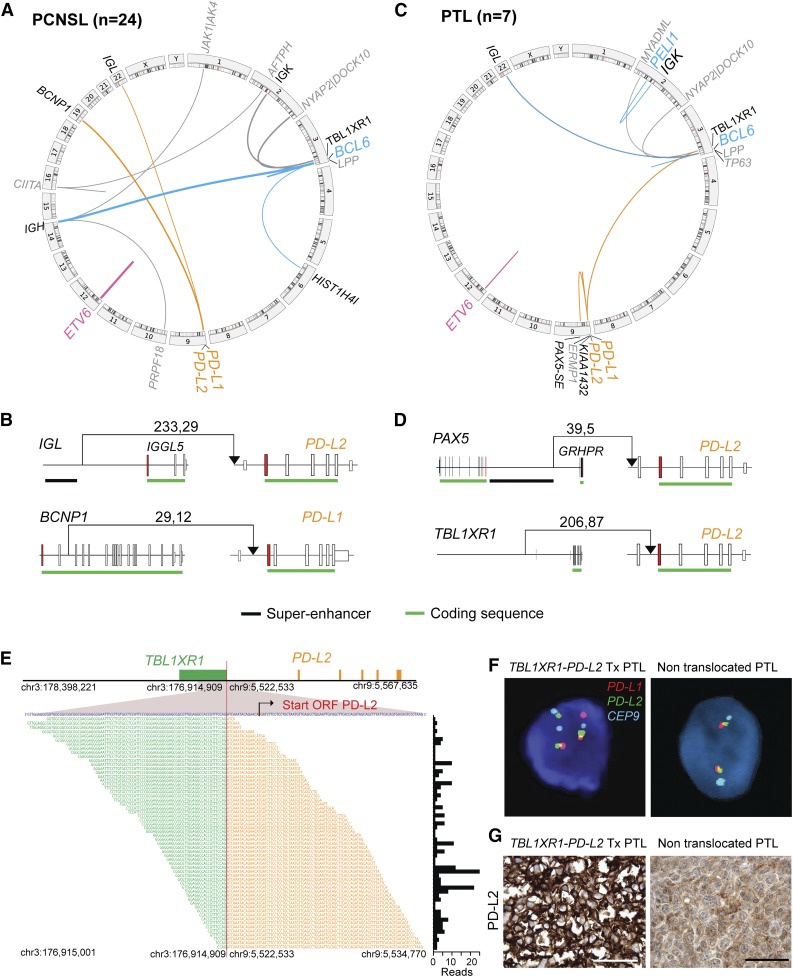
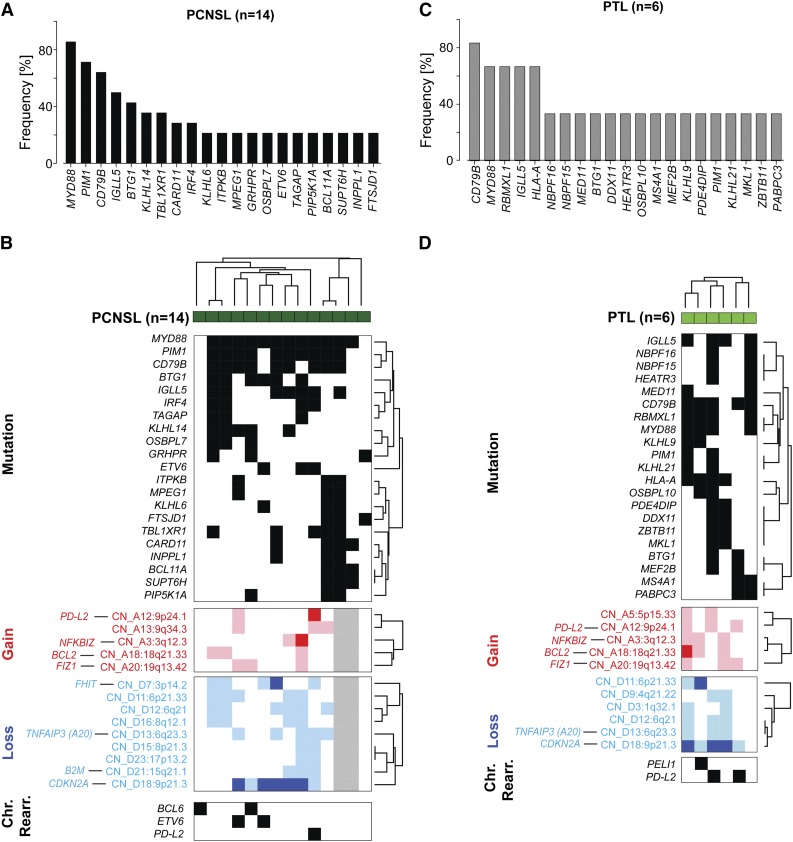
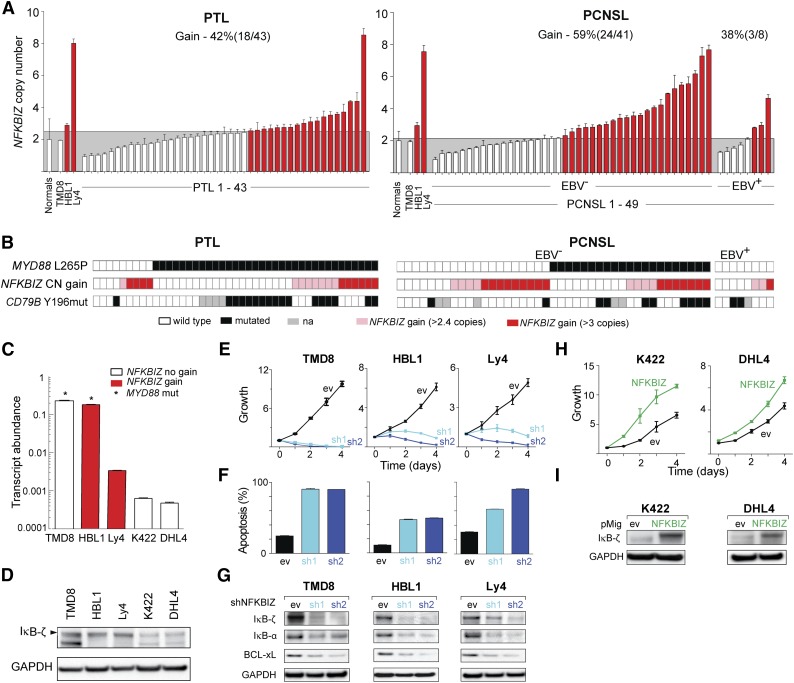
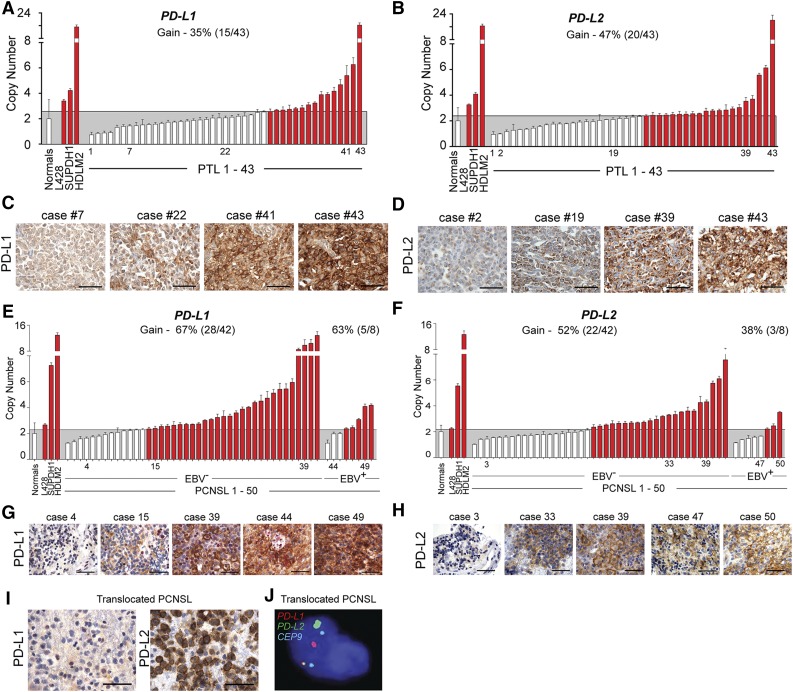
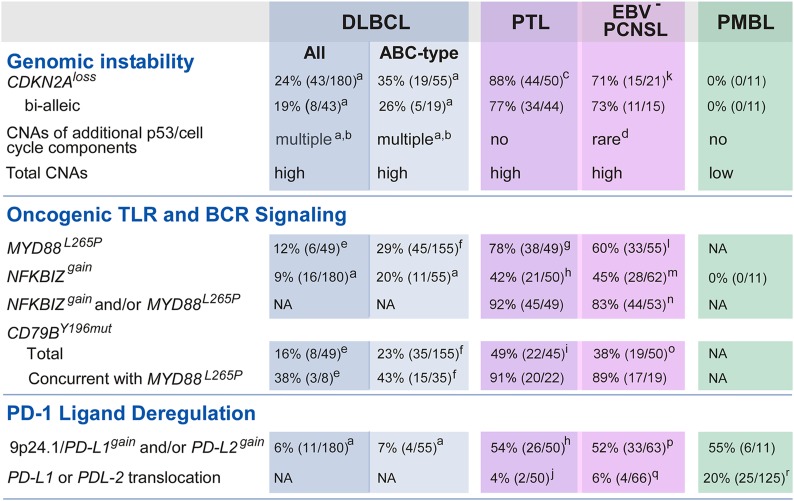
Primary central nervous system lymphomas (PCNSLs) and primary testicular lymphomas (PTLs) are extranodal large B-cell lymphomas (LBCLs) with inferior responses to current empiric treatment regimens. To identify targetable genetic features of PCNSL and PTL, we characterized their recurrent somatic mutations, chromosomal rearrangements, copy number alterations (CNAs), and associated driver genes, and compared these comprehensive genetic signatures to those of diffuse LBCL and primary mediastinal large B-cell lymphoma (PMBL). These studies identify unique combinations of genetic alterations in discrete LBCL subtypes and subtype-selective bases for targeted therapy. PCNSLs and PTLs frequently exhibit genomic instability, and near-uniform, often biallelic, CDKN2A loss with rare TP53 mutations. PCNSLs and PTLs also use multiple genetic mechanisms to target key genes and pathways and exhibit near-uniform oncogenic Toll-like receptor signaling as a result of MYD88 mutation and/or NFKBIZ amplification, frequent concurrent B-cell receptor pathway activation, and deregulation of BCL6. Of great interest, PCNSLs and PTLs also have frequent 9p24.1/PD-L1/PD-L2 CNAs and additional translocations of these loci, structural bases of immune evasion that are shared with PMBL.


Figures

Figure 1
Figure 1
GISTIC-defined CNAs in LBCL subtypes. (A-B) GISTIC-defined recurrent CNAs (amplification in [A], red; deletions in [B], blue) in 180 primary DLBCLs are compared with those in 11 PMBLs (left panel) and 28 PCNSLs/PTLs (right panel) in mirror plots. Chromosome position is on the y-axis, and significance is on the x-axis. The green line denotes q value of 0.25. (C) Frequencies of the 21 GISTIC-defined amplification peaks (top panel, red) and the 26 GISTIC-defined deletion peaks (bottom panel, blue) in the respective LBCL subtypes are plotted as bar graphs. DLBCL-GCB and DLBCL-ABC are subsets of DLBCL-All. CNAs that are more frequent in PTL and PCNSL (a), PTL only (b), PMBL and PTL (c), and PCNSL only (d), respectively, are noted. CNAs that are significantly enriched in PMBL, PCNSL, and/or PTL are boxed (FDR q value < 0.3; see also supplemental Table 2). Top genes by integrative analyses of copy number (CN) and transcript abundance are indicated on the right.
Figure 2
Figure 2
PCNSLs, PTLs, and PMBLs clustered by recurrent CNAs. (A) Unsupervised bihierarchical clustering of all 47 GISTIC-defined CNAs (y-axis) in 39 primary LBCLs (21 PCNSLs [dark green], 7 PTLs [light green], 11 PMBLs [orange]; x-axis). Copy gains, red; copy losses, blue; color intensity corresponds to magnitude of CNA. The sum of all GISTIC-defined CNAs per sample is listed below as a bar graph. Top genes by integrative analyses of CN and transcript abundance are indicated on the left.
Figure 3
Figure 3
Chromosomal rearrangements in PCNSL and PTL. (A,C) Detected chromosomal rearrangements in 24 PCNSL (A) and 7 PTL (C) are summarized as circos plots. Structural alterations involving certain partners are highlighted; BCL6, blue; ETV6, pink; PD-1 ligands, orange. Partners of color-coded alterations are black, all other alterations are gray. Frequency of events is indicated by line thickness. (B,D) Chromosomal rearrangements involving PD-L1 or PD-L2 are plotted in their genomic context. Exons are visualized as boxes, ATG-containing exon are in red, the coding region is underlined in green, and previously identified super-enhancers in DLBCLs are underlined in black. The number of supporting reads (split reads, read pairs) is indicated above each translocation. (E) TBL1XR1-PD-L2 fusion as validated by RNA-Seq. Chromosomal breakpoint is depicted by the red line. Start codon of PD-L2 is indicated in red within the contig of the RNA-Seq reads. The translocation involves only the regulatory elements of TBL1XR1 and does not affect the open reading frame (ORF) of PD-L2. Individual supporting reads are shown in the lower panel, with frequencies as a bar graph on the right. (F) FISH assays of PTLs with the PD-L2 translocation (left panel) or with wild-type PD-L2 (right panel). PD-L1 in red, PD-L2 in green, and centromeric probe (CEP9) in aqua. (G) IHC of PD-L2 expression in the translocated PTL (left panel) and a PTL with wild-type PD-L2 (right panel). The scale bar represents 100 μm.
Figure 4
Figure 4
Somatic mutations and patterns of genetic alterations in PCNSL and PTL. (A) Frequency of mutations in PCNSLs (mutations initially identified by WES in 5 tumor/normal pairs and subsequently assessed in 9 additional tumors without paired normals by RNA-Seq). See also supplemental Table 5D-H. Only genes mutated in at least 20% (3 patients) are shown. (B) Mutations occurring in at least 20% (3/14) of PCNSL samples (dark green) are plotted in a black-and-white–coded matrix (x-axis, samples; y-axis, mutations; black, mutation present; white, mutation absent) and clustered bihierarchically. CNAs in these PCNSLs are visualized as a color-coded heat map below; copy gain, red; copy loss, blue; not available, gray; color intensity corresponds to magnitude of CNA. Top genes by integrative analyses of CN and transcript abundance are indicated on the left, y-axis. Chromosomal rearrangements of BCL6, ETV6, or PD-L2 are added below. (C) Frequency of mutations in 6 PTLs as assessed by RNA-Seq. Only mutations present in at least 2 patients are shown (supplemental Table 5I, full list). SNVs were filtered for known SNPs; only SNVs previously deposited in COSMIC or reported to be mutated in DLBCLs/PCNSLs are shown. (D) Mutations present in at least 2 PTLs (y-axis) are plotted in a black-and-white–coded matrix as in (B) and clustered bihierarchically. CNAs in these PTLs are visualized as a color-coded heat map below, and selected chromosomal rearrangements modifying BCL6 (PELI1) and PD-L2 are added at the bottom.
Figure 5
Figure 5
Functional consequences of 3q12.3/NFKBIZ copy gain and IκB-ζ overexpression. (A) CN of 3q12.3/NFKBIZ in 43 PTLs (left panel) and 49 PCNSLs (41 EBV and 8 EBV+, right panel) from the extension cohorts. Normals include 5 tonsils and 5 reactive lymph nodes. The upper 95% confidence interval of the normals was used as a threshold for copy gain. Indicated cell lines with known NFKBIZ CNs were used as controls. Cases with copy gain are shown in red. Error bars reflect standard deviation. (B) Cosegregation of genetic alterations in the TLR pathway (MYD88 mutations [upper panel; black, L265P; white, no L265P], NFKBIZ copy gain [middle panel; copy gain, red; color intensity corresponds to magnitude of copy gain]) and BCR pathway (CD79B mutations [lower panel; black, missense mutations affecting Y196; white, no exon 5 mutations; gray, not available]) in the 43 PTL samples (left panel), and 49 PCNSL cases (right panel; 41 EBV and 8 EBV+). (C) IκB-ζ encoded by NFKBIZ locus transcript abundance in representative DLBCL cell lines. Asterisks indicate cell lines with MYD88L265P mutation. (D) IκB-ζ protein abundance in indicated cell lines. Full-length IκB-ζ is indicated with an arrowhead. Note that TMD8 has a heterozygous deletion of 159 base pairs, resulting in a shorter, fully functional IκB-ζ protein. The membrane was reprobed for glyceraldehyde-3-phosphate dehydrogenase (GAPDH) as loading control. (E-F) Proliferation (E) and apoptosis (F) after knockdown of IκB-ζ (sh1 and sh2, 2 independent IκB-ζ hairpins; ev, control) in representative DLBCL cell lines with increased IκB-ζ transcript abundance resulting from NFKBIZ gain only (Ly4), MYD88 mutation only (TMD8), or both (HBL1). (G) Efficacy of knockdown of IκB-ζ and downstream targets was determined by immunoblot. (H) Proliferation after enforced expression of IκB-ζ in cell lines with low IκB-ζ transcript levels (DHL4 and K422). (I) Efficacy of IκB-ζ overexpression was determined by immunoblot.
Figure 6
Figure 6
Genetic alterations of PD-L1 and PD-L2 in PTL and PCNSL. (A) CNs of PD-L1 in 43 PTL cases from the extension cohort. Normals include 5 tonsils and 5 reactive lymph nodes. The upper 95% confidence interval of the normals was used as a threshold for CN gain in the PTLs. Indicated cHL cell lines with known PD-L1 copy gain were used as controls. Cases with copy gain are highlighted in red. Error bars reflect standard deviation. (C) PD-L1 protein expression in indicated cases from (A). The scale bar represents 100 μm. (B) CNs of PD-L2 in 43 PTL cases from extension cohort. Controls are as in (A). (D) PD-L2 protein expression in indicated cases from (B). (E) CNs of PD-L1 in 50 PCSNL cases (42 EBV and 8 EBV+) from the extension cohort. Details are as in (A). (F) CNs of PD-L2 in 50 PCSNL cases (42 EBV and 8 EBV+) from extension cohort. Controls are as in (A). (G) PD-L1 protein expression in indicated cases from (E). The scale bar represents 100 μm. (H) PD-L2 protein expression in indicated cases from (F). (I) PD-L1 (left panel) and PD-L2 (right panel) of the PCNSL case with wild-type PD-L1/2 CN. (J) Split-apart FISH assay of the PCNSL in (I). PD-L1 in red, PD-L2 in green and centromeric probe (CEP9) in aqua.
Figure 7
Figure 7
Unique combinations of structural alterations in discrete LBCL subtypes. Frequency of specific genetic alterations modulating “Genomic Instability,” “Oncogenic TLR and BCR Signaling,” and “PD-1 Ligand Deregulation” in DLBCL all, DLBCL ABC-type, PTL, EBV PCNSL, and PMBL are noted. a, Raw data previously published in reference . b, CNAs include the following alterations: MDM2gain, MDM4gain, CDK2gain, CDK4gain, CDK6gain, RB1loss, RBL2loss, TP53loss, KDM6Bloss, RPL26loss, BCL2L12gain, RFWD2gain, CCND3gain. c, CDKN2A CN data were available for 50 PTL (7 discovery + 43 extension). d, Only RBL2loss. e, As reported in reference . f, As reported in reference . g, MYD88L265P mutation status was available from 49 PTL (7 discovery + 42 extension). h, CN data for NFKBIZ and 9p24.1/PD-L1/PD-L2 loci were available from 50 PTL (7 discovery + 43 extension). i, CD79BY196mut mutation status in 45 PTL (7 discovery + 38 extension). j, 9p24.1/PD-L1/PD-L2 translocation data were from 50 PTL (7 discovery + 43 extension). k, CDKN2A CN data were available for 21 EBV PCNSL (discovery only). l, MYD88L265P mutation status was available from 55 EBV PCNSL (14 discovery + 41 extension). m, CN data for NFKBIZ locus were available from 62 EBV PCNSL (21 discovery + 41 extension). n, NFKBIZ CN data and MYD88L265P mutation status were available for 53 EBV PCNSL (12 discovery + 41 extension). o, CD79BY196mut mutation status was available from 50 EBV PCNSL (12 discovery + 38 extension). p, 9p24.1/PD-L1/PD-L2 CN data were from 63 EBV PCNSL (21 discovery + 42 extension). q, 9p24.1/PD-L1/PD-L2 translocation data were from 66 EBV PCNSL (24 discovery + 42 extension). r, as reported in reference .

References

    1. Rubenstein JL, Gupta NK, Mannis GN, Lamarre AK, Treseler P. How I treat CNS lymphomas. Blood. 2013;122(14):2318–2330. - PMC - PubMed
    1. Cheah CY, Wirth A, Seymour JF. Primary testicular lymphoma. Blood. 2014;123(4):486–493. - PubMed
    1. Horne MJ, Adeniran AJ. Primary diffuse large B-cell lymphoma of the testis. Arch Pathol Lab Med. 2011;135(10):1363–1367. - PubMed
    1. Deckert M, Montesinos-Rongen M, Brunn A, Siebert R. Systems biology of primary CNS lymphoma: from genetic aberrations to modeling in mice. Acta Neuropathol. 2014;127(2):175–188. - PubMed
    1. Riemersma SA, Jordanova ES, Schop RF, et al. Extensive genetic alterations of the HLA region, including homozygous deletions of HLA class II genes in B-cell lymphomas arising in immune-privileged sites. Blood. 2000;96(10):3569–3577. - PubMed

Publication types

MeSH terms

Substances