. 2016 Mar 24;127(12):1564-74.
doi: 10.1182/blood-2015-07-656678. Epub 2015 Dec 23.

UCH-L1 is induced in germinal center B cells and identifies patients with aggressive germinal center diffuse large B-cell lymphoma

Affiliations

UCH-L1 is induced in germinal center B cells and identifies patients with aggressive germinal center diffuse large B-cell lymphoma

Tibor Bedekovics et al. Blood. .

Abstract

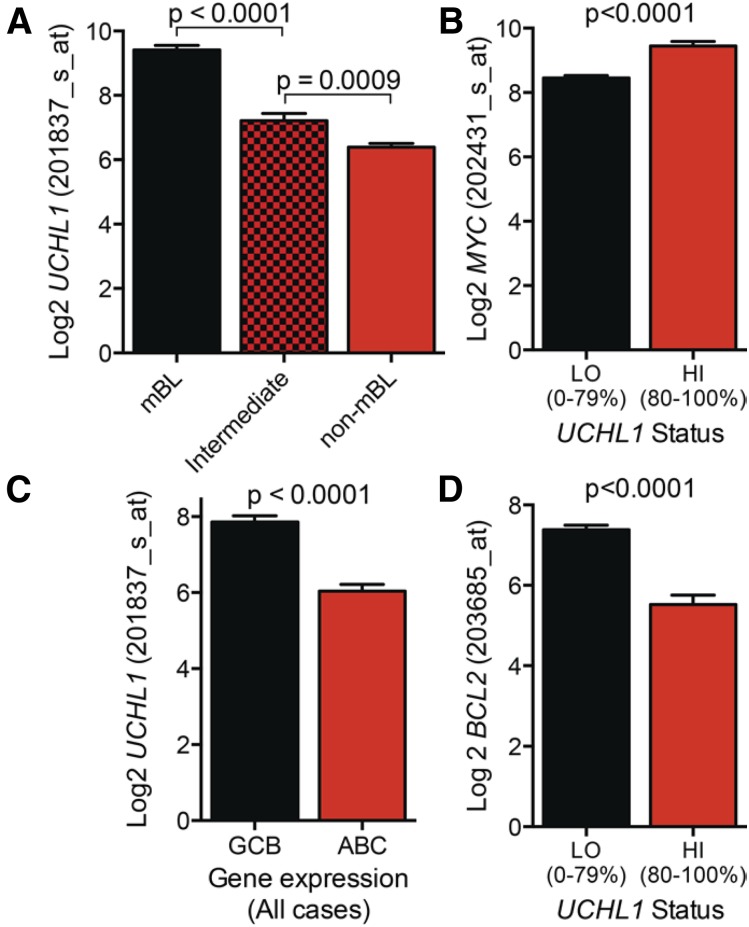
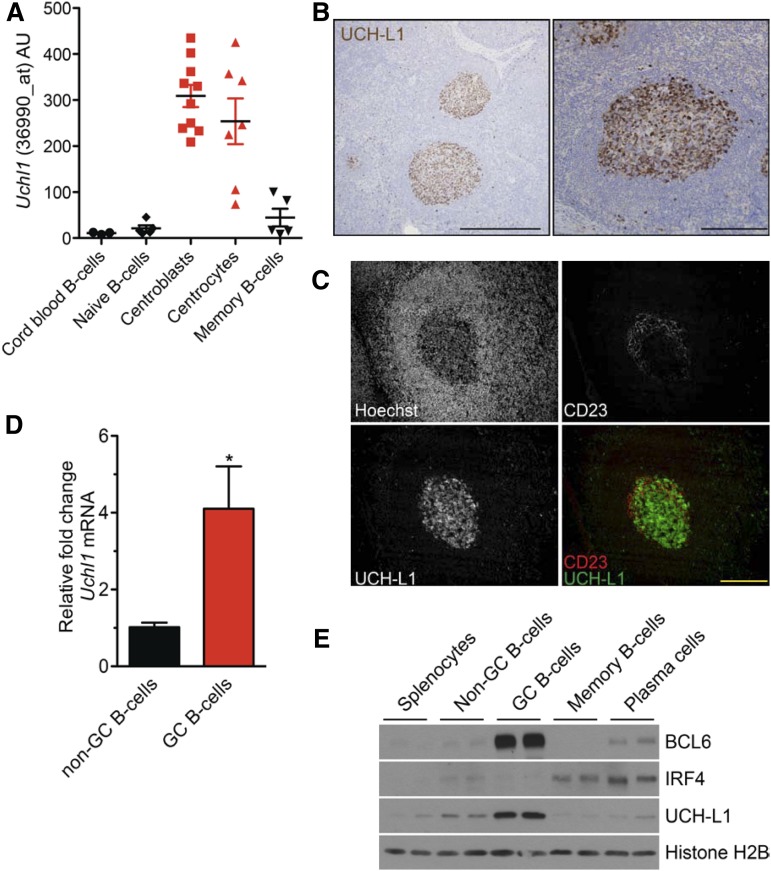
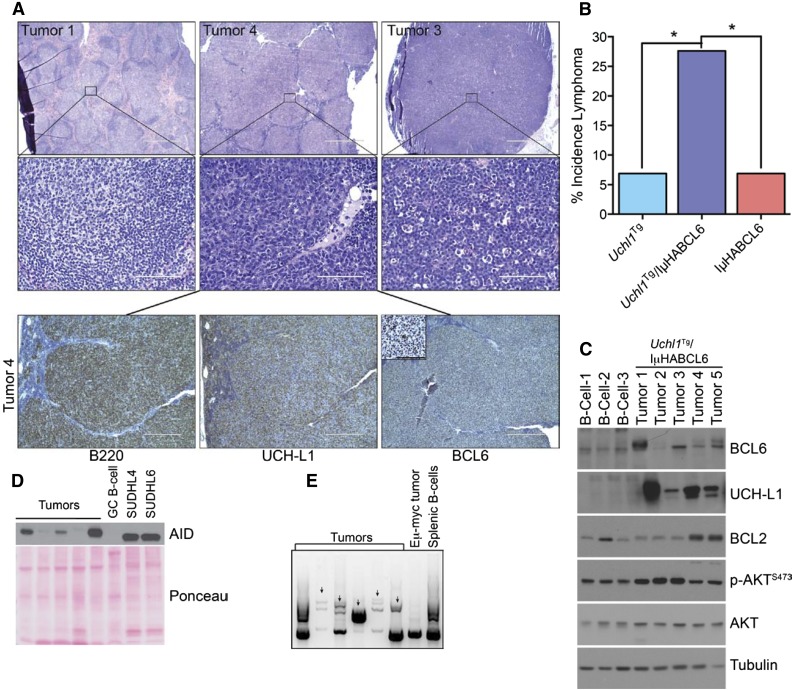
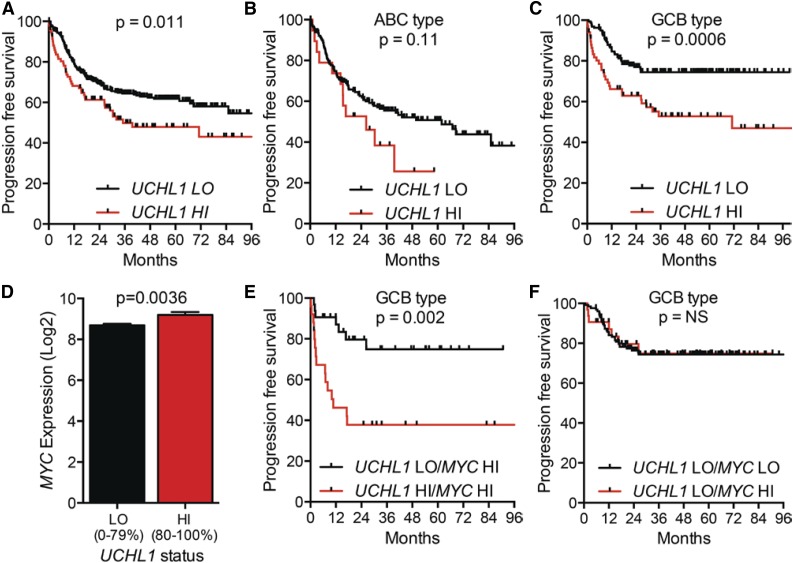
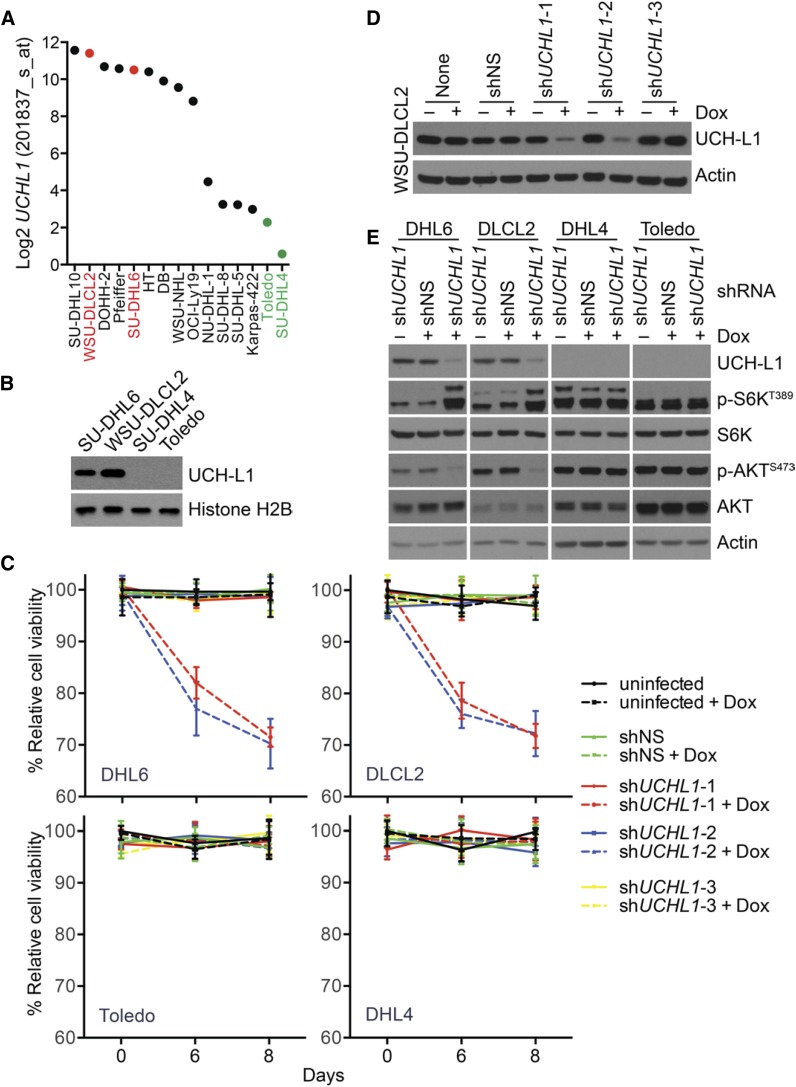
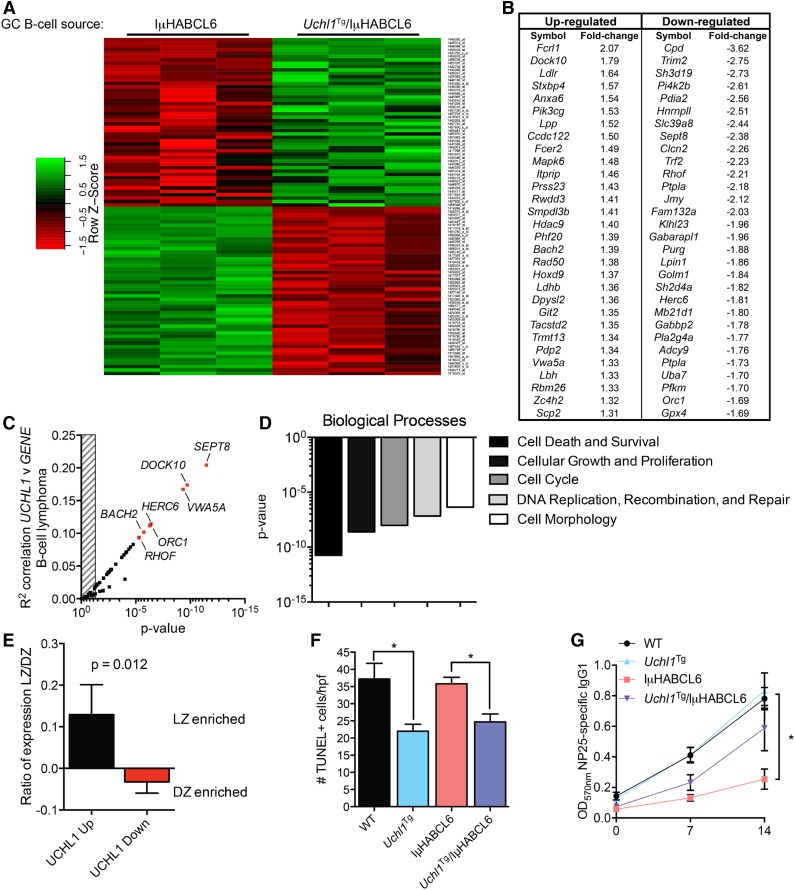
Gene expression profiling has identified 2 major subclasses of diffuse large B-cell lymphoma (DLBCL). Cases resembling germinal center (GC) B cells (GCB-DLBCL) generally occur in younger patients, have a distinct molecular pathophysiology, and have improved outcomes compared with those similar to activated post-GC cells (activated B-cell DLBCL). We previously found that the ubiquitin hydrolase UCH-L1 is frequently overexpressed in mature B-cell malignancies and is a potent oncogene in mice. The cause for its overexpression in lymphoma, and whether it impacts the outcome of patients with DLBCL is unknown. Here, we show that UCH-L1 reflects GC lineage in lymphoma and is an oncogenic biomarker of aggressive GCB-DLBCL. We find that UCH-L1 is specifically induced in GC B cells in mice and humans, and that its expression correlates highly with the GCB subtype in DLBCL. We also find that UCH-L1 cooperates with BCL6 in a mouse model of GC B-cell lymphoma, but not with the development of multiple myeloma derived from post-GC cells. Despite the typically good outcomes of GCB-DLBCL, increased UCHL1 identifies a subgroup with early relapses independent of MYC expression, suggesting biological diversity in this subset of disease. Consistent with this, forced Uchl1 overexpression had a substantial impact on gene expression in GC B cells including pathways of cell cycle progression, cell death and proliferation, and DNA replication. These data demonstrate a novel role for UCH-L1 outside of the nervous system and suggest its potential use as a biomarker and therapeutic target in DLBCL.


Figures

Figure 1
Figure 1
UCHL1 expression is highest in GCB-derived lymphomas. (A,C) The expression of UCHL1 as reflected in RNA microarray data are shown for a series of 215 cases of mature B-cell lymphoma classified based on molecular classification as either mBL, non-mBL, or intermediate (A) or cell-of-origin gene expression classification including both mBL and non-mBL cases (C). (B,D) Expression of MYC (B) or BCL2 (D) in cases from panel A classified based on the level of UCHL1 as shown. Data were extracted from GSE4475 and analyzed using the R2: Genomics Analysis and Visualization Platform (http://r2.amc.nl). All P values were calculated using the Student t test.
Figure 2
Figure 2
UCH-L1 is specifically induced in GCBs. (A) The expression of UCHL1 as reflected in RNA microarray data are shown for the indicated purified human B-cell subsets. Data extracted from GSE2350. (B) Formalin-fixed paraffin-embedded human reactive lymph node specimens were stained for UCH-L1 (brown). Bar: 500 μm (left), 200 μm (right). (C) Formalin-fixed paraffin-embedded human tonsil sections were stained with the indicated. Bar: 200 μm. (D) Quantitative real-time PCR for murine Uchl1 was performed on complementary DNA generated from GC or non-GCBs purified from wild-type mice (n = 3 each); *P < .05. (E) Extracts were prepared from the indicated purified B-cell subsets (n = 2 each), and samples were immunoblotted for the indicated proteins. Histone H2B is included as a loading control. Microscopy images were obtained with an Olympus AX70 microscope with a DP71 camera.
Figure 3
Figure 3
Transgenic UCH-L1 synergizes with deregulated BCL6 in the development of B-cell lymphoma. (A) Representative histology of lymphomas observed in Uchl1Tg/IμHABCL6 mice. Formalin-fixed paraffin-embedded sections were stained with hematoxylin and eosin (top 2 rows) or immunohistochemistry (bottom row) with antibodies against the indicated antigens. Bar: 1000 μm (top row), 100 μm (middle row), 400 μm (bottom row), 100 μm (inset, bottom row). Microscopy images were obtained with an Olympus AX70 microscope with a DP71 camera. (B) The incidence of lymphomas is shown for the indicated mouse strains. *P < .05 as determined with the χ2 test; N = 29 mice for each genotype. (C-D) Immunoblots were performed on extracts from lymphomas as in panel A. Comparison is made with purified B cells (C), purified GCBs (D) from the spleens of wild-type littermates, or the indicated GCB-DLBCL cell lines (D). (E) Genomic DNA was extracted from the indicated samples and subjected to PCR amplification of immunoglobulin variable regions. The arrows denote unique monoclonal bands not seen in the polyclonal B cells.
Figure 4
Figure 4
High levels of UCHL1 mark patients with non-mBL at high risk for relapse. Overall survival is plotted using the Kaplan-Meier method for 92 patients with non-mBL stratified based on the level of UCHL1 mRNA as shown. Those with ABC gene expression profile and double hit (DH) lymphoma (as defined by reported fluorescence in situ hybridization studies for MYC, BCL2, and BCL6) were excluded as shown. Data were extracted from GSE4475 and analyzed using the R2: Genomics Analysis and Visualization Platform (http://r2.amc.nl). P value was determined using the Mantel-Cox log-rank test.
Figure 5
Figure 5
High levels of UCHL1 predict poor outcomes in patients with GCB-DLBCL treated with R-CHOP. (A-C) PFS for all patients with paired gene expression and survival data from the International DLBCL Rituximab-CHOP Consortium Program study (n = 470) (A), those with ABC-DLBCL (n = 199) (B), and GCB-DLBCL (n = 227) (C). UCHL1 was stratified with LO (=0%-80%) HI (=80%-100%) based on the entire cohort. P values were determined using the Mantel-Cox log-rank test. (D) The level of MYC mRNA is shown for the entire cohort from panel A including those lacking survival data (n = 498). UCHL1 stratification as in panels A-C. P value was determined using the Student t test. (E-F) PFS of patients with GCB-DLBCL (n = 227) with paired gene expression and survival data based on the stratification of UCHL1 and MYC. UCHL1 was stratified as above. MYC was stratified with LO (=0%-75%) and HI (=75%-100%). Data extracted from GSE31312 and analyzed using the R2: Genomics Analysis and Visualization Platform (http://r2.amc.nl).
Figure 6
Figure 6
UCH-L1 promotes AKT phosphorylation and cell survival in DLBCL. (A) The expression of UCHL1 is shown for a series of GCB-DLBCL cell lines. The cell lines used in this study are shown in red (UCHL1 HI) and green (UCHL1 LO). Data extracted from the CCLE (GSE36133) and analyzed using the R2: Genomics Analysis and Visualization Platform (http://r2.amc.nl). (B) Immunoblot analysis of the cell lines from panel A. Histone H2B is included as a loading control. (C-D) The cell lines from panel A were transduced with lentivirus’ encoding the indicated Dox-inducible shRNA constructs. Cell viability (C) was monitored using the MTS assay. The level of UCH-L1 (D) is shown for the WSU-CLCL2 cell line. shNS, control nonsilencing; shUCHL1, n = 3 independent UCHL1 targeting shRNA constructs. Similar results were obtained in SU-DHL6 cells. (E) The indicated cell lines were transduced with the indicated shRNA constructs as in panels C and D and the resulting extracts were analyzed with antibodies against the indicated proteins. Dox was included where indicated.
Figure 7
Figure 7
Transgenic UCH-L1 leads to altered gene expression in GCBs. (A-B) Gene expression profiling was performed using RNA extracted from GCBs from mice of the indicated genotypes (n = 3 each). (A) A heat map represents the relative expression of the 100 most discriminatory genes. (B) The 60 most altered genes (30 up, 30 down; P < .01) are shown with the mean fold-change indicated. (C) The list of genes from panel B were correlated with UCHL1 levels in 215 mature B-cell lymphomas extracted from GSE4475 and analyzed using the R2: Genomics Analysis and Visualization Platform (http://r2.amc.nl). The graph represents the Pearson correlation R2 value and the corresponding P value for each gene. The hatched area on the left represents a P > .05. Genes with the most significant correlation are indicated in red. (D) IPA was performed using the list of differentially expressed genes (P < .05) from panel A. The graph represents the P values of the top 5 altered biological processes. (E) The expression ratio (mean ± SE) of the list of top upregulated and downregulated genes from panel B in purified mouse light zone (LZ) or dark zone (DZ) cells (GSE38696) is shown. The P value was calculated with the Student t test. (F) Formalin-fixed paraffin-embedded spleen sections from mice of the indicated genotypes were stained using the TUNEL assay. The graph represents the mean ± SE number of TUNEL-positive cells from 10 randomly selected high-power field (hpf) images from each of 3 mice per genotype (total of 30 hpf per genotype). P values were calculated with the Student t test. (G) Mice of the indicated genotypes (n = 6 each) were immunized with NP-CGG and the level of NP-specific IgG1 was determined by ELISA on the indicated days. *P < .05 (Student t test) for the comparison between IμHABCL6 and any of the other genotypes.

Comment in

  • UCH-L1 in DLBCL: marker or target?
    Pagano JS, Shackelford J. Pagano JS, et al. Blood. 2016 Mar 24;127(12):1524-5. doi: 10.1182/blood-2016-01-689984. Blood. 2016. PMID: 27013211 Free PMC article.

Similar articles

Cited by

References

    1. Alizadeh AA, Eisen MB, Davis RE, et al. Distinct types of diffuse large B-cell lymphoma identified by gene expression profiling. Nature. 2000;403(6769):503–511. - PubMed
    1. Cairo MS, Gerrard M, Sposto R, et al. FAB LMB96 International Study Committee. Results of a randomized international study of high-risk central nervous system B non-Hodgkin lymphoma and B acute lymphoblastic leukemia in children and adolescents. Blood. 2007;109(7):2736–2743. - PMC - PubMed
    1. Friedberg JW. Relapsed/refractory diffuse large B-cell lymphoma. Hematology Am Soc Hematol Educ Program. 2011;2011:498–505. - PubMed
    1. Ovaa H, Kessler BM, Rolén U, Galardy PJ, Ploegh HL, Masucci MG. Activity-based ubiquitin-specific protease (USP) profiling of virus-infected and malignant human cells. Proc Natl Acad Sci USA. 2004;101(8):2253–2258. - PMC - PubMed
    1. Hussain S, Foreman O, Perkins SL, et al. The de-ubiquitinase UCH-L1 is an oncogene that drives the development of lymphoma in vivo by deregulating PHLPP1 and Akt signaling. Leukemia. 2010;24(9):1641–1655. - PMC - PubMed

Publication types

MeSH terms

Substances

Associated data