. 2016 Feb 15:127:387-408.
doi: 10.1016/j.neuroimage.2015.12.009. Epub 2015 Dec 17.

Patch-based augmentation of Expectation-Maximization for brain MRI tissue segmentation at arbitrary age after premature birth

Affiliations

Patch-based augmentation of Expectation-Maximization for brain MRI tissue segmentation at arbitrary age after premature birth

Mengyuan Liu et al. Neuroimage. .

Abstract

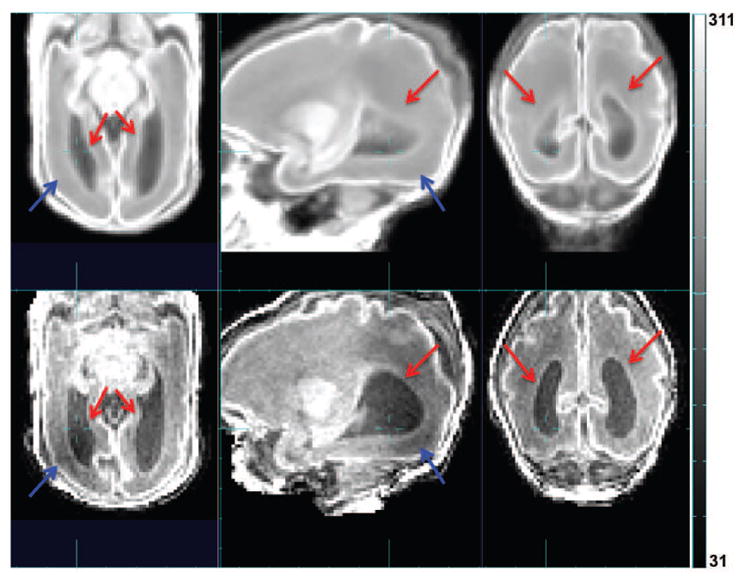
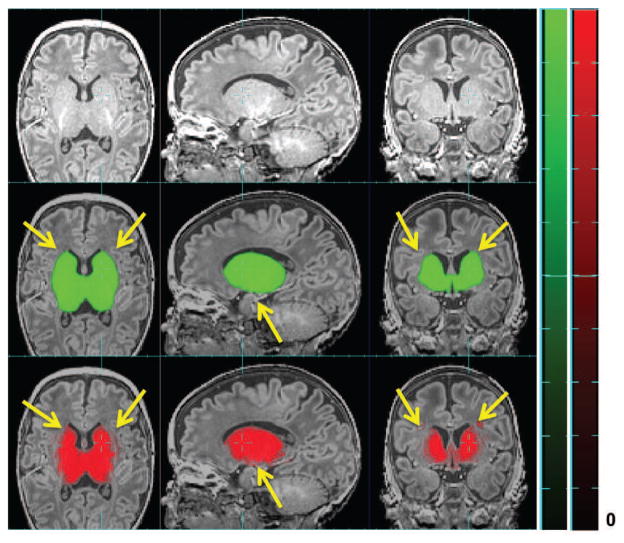
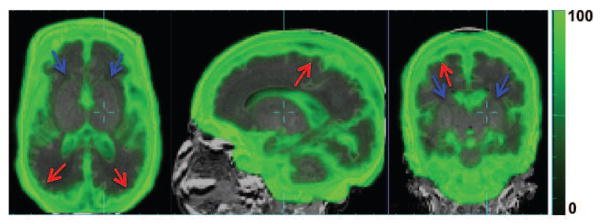
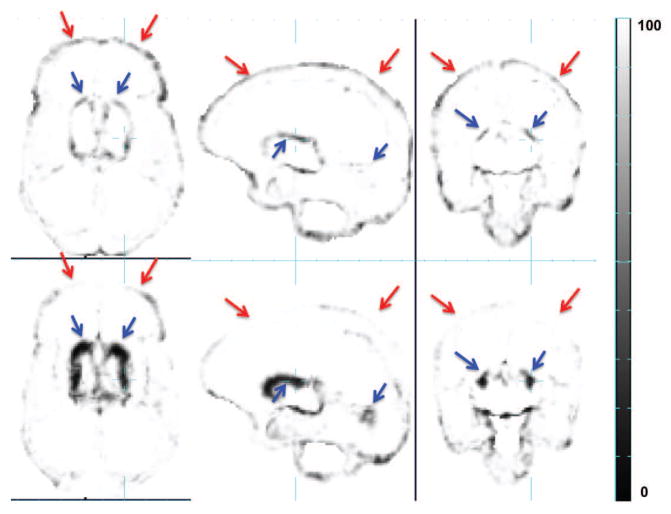
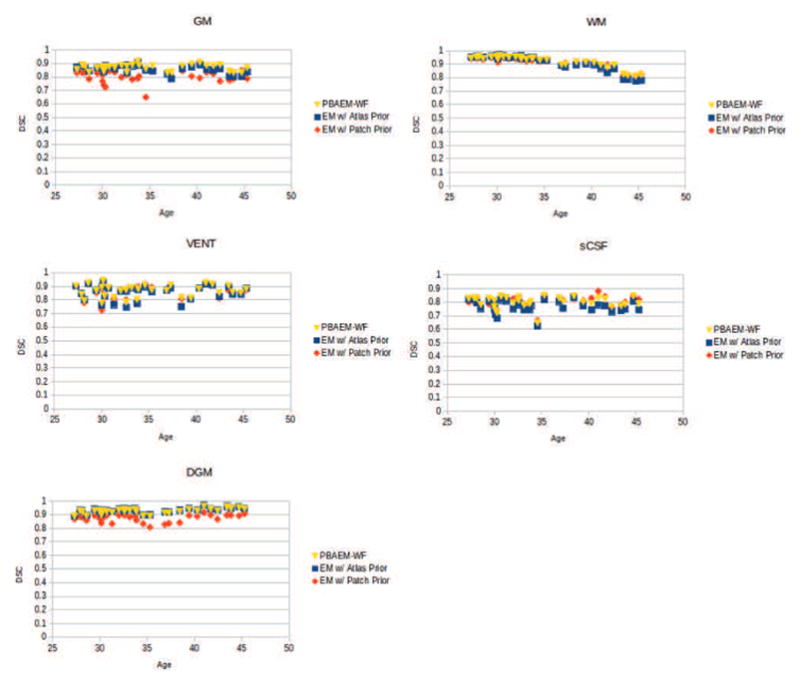
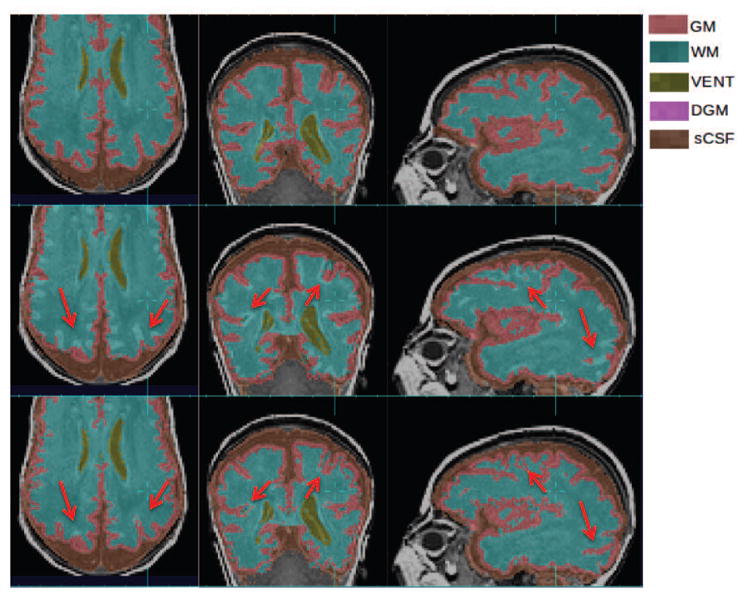
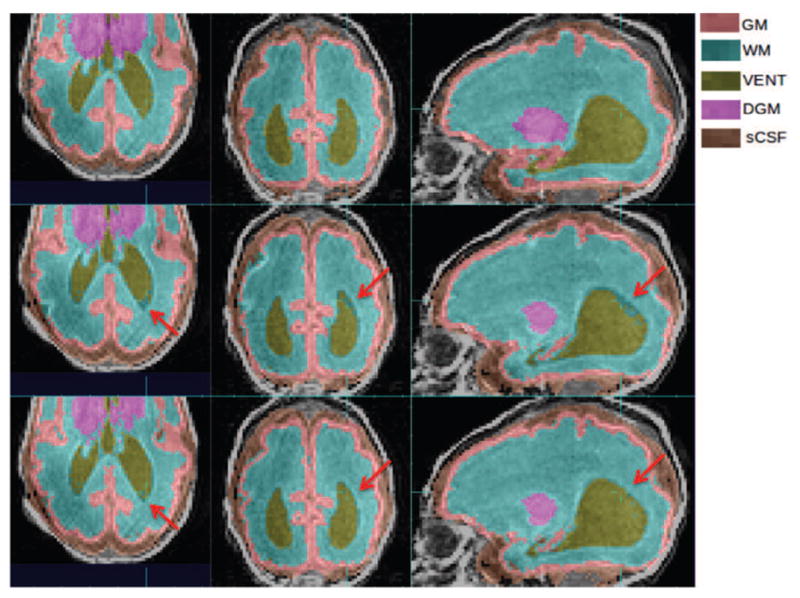
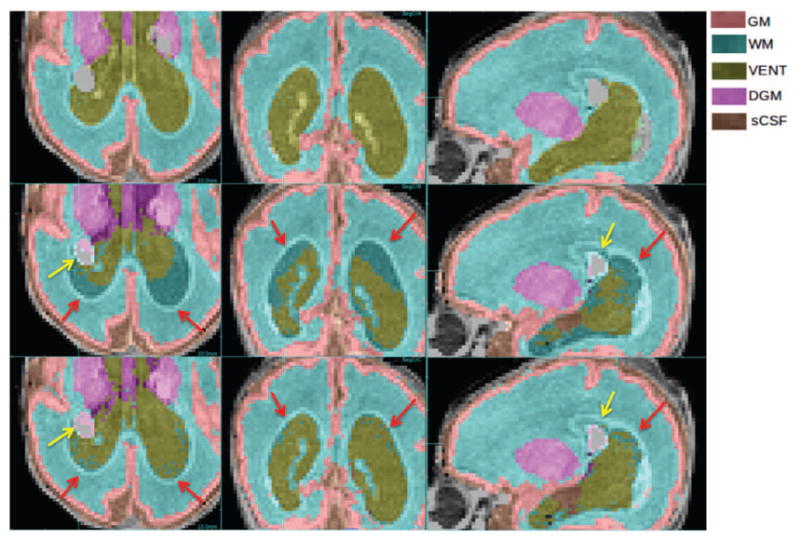
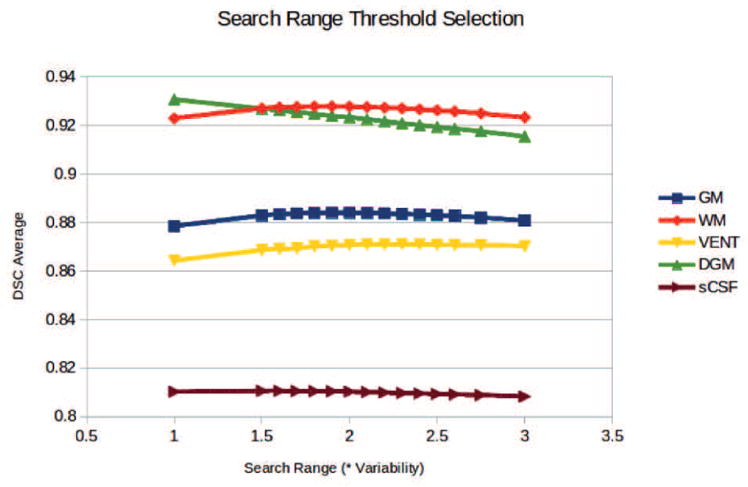
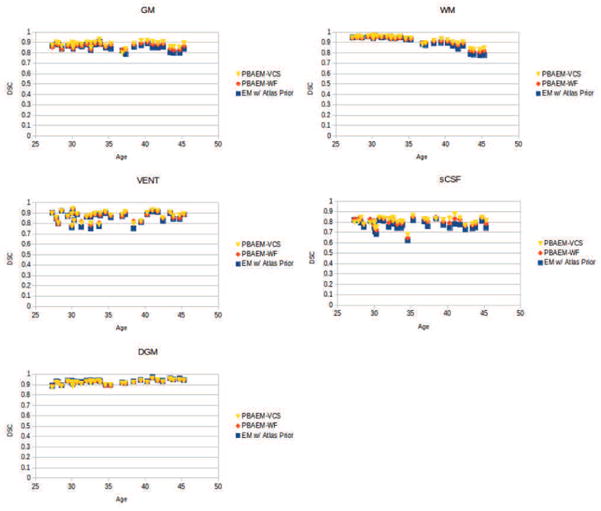
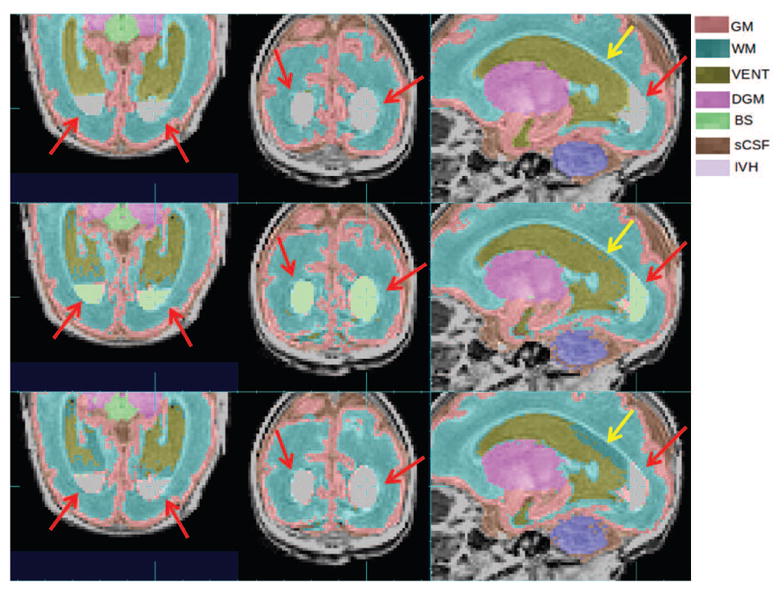
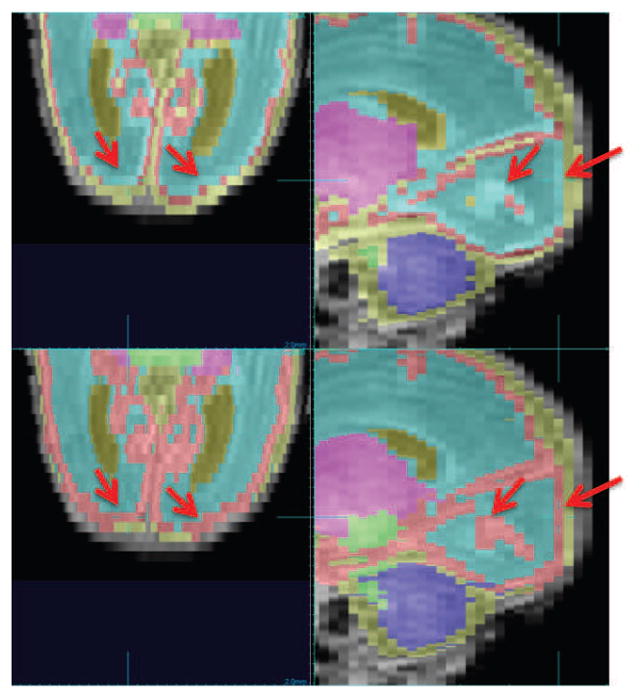
Accurate automated tissue segmentation of premature neonatal magnetic resonance images is a crucial task for quantification of brain injury and its impact on early postnatal growth and later cognitive development. In such studies it is common for scans to be acquired shortly after birth or later during the hospital stay and therefore occur at arbitrary gestational ages during a period of rapid developmental change. It is important to be able to segment any of these scans with comparable accuracy. Previous work on brain tissue segmentation in premature neonates has focused on segmentation at specific ages. Here we look at solving the more general problem using adaptations of age specific atlas based methods and evaluate this using a unique manually traced database of high resolution images spanning 20 gestational weeks of development. We examine the complimentary strengths of age specific atlas-based Expectation-Maximization approaches and patch-based methods for this problem and explore the development of two new hybrid techniques, patch-based augmentation of Expectation-Maximization with weighted fusion and a spatial variability constrained patch search. The former approach seeks to combine the advantages of both atlas- and patch-based methods by learning from the performance of the two techniques across the brain anatomy at different developmental ages, while the latter technique aims to use anatomical variability maps learnt from atlas training data to locally constrain the patch-based search range. The proposed approaches were evaluated using leave-one-out cross-validation. Compared with the conventional age specific atlas-based segmentation and direct patch based segmentation, both new approaches demonstrate improved accuracy in the automated labeling of cortical gray matter, white matter, ventricles and sulcal cortical-spinal fluid regions, while maintaining comparable results in deep gray matter.

Keywords: Atlas-based; Expectation–Maximization; MRI; Patch-based; Premature neonates; Segmentation; Spatio-temporal.


Figures

Figure 1
Figure 1
Comparison between the age-specific average image warped into subject space (upper row) and the subject MR image (lower row). Red arrow: difference in ventricle size and shape. Blue arrow: abnormal white matter intensity.
Figure 2
Figure 2
Illustration of synthesizing atlas-based tissue probability from the spatio-temporal atlas.
Figure 3
Figure 3
Illustration of patch-based local search adapted for using with spatio-temporal atlas. (a) For the patch Hv centered at voxel v, the local search is conducted within the search neighborhood N(v) in ISUBJATLAS and weight w(u, v) between each possible pair of patches is computed. (b) Tissue probability of each possible patch within N(u) is extracted from the PSUBJATLAS and used to compute the patch-based tissue probability of voxel v.
Figure 4
Figure 4
Illustration of transforming voxel locations from SUBJ space to REF space and determining whether voxels lie in the search range (blue elipsoid) in the REF space. Blue cross: voxel to be labeled; Green cross: voxel inside the search range of voxel to be labeled; Red cross: voxel outside the search range of voxel to be labeled.
Figure 5
Figure 5
Average DSC of GM, WM, VENT, DGM and sCSF using PBAEM-WF automated segmentation with different sets of patch search parameters. Patch size of 3 × 3 × 3 voxels or 5 × 5 × 5 voxels is indicated by solid or dashed line. Neighborhood ratios correspond to fraction of total brain volume. An optimal patch size of 3 × 3 × 3 and a search range of 0.0025 were chosen for optimal performances in cortical regions.
Figure 6
Figure 6
Examples of running priors. From left to right: Raw MR image (column 1), atlas-based ( PSUBJATLAS) (column 2), patch-based (column 3) and PBAEM (column 4) tissue probability map of, from top to bottom, GM, WM, VENT, DGM and sCSF of one subject as an example. Tissue probability on a scale 0 – 100. Red arrows: PBAEM tissue probability is more accurate than the atlas-based one; Blue arrows: PBAEM tissue probability is more accurate than the patch-based one.
Figure 7
Figure 7
Raw MR image overlaid (top row) with atlas-based tissue probability map ( PSUBJATLAS) (middle row) and patch-based (bottom row) tissue probability map of GM in one subject. Here tissue probability is scaled by 100. Yellow arrows point where patch-based TP is more accurate than atlas-based one.
Figure 8
Figure 8
Raw MR image overlaid (top row) with atlas-based tissue probability map ( PSUBJATLAS) (middle row) and patch-based (bottom row) tissue probability map of VENT in one subject with ventriculomegaly. Here tissue probability is scaled by 100. Yellow arrows point where patch-based TP is more accurate than atlas-based one.
Figure 9
Figure 9
Raw MR image overlaid (top row) with atlas-based tissue probability map ( PSUBJATLAS) (middle row) and patch-based (bottom row) tissue probability map of DGM in one subject. Here tissue probability is scaled by 100. Yellow arrows point where patch-based TP is less accurate than atlas-based one.
Figure 10
Figure 10
Age-specific Patch Contribution (PC) map (green) overlaid over raw MR image (grayscale). PC values are on a scale of 0–100%. Red arrows: high PC values in cortical regions at sCSF/GM and GM/WM boundaries. Blue arrow: low PC values at WM/DGM boundary and inside WM, DGM.
Figure 11
Figure 11
Comparison between Voxel Label Accuracy (VLA) maps resulting from EM segmentation using atlas-based (top row) and patch-based (bottom row) tissue probabilities as running priors. VLA values are on a scale of 0–100%. Red arrows: patch-based tissue probabilities is more accurate at sCSF/GM and GM/WM boundaries; Blue arrows: atlas-based tissue probabilities is more accurate at DGM/WM boundaries.
Figure 12
Figure 12
DSCs of five tissue classes of 31 individual scans plotted with age.
Figure 13
Figure 13
Improvements of GM and WM segmentation in a subject where the cortex is significantly more folded than the age-specific average template. Top row: manual segmentation; Middle row: atlas-based automatic segmentation (DSC: GM 0.7580, WM 0.8882); Bottom row: PBAEM (DSC: GM 0.8477 with improvement of 0.0897, WM 0.9151 with improvement of 0.0269). Red arrows: GM-WM boundaries where PBAEM was proved to generate more accurate labeling than atlas-based approach.
Figure 14
Figure 14
Improvements of VENT segmentation in a subject where VENT is significantly larger than the age-specific average template. Top row: manual segmentation; Middle row: atlas-based automatic segmentation (DSC: VENT: 0.9191); Bottom row: PBAEM (DSC: VENT 0.9364 with improvement of 0.0173).Red arrows: VENT boundaries where PBAEM was found to generate more accurate labeling than the atlas-based approach.
Figure 15
Figure 15
Labeling of abnormal anatomy not represented in the atlas. Comparison of manual labeling (top row), conventional atlas-based (middle row) and PBAEM (bottom row) automated labeling in a case of severe ventriculomegaly and Grade 2 IVH. Red arrows: PBAEM approach produced a more valid and accurate labeling of the enlarged VENT; Yellow arrows: IVH was partially labeled as BG. DSC: Atlas-based: GM 0.88, WM 0.90, VENT 0.64, DGM 0.82, sCSF 0.80; PBAEM: GM 0.88, WM 0.93,VENT 0.83, DGM 0.84, SCSF 0.82.
Figure 16
Figure 16
Average (left) and standard deviation (right) of DSC of 31 subjects using different search range threshold.
Figure 17
Figure 17
Age-specific variability maps shown as 2D ellipses overlying on average MR image in REF space. 1st row: 30.0 GW; 2nd row: 35.0 GW; 3rd row: 40.0 GW; 4th row: 45.0 GW. Red arrows: dramatic variability range change with age.
Figure 18
Figure 18
Comparison of GM tissue probabilities between atlas-based, patch-based with globally and locally set search ranges. Red arrows: SVS patch-based TP better than patch-based with global search range; Yellow arrows: SVS patch-based TP superior to the atlas-based TP.
Figure 19
Figure 19
Comparison of DGM tissue probabilities between atlas-based, patch-based with globally and locally set search ranges. Red arrows: SVS patch-based TP superior to the patch-based TP with global search range.
Figure 20
Figure 20
Improvements of GM and WM segmentation in a subject where the cortex is significantly more folded than the age-specific average template. Top row: manual segmentation; Middle row: PBAEM-WF (DSC: GM 0.8946, WM 0.9153); Bottom row: PBAEM-WF (DSC: GM 0.9171 with improvement of 0.0225, WM 0.9330 with improvement of 0.0177). Red arrows: Cortical GM-WM boundaries where PBAEM-SVS was proved to generate more accurate labeling than PBAEM-WF approach; Blue arrows: corpus callosum
Figure 21
Figure 21
DSCs of five tissue classes of 31 individual scans plotted with age. Comparison is shown between segmentation performances of conventional atlas-based EM approach, PBAEM-WF and PBAEM-SVS.
Figure 22
Figure 22
Comparison of PBAEM-WF and PBAEM-SVS on an abnormal scan with IVH. Red arrow: IVH mislabeled as BS by using PBAEM-WF while correctly labeled as BG by using PBAEM-SVS; Yellow arrows: mislabeled VENT as WM by PBAEM-SVS while correctly labeled by PBAEM-WF. DSC: Atlas-based: GM 0.84, WM 0.91, VENT 0.81, DGM 0.94, sCSF 0.76; PBAEM: GM 0.84, WM 0.91, VENT 0.84, DGM 0.93, sCSF 0.83.
Figure 23
Figure 23
Comparison of segmentation protocols between NeoBrainS12 [29] (top row) and ours (bottom row). Red arrow: cortical GM where two tracing protocols differ.

Similar articles

Cited by

References

    1. Aljabar P, Heckemann RA, Hammers A, Hajnal JV, Rueckert D. Multi-atlas based segmentation of brain images: atlas selection and its effect on accuracy. NeuroImage. 2009;46:726–738. - PubMed
    1. Anbeek P, Isgum I, van Kooij BJM, Mol CP, Kersbergen KJ, Groenendaal F, Viergever MA, de Vries LS, Benders MJNL. Automatic segmentation of eight tissue classes in neonatal brain MRI. PLoS ONE. 2013;8(12):e81895. - PMC - PubMed
    1. Artaechevarria X, Munoz-Barrutia A, Ortizde Solórzano C. Combination strategies in multi-atlas image segmentation: Application to brain mr data. Medical Imaging, IEEE Transactions on. 2009;28:1266–1277. - PubMed
    1. Ashburner J, Friston KJ. Unified segmentation. NeuroImage. 2005;26:839–851. http://dx.doi.org/10.1016/j.neuroimage.2005.02.018. - DOI - PubMed
    1. Asman AJ, Landman BA. Non-local statistical label fusion for multi-atlas segmentation. Medical image analysis. 2013;17:194–208. - PMC - PubMed

Publication types