. 2015 Dec 21;35(6):789-802.
doi: 10.1016/j.devcel.2015.11.015.

Progressive Differentiation and Instructive Capacities of Amniotic Fluid and Cerebrospinal Fluid Proteomes following Neural Tube Closure

Affiliations

Progressive Differentiation and Instructive Capacities of Amniotic Fluid and Cerebrospinal Fluid Proteomes following Neural Tube Closure

Kevin F Chau et al. Dev Cell. .

Abstract

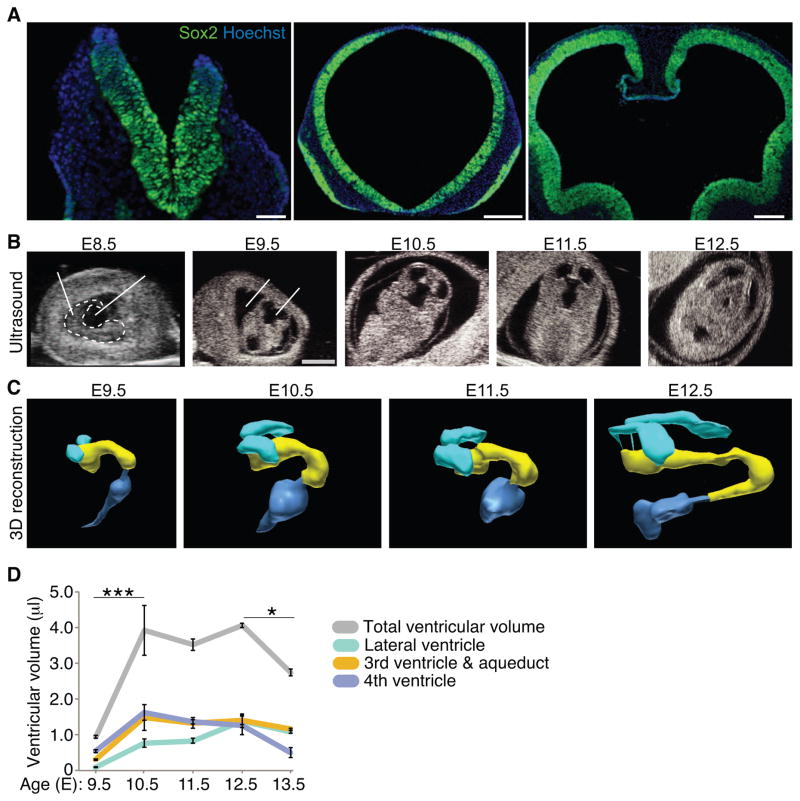
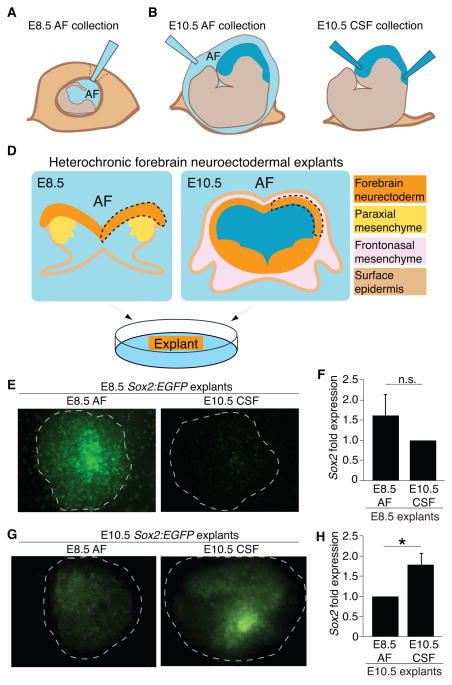
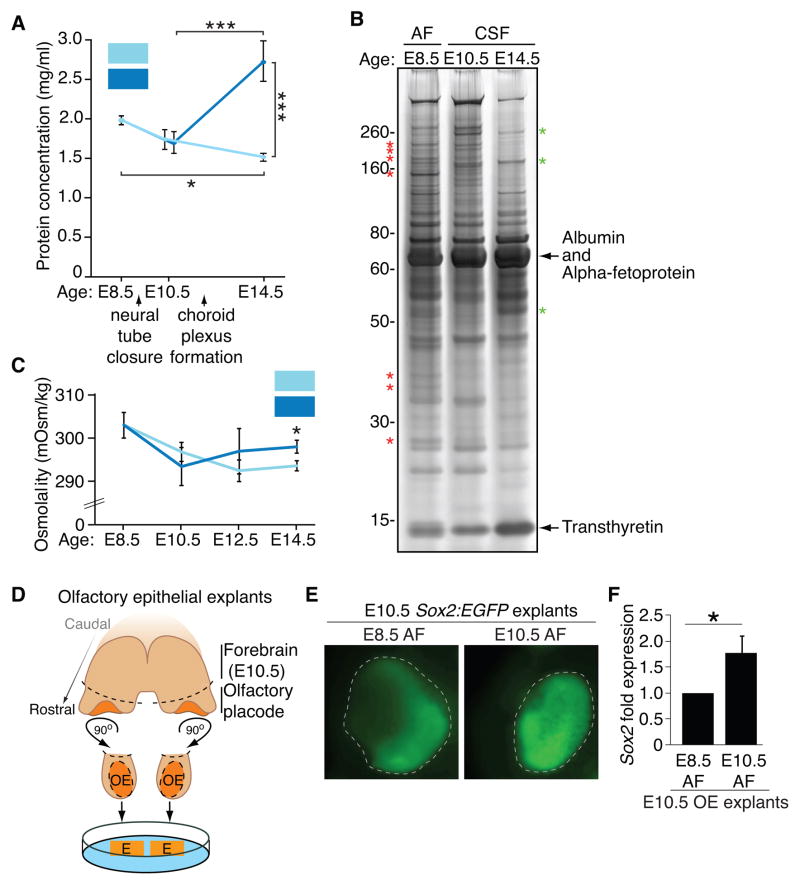
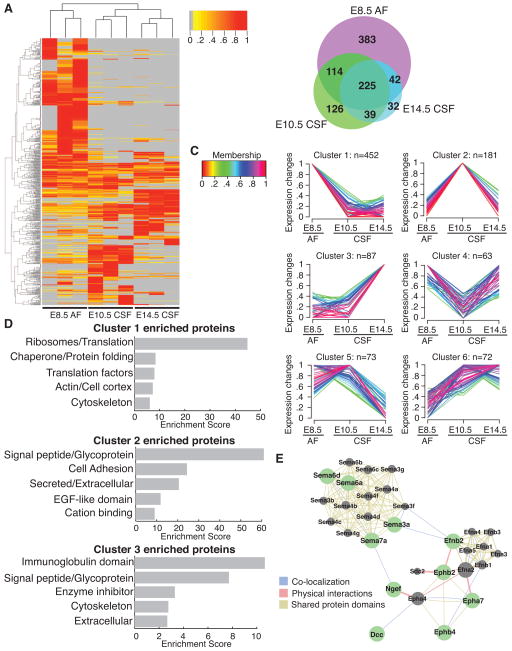
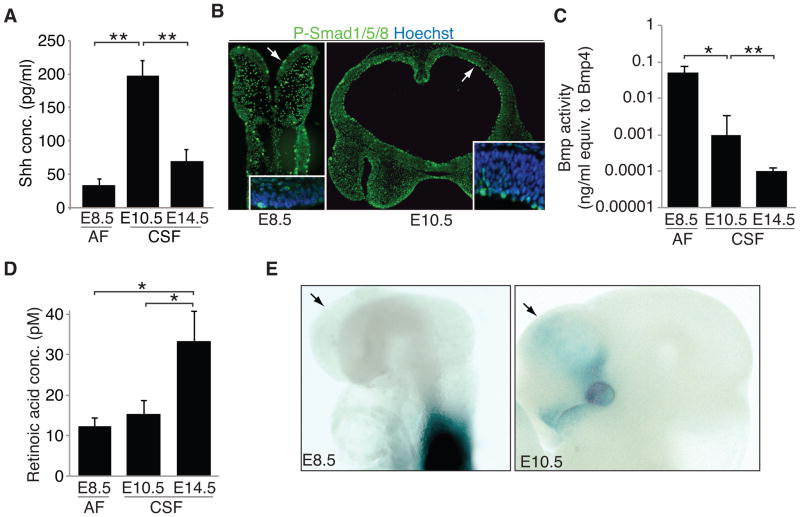
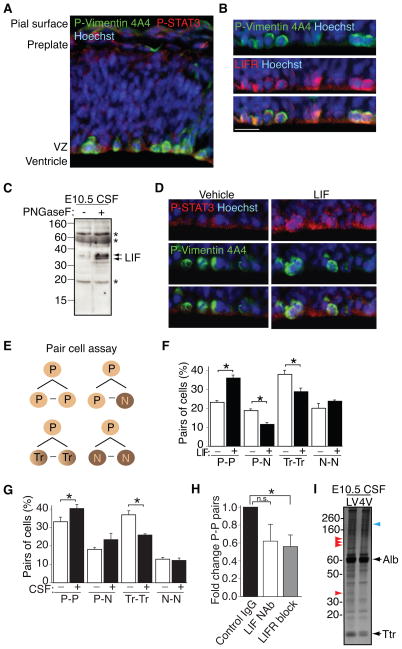
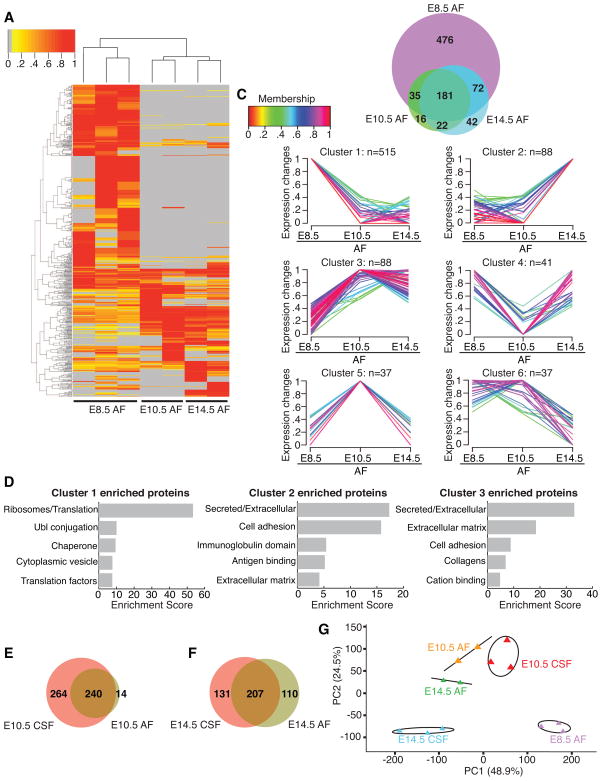
After neural tube closure, amniotic fluid (AF) captured inside the neural tube forms the nascent cerebrospinal fluid (CSF). Neuroepithelial stem cells contact CSF-filled ventricles, proliferate, and differentiate to form the mammalian brain, while neurogenic placodes, which generate cranial sensory neurons, remain in contact with the AF. Using in vivo ultrasound imaging, we quantified the expansion of the embryonic ventricular-CSF space from its inception. We developed tools to obtain pure AF and nascent CSF, before and after neural tube closure, and to define how the AF and CSF proteomes diverge during mouse development. Using embryonic neural explants, we demonstrate that age-matched fluids promote Sox2-positive neurogenic identity in developing forebrain and olfactory epithelia. Nascent CSF also stimulates SOX2-positive self-renewal of forebrain progenitor cells, some of which is attributable to LIFR signaling. Our Resource should facilitate the investigation of fluid-tissue interactions during this highly vulnerable stage of early brain development.


Figures

Figure 1
Figure 1. Expansion of the mouse ventricular system following neural tube closure
(A) Sox2-positive neuroepithelial cells (green) contact the AF before neural tube closure at E8.5 (left panel), and the nascent CSF following neural tube closure at E9.5 (middle panel) and E10.5 (right panel). Nuclei counterstained with Hoechst. Scale bars: 50μm (left panel); 200μm (middle, right panels). (B) Representative ultrasound images of developing mouse (E8.5-E12.5). Dashed white line (left panel) outlines embryo. Scale bar: 2mm. (C) 3D reconstruction of ventricular system from ultrasound images sequences captured in (B) from E9.5-E12.5 with the following color representation: turquoise: lateral ventricles; yellow: third ventricle and aqueduct; dark blue: fourth ventricle. (D) Quantification of ventricle size based on 3D reconstructions of ultrasound image sequences (B, C, data not shown; ventricular volume (μl) represented as mean ± SEM: Lateral ventricles: E9.5 = 0.09 ± 0.02; E10.5 = 0.77 ± 0.12; E11.5 = 0.83 ± 0.07; E12.5 = 1.39 ± 0.19; E13.5 = 1.08 ± 0.05; Third ventricle and aqueduct: E9.5 = 0.31 ± 0.03; E10.5 = 1.48 ± 0.37; E11.5 = 1.33 ± 0.15; E12.5 = 1.40 ± 0.11; E13.5 = 1.16 ± 0.03; Fourth ventricle: E9.5 = 0.54 ± 0.04; E10.5 = 1.63 ± 0.22; E11.5 = 1.36 ± 0.06; E12.5 = 1.27 ± 0.27; E13.5 = 0.50 ± 0.14; Total ventricular volume: E9.5 = 0.94 ± 0.04; E10.5 = 3.92 ± 0.70; E11.5 = 3.51 ± 0.16; E12.5 = 4.06 ± 0.06; E13.5 = 2.74 ± 0.09; n = 3; ANOVA statistical analyses of total ventricular volume represented as (*) p < 0.05 and (***) p < 0.0001; n=3).
Figure 2
Figure 2. Heterochronic explants show tissue-fluid age matching promotes Sox2-positive progenitors
Schematics of (A) E8.5 AF collection; (B) E10.5 AF collection; (C) E10.5 CSF collection; (D) Heterochronic forebrain neuroectodermal explant dissections: isolated neuroepithelium (dashed line) placed on membrane with ventricular surface down contacting AF or CSF. (E) E8.5 explants grown on E8.5 AF or E10.5 CSF. Sox2:EGFP suggests age-matched fluid best supports neural stem cell identity (E8.5 explant with E8.5 AF [n=8] or with E10.5 CSF [n=8]). (F) qPCR of explants cultured as in (E) suggest that E8.5 AF more favorably supports E8.5 explants compared to E10.5 explants. (E8.5 AF = 1.63 ± 0.49; E10.5 CSF = 1.00; n=3 of 4 pooled explants each, p = n.s., Mann-Whitney). Two experiments (n=2) of 4 pooled explants each were excluded from statistical analyses. While E8.5 AF supported these E8.5 explants, the experiments had undetectable Sox2 expression in the E10.5 CSF condition, suggesting a role for age-matched AF and CSF in cell survival and demonstrating experimental variability at this age (see also Discussion). (G) E10.5 explants grown on E8.5 AF [n=9] or with E10.5 CSF [n=11]. Note increased GFP expression for age-matched CSF vs. non-age-matched CSF experiments. (H) qPCR of explants cultured as in (G) show that E10.5 CSF more favorably promotes Sox2 expression in E10.5 explants compared to E8.5 AF (E8.5 AF = 1.00; E10.5 CSF = 1.80 ± 0.29; n=3 of 4 pooled explants each, p < 0.05, Mann-Whitney). See also Figure S1.
Figure 3
Figure 3. Early AF and CSF undergo dynamic changes, and age-matched AF supports olfactory placode development
(A) Total protein concentration of AF decreases from E8.5–E14.5; total CSF protein concentration increases from E10.5-E14.5 (mean protein concentration [mg/ml] ± SEM: E8.5 AF = 1.99 ± 0.06; E10.5 AF = 1.73 ± 0.13; E10.5 CSF = 1.70 ± 0.14; E14.5 AF = 1.51 ± 0.05; E14.5 CSF = 2.73 ± 0.26; n = 4 for all except E10.5 CSF, n=5; ANOVA; (*) p < 0.05 (***) p < 0.0001). (B) Silver stain of 1 μl AF or CSF suggests highest protein complexity in E8.5 AF. Asterisks denote representative proteins enriched in E8.5 AF (red) or E14.5 CSF (green). (C) Osmolality of CSF decreases from E8.5-E10.5, and then increases. Osmolality of AF decreases from E8.5-E14.5 (mean osmolality [mOsm/Kg] ± SEM: E8.5 AF = 303.0 ± 3.0 (n=3); E10.5 AF = 296.8 ± 2.2 (n=5); E10.5 CSF = 293.4 ± 4.4 (n=5); E12.5 AF = 292.5 ± 2.5 (n=4); E12.5 CSF = 297.0 ± 5.3 (n=3); E14.5 AF = 293.7 ± 1.2; E14.5 CSF = 298.0 ± 1.5; n=3; ANOVA, p < 0.05). Osmolality of E14.5 CSF is higher compared to E14.5 AF (t-test, (*) p < 0.05). (D) Schematic of E10.5 olfactory epithelium dissections: pairs of bilateral olfactory epithelial explants (denoted by dashed lines) placed on porous membrane contacting the AF. (E) E10.5 olfactory epithelial explants grown on E8.5 or E10.5 AF. Sox2:EGFP shows age-matched fluid most favorably supports neural stem cell identity (n=4). (F) qPCR of E10.5 OE explants cultured as in (E) show E10.5 AF more favorably promotes Sox2 expression in E10.5 OE explants compared to E8.5 AF (E8.5 AF=1.00; E10.5 AF = 1.78 ± 0.32; n=3 of 4 pooled explants each, p < 0.05, Mann-Whitney).
Figure 4
Figure 4. Mass spectrometry reveals dynamic changes in CSF proteome as it differentiates from E8.5 AF to E14.5 CSF
(A) Heatmap of normalized spectral counts reveals differential protein availability between E8.5 AF, E10.5 CSF and E14.5 CSF. Unsupervised hierarchical clustering grouped the three biological replicates of each fluid together. Each replicate contains 30μg total CSF protein pooled from multiple embryos. Spectral counts were scaled such that for each protein, the sample with the highest spectral count is set as one. Grey indicates undetected protein (i.e. 0 spectral counts). Proteins with peptides detected in at least two samples were included in the heatmap. (B) Total of 961 proteins were identified across all samples. Venn diagram depicts numbers of proteins exclusive to or shared between distinct fluid compartments. (C) Unsupervised clustering using GProX partitioned proteins into 6 clusters, revealing different temporal expression patterns for each cluster. Number of proteins in each cluster (n) is indicated above each graph. 33 proteins showed less than two-fold difference in availability between the fluids, and were not included in clustering. Membership indicates how well proteins fit into the general profile of cluster. (D) Functional annotation clustering of proteins in GProX clusters 1, 2 and 3 using DAVID. The top five enriched functional clusters are shown. (E) Proteins in GProX cluster 2 that are members of the axon guidance pathway were subjected to network analysis using GeneMania (Warde-Farley et al., 2010). Green nodes represent proteins members of cluster 2, whereas grey nodes represent related proteins. Lines connecting the nodes denote the relationship between the proteins. See also Table S1 and Figure S1.
Figure 5
Figure 5. Canonical signaling activities present in AF and nascent CSF
(A) Shh levels measured in E8.5 AF, E10.5 CSF, and E14.5 CSF by ELISA peaked in E10.5 CSF (mean Shh concentration [pg/ml] ± SEM: E8.5 AF = 31.13 ± 4.34; E10.5 CSF = 197.58 ± 12.71; E14.5 CSF = 70.68 ± 14.25). (B) P-SMAD 1/5/8/-positive staining progenitor cells along ventricular surface of E8.5 (left panel) and E10.5 (right panel) forebrain (arrows). Inset: high magnification image. Nuclei counterstained with Hoechst. (C) Bmp activity measured in E8.5 AF, E10.5 CSF, and E14.5 CSF as luciferase signal in clonally derived Bmp-sensitive cell line. Responses were compared to linear responses generated by pure Bmp4 (ng/ml) in the same cell line (data not shown). Overall Bmp activity decreases in nascent CSF (mean Bmp activity + SEM: E8.5 AF = 0.05 + 0.02; E10.5 CSF = 0.001 + 0.002; E14.5 CSF = 9.9×10⁻⁵ + 3.4×10⁻⁵; E8.5 AF vs. E10.5 CSF, t-test, p < 0.05; E10.5 CSF vs. E14.5 CSF, t-test, p < 0.01; data represent duplicate runs of biological replicates, n=3, from E8.5 AF and E14.5 CSF and n=2 for E14.5 CSF). (D) Retinoic acid (RA) activity measured in E8.5 AF, E10.5 CSF, and E14.5 CSF as luciferase signal in clonally derived RA-sensitive cell line. Responses were compared to linear responses generated by pure RA in the same cell line (data not shown). Overall RA activity increases in E14.5 CSF (mean RA activity + SEM: E8.5 AF = 12.3 + 2.0; E10.5 CSF = 15.3 + 3.4; E14.5 CSF = 33.4 + 7.4; t-test, p < 0.01; n=3; data represent duplicate runs of biological replicates, n=3, at each age. (E) RA indicator mice at E8.5 (left panel) with open neural tube and E10.5 (right panel) with closed neural tube. Arrows: presumptive, developing forebrain. RA signaling is not detected in the forebrain neuroectoderm of the open neural tube at E8.5. Signaling in the somites and spinal cord reflects local RA production by the somites (Stavridis et al., 2010; Vermot et al., 2005). At E10.5, RA signaling activity in the forebrain and head is modest, confined to the ventro-lateral forebrain, eye and nose, all reflecting local neural crest mesenchyme sources of RA (Haskell and LaMantia, 2005; LaMantia et al., 1993).
Figure 6
Figure 6. Nascent CSF promotes signaling and self-renewal in progenitor cells
(A) E10.5 forebrain shows P-STAT3 (red) activity in P-Vimentin-positive (green) progenitor cells along ventricular surface. Nuclei counterstained with Hoechst. (B) Higher magnification images of E10.5 forebrain show LIFR (red) expression in P-Vimentin-positive (green) progenitor cells along ventricular surface. Nuclei counterstained with Hoechst. Scale bar, 20 μm. (C) Removal of N-linked glycans from E10.5 CSF with PNGase F reveals robust bands immunoreactive for LIF. (D) Intraventricular LIF injection (15 minutes; 200ng/ml) at E10.5 stimulates P-STAT3 (red) signaling in P-Vimentin-positive (green) progenitor cells along ventricular surface. Nuclei counterstained with Hoechst. (E) Schematic depicting potential combinations of daughter cells in pair cell assay (P – progenitor; N – neuron; Tr – transient/intermediate cell type co-expressing Sox2 and Tuj1). (F) LIF stimulates Sox2-positive self-renewal (P-P) of progenitor cells at expense of differentiating cells (P-N; Tr-Tr; identities of pairs of cells represented as mean ± SEM; P-P division: control = 23.3 ± 0.8; LIF = 35.9 ± 1.6; P-N division: control = 18.8 ± 0.9; LIF = 11.6 ± 0.9; Tr-Tr division: control = 38.0 ± 1.9; LIF = 28.8 ± 2.0; N-N division: control = 20.1 ± 2.5; LIF = 23.7 ± 0.6; n=3; p < 0.0001; ANOVA). (G) E10.5 CSF (20%) stimulates Sox2-positive self-renewal (P-P) of progenitor cells at expense of differentiating cells (data presented as above in (F)). P-P division: control = 33.3 ± 2.5; CSF = 40.2 ± 2.2; P-N division: control = 18.2 ± 0.9; CSF = 23.4 ± 3.4; Tr-Tr division: control = 36.8 ± 2.1; CSF = 26.0 ± 0.4; N-N division: control = 12.8 ± 0.8; CSF = 12.2 ± 1.3; n=3; p < 0.05; ANOVA). (H) Interference with LIF signaling in E10.5 CSF (20%) decreases the proportion of P-P division. Data presented as fold change relative to Control IgG (anti-GATA6) (Control IgG = 1.0; LIF neutralization (NAb) = 0.62 ± 0.19; LIFR block = 0.56 ± 0.13; Control vs. LIF NAb, p = n.s.; Control vs. LIFR block, p<0.05; n=3 with approximately 100 pairs counted per condition; Mann-Whitney). (I) Silver staining shows distinct protein patterns in E10.5 CSF collected from lateral vs. fourth ventricles. Arrowheads denote protein bands differentially detected in lateral ventricle CSF (red) vs. fourth ventricle CSF (blue). See also Figure S2.
Figure 7
Figure 7. Mass spectrometry reveals decreasing complexity of AF as embryo develops from E8.5 to E14.5
(A) Heatmap of normalized spectral counts reveals differential protein availability in AF between E8.5, E10.5 and E14.5. Unsupervised hierarchical clustering grouped biological replicates of each fluid together (E8.5: n=3; E10.5: n=2; E14.5: n=2). Each replicate contains 30μg total AF protein pooled from multiple embryos. Spectral counts were scaled and analyzed as in Fig. 4A. (B) Total of 844 proteins identified across all AF samples are represented as in Fig. 4B. (C) Unsupervised clustering was performed and data are presented as in Fig. 4C. 38 proteins showed less than two-fold difference in availability between the ages, and were not included in the clustering. (D) Functional annotation clustering of proteins in GProX clusters 1, 2 and 3 was performed and is presented as in Fig. 4D. (E) At E10.5, 264 and 14 proteins are exclusive to CSF and AF respectively, and 240 proteins are common to both fluid compartments. (F) By E14.5, 131 and 110 proteins are exclusive to CSF and AF respectively, and 207 proteins are shared between the two fluid compartments. (G) Principal component analysis of protein spectral counts revealed greater degree of variance between fluid compartments than between biological replicates within each compartment. E8.5 AF and E14.5 CSF were the most distinct fluid compartments, whereas E10.5 CSF, E10.5 AF and E14.5 AF were more similar to each other. PC1 and PC2 explained 48.9% and 24.5% of the total variance respectively. Ellipses and lines indicate the 95% confidence interval. See also Table S2.

References

    1. Alonso MI, Gato A, Moro JA, Barbosa E. Disruption of proteoglycans in neural tube fluid by beta-D-xyloside alters brain enlargement in chick embryos. Anat Rec. 1998;252:499–508. - PubMed
    1. Arbeille E, Reynaud F, Sanyas I, Bozon M, Kindbeiter K, Causeret F, Pierani A, Falk J, Moret F, Castellani V. Cerebrospinal fluid-derived Semaphorin3B orients neuroepithelial cell divisions in the apicobasal axis. Nat Commun. 2014;6:6366. - PubMed
    1. Arnold K, Sarkar A, Yram MA, Polo JM, Bronson R, Sengupta S, Seandel M, Geijsen N, Hochedlinger K. Sox2(+) adult stem and progenitor cells are important for tissue regeneration and survival of mice. Cell Stem Cell. 2011;9:317–329. - PMC - PubMed
    1. Bjornsson CS, Apostolopoulou M, Tian Y, Temple S. It Takes a Village: Constructing the Neurogenic Niche. Developmental Cell. 2015;32:435–446. - PMC - PubMed
    1. Chang JT, Sive H. An assay for permeability of the zebrafish embryonic neuroepithelium. J Vis Exp. 2011:e4242. - PMC - PubMed

Publication types