. 2016 Apr;71(4):964-74.
doi: 10.1093/jac/dkv416. Epub 2015 Dec 24.

A multistate tuberculosis pharmacometric model: a framework for studying anti-tubercular drug effects in vitro

Affiliations

A multistate tuberculosis pharmacometric model: a framework for studying anti-tubercular drug effects in vitro

Oskar Clewe et al. J Antimicrob Chemother. 2016 Apr.

Abstract

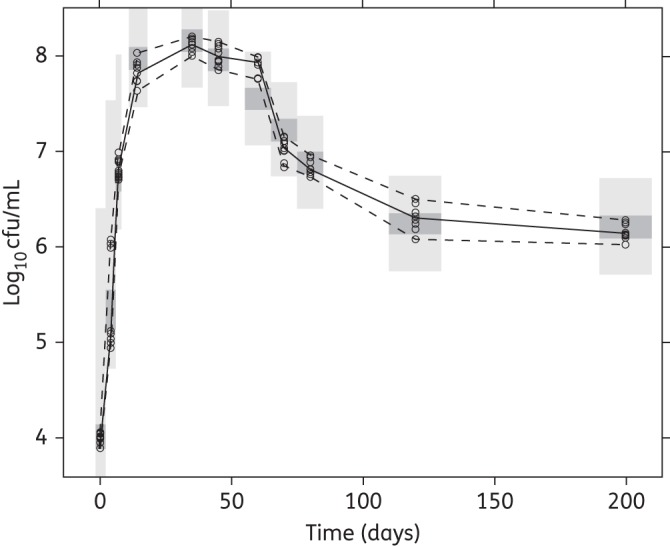
Objectives: Mycobacterium tuberculosis can exist in different states in vitro, which can be denoted as fast multiplying, slow multiplying and non-multiplying. Characterizing the natural growth of M. tuberculosis could provide a framework for accurate characterization of drug effects on the different bacterial states.

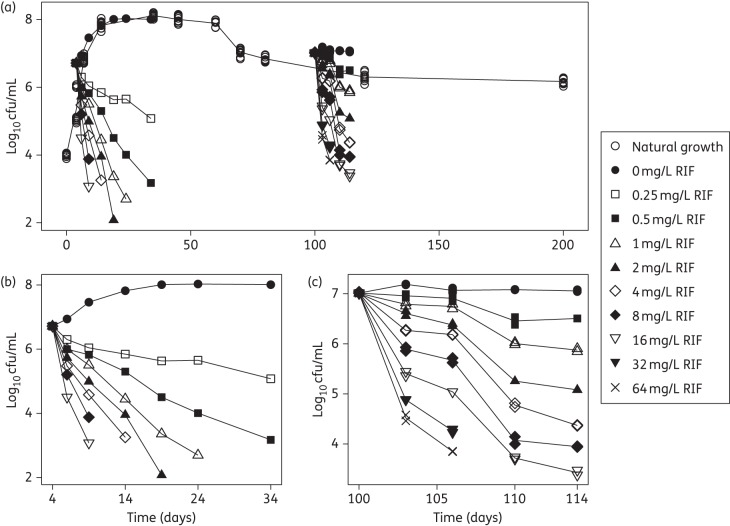
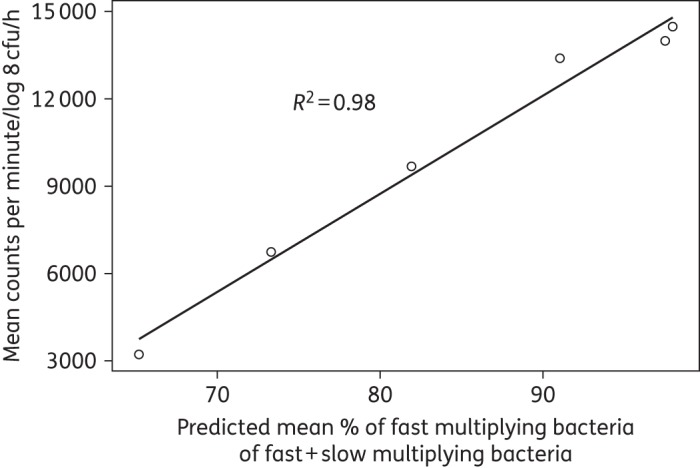
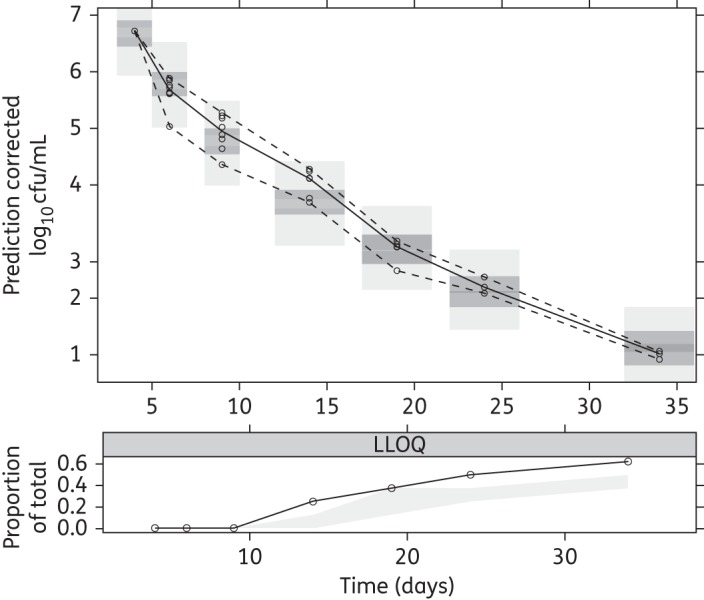
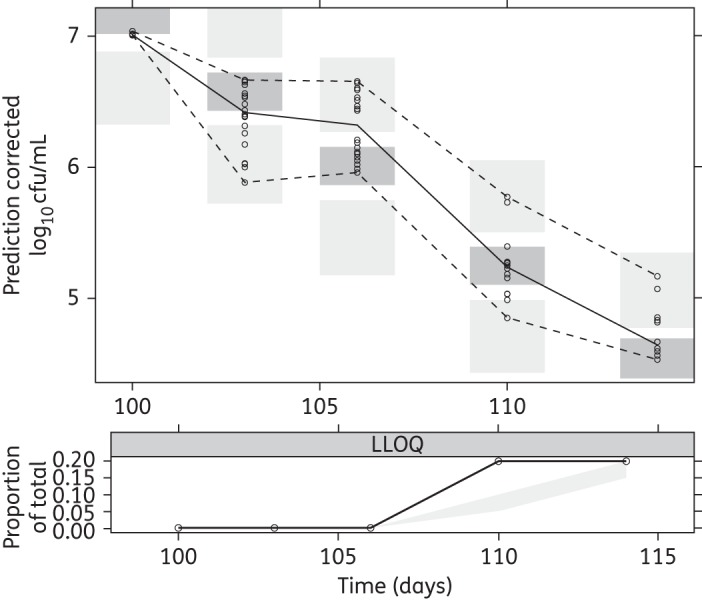
Methods: The natural growth data of M. tuberculosis H37Rv used in this study consisted of viability defined as cfu versus time based on data from an in vitro hypoxia system. External validation of the natural growth model was conducted using data representing the rate of incorporation of radiolabelled methionine into proteins by the bacteria. Rifampicin time-kill curves from log-phase (0.25-16 mg/L) and stationary-phase (0.5-64 mg/L) cultures were used to assess the model's ability to describe drug effects by evaluating different linear and non-linear exposure-response relationships.

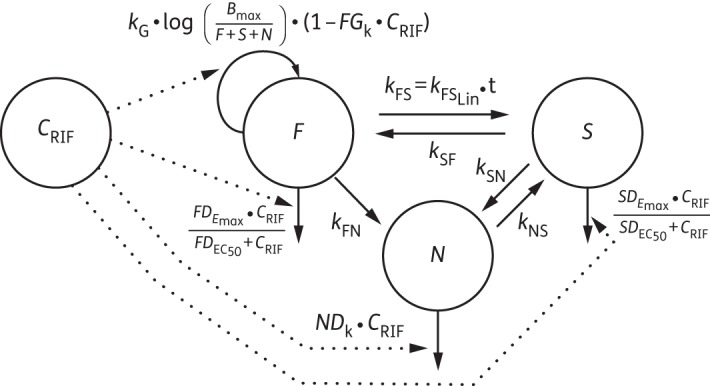
Results: The final pharmacometric model consisted of a three-compartment differential equation system representing fast-, slow- and non-multiplying bacteria. Model predictions correlated well with the external data (R(2) = 0.98). The rifampicin effects on log-phase and stationary-phase cultures were separately and simultaneously described by including the drug effect on the different bacterial states. The predicted reduction in log10 cfu after 14 days and at 0.5 mg/L was 2.2 and 0.8 in the log-phase and stationary-phase systems, respectively.

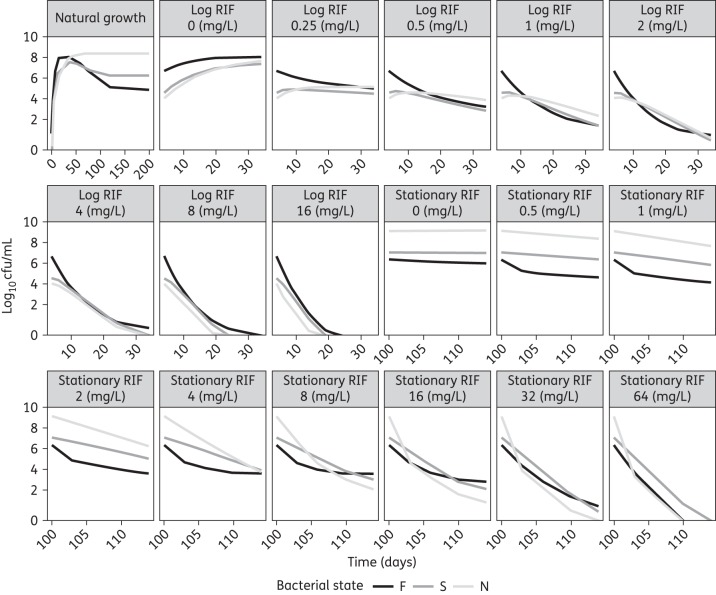
Conclusions: The model provides predictions of the change in bacterial numbers for the different bacterial states with and without drug effect and could thus be used as a framework for studying anti-tubercular drug effects in vitro.


Figures

Figure 1.
Figure 1.
Mean observed log10 cfu versus time. (a) Combination plot of all the data from the three in vitro systems: the 200 day natural growth system; the log-phase system with and without rifampicin (RIF); and the stationary-phase system with and without RIF. (b) The log-phase system with and without rifampicin, pre-grown for 4 days and studied for 30 days. (c) The stationary-phase system with and without rifampicin, pre-grown for 100 days and studied for 14 days.
Figure 2.
Figure 2.
Schematic illustration of the multistate tuberculosis pharmacometric model with inclusion of rifampicin pharmacokinetics (drug model). CRIF, rifampicin (RIF) concentration; F, fast-multiplying state; S, slow-multiplying state; N, non-multiplying state; kG, growth rate of the fast-multiplying state bacteria; kFS, time-dependent linear rate parameter describing transfer from fast- to slow-multiplying state; kSF, first-order transfer rate between slow- and fast-multiplying states; kFN, first-order transfer rate between fast- and non-multiplying states; kSN, first-order transfer rate between slow- and non-multiplying states; kNS, first-order transfer rate between non-multiplying and slow-multiplying states; FGk, linear drug-induced inhibition of fast-multiplying state growth; FDEmax, maximum achievable drug-induced fast-multiplying state kill rate; FDEC50, concentration at 50% of FDEmax; SDEmax, maximum achievable drug-induced slow-multiplying state kill rate; SDEC50, concentration at 50% of SDEmax; NDk, non-multiplying state kill rate.
Figure 3.
Figure 3.
Model-predicted typical M. tuberculosis bacterial numbers in the fast-, slow- and non-multiplying states without drug (natural growth) and after different static rifampicin (RIF) concentrations in log- and stationary-phase cultures.
Figure 4.
Figure 4.
VPC of the final multistate tuberculosis pharmacometric model using H37Rv M. tuberculosis in vitro without drug (natural growth). Open circles are observed log10 cfu data, the solid line is the median of the observed data and the dashed lines are the 5th and 95th percentiles of the observed data. The top and bottom shaded areas are the 95% CIs for the 5th and 95th percentiles of simulated data. The middle shaded area is the 95% CI for the median of the simulated data.
Figure 5.
Figure 5.
Correlation between the rate of incorporation of radiolabelled methionine ([35S]methionine) into proteins by the bacteria and, as a percentage, the mean of the natural growth model predicted typical fast-multiplying bacterial number out of the predicted typical fast- plus slow-multiplying bacterial number.
Figure 6.
Figure 6.
pcVPC for log-phase data of the final multistate tuberculosis pharmacometric model using log- and stationary-phase H37Rv M. tuberculosis in vitro and different static rifampicin concentrations. Open circles are prediction-corrected observed log-phase log10 cfu data after different static rifampicin concentrations, the solid line is the median of the observed data and the dashed lines are the 5th and 95th percentiles of the observed data. The top and bottom shaded areas are the 95% CIs for the 5th and 95th percentiles of simulated data. The middle shaded area is the 95% CI for the median of the simulated data. The black solid line in the lower plot is the median of data below the LOQ. The shaded area in the lower plot is the 95% CI for the simulated LOQ data.
Figure 7.
Figure 7.
pcVPC for stationary-phase data of the final multistate tuberculosis pharmacometric model using log- and stationary-phase H37Rv M. tuberculosis in vitro and different static rifampicin concentrations. Open circles are prediction-corrected observed stationary-phase log10 cfu data after different static rifampicin concentrations, the solid line is the median of the observed data and the dashed lines are the 5th and 95th percentiles of the observed data. The top and bottom shaded areas are the 95% CIs for the 5th and 95th percentiles of simulated data. The middle shaded area is the 95% CI for the median of the simulated data. The black solid line in the lower plot is the median of data below the LOQ. The shaded area in the lower plot is the 95% CI for the simulated LOQ data.

References

    1. World Health Organization. Global Tuberculosis Report 2014. http://apps.who.int/iris/bitstream/10665/137094/1/9789241564809_eng.pdf.
    1. Nielsen EI, Viberg A, Löwdin E et al. . Semimechanistic pharmacokinetic/pharmacodynamic model for assessment of activity of antibacterial agents from time–kill curve experiments. Antimicrob Agents Chemother 2007; 51: 128–36. - PMC - PubMed
    1. Nielsen EI, Cars O, Friberg LE. Pharmacokinetic/pharmacodynamic (PK/PD) indices of antibiotics predicted by a semimechanistic PKPD model: a step toward model-based dose optimization. Antimicrob Agents Chemother 2011; 55: 4619–30. - PMC - PubMed
    1. Okusanya OO, Tsuji BT, Bülitta JB et al. . Evaluation of the pharmacokinetics-pharmacodynamics of fusidic acid against Staphylococcus aureus and Streptococcus pyogenes using in vitro infection models: implications for dose selection. Diagn Microbiol Infect Dis 2011; 70: 101–11. - PubMed
    1. Bulitta JB, Ly NS, Yang JC et al. . Development and qualification of a pharmacodynamic model for the pronounced inoculum effect of ceftazidime against Pseudomonas aeruginosa. Antimicrob Agents Chemother 2009; 53: 46–56. - PMC - PubMed

Publication types

MeSH terms