

Spatiotemporal phosphoprotein distribution and associated cytokine response of a traumatic injury
- PMID: 26702931
- PMCID: PMC6924173
- DOI: 10.1016/j.cyto.2015.12.006
Spatiotemporal phosphoprotein distribution and associated cytokine response of a traumatic injury
Abstract
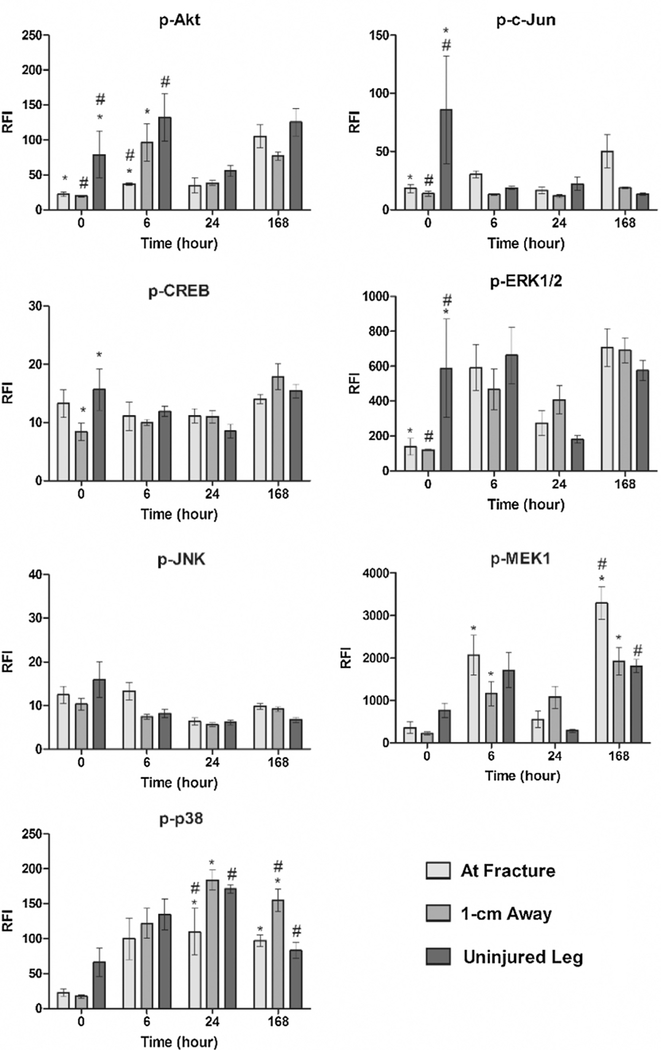
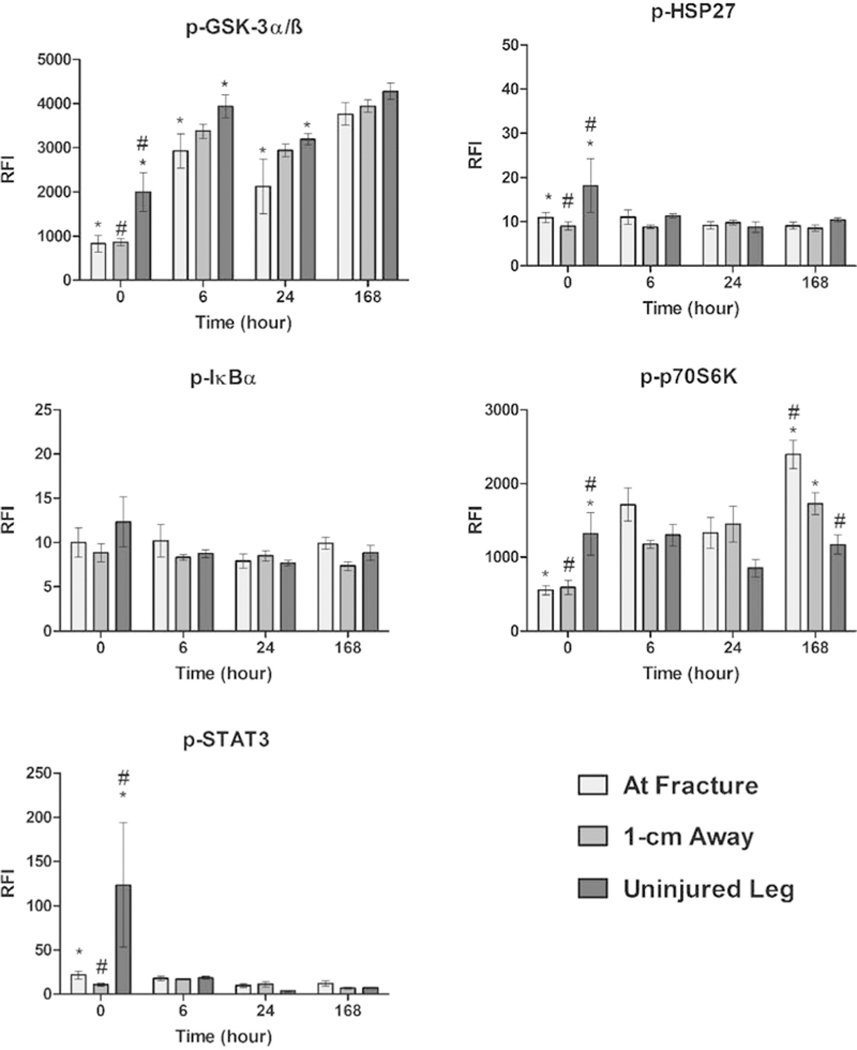
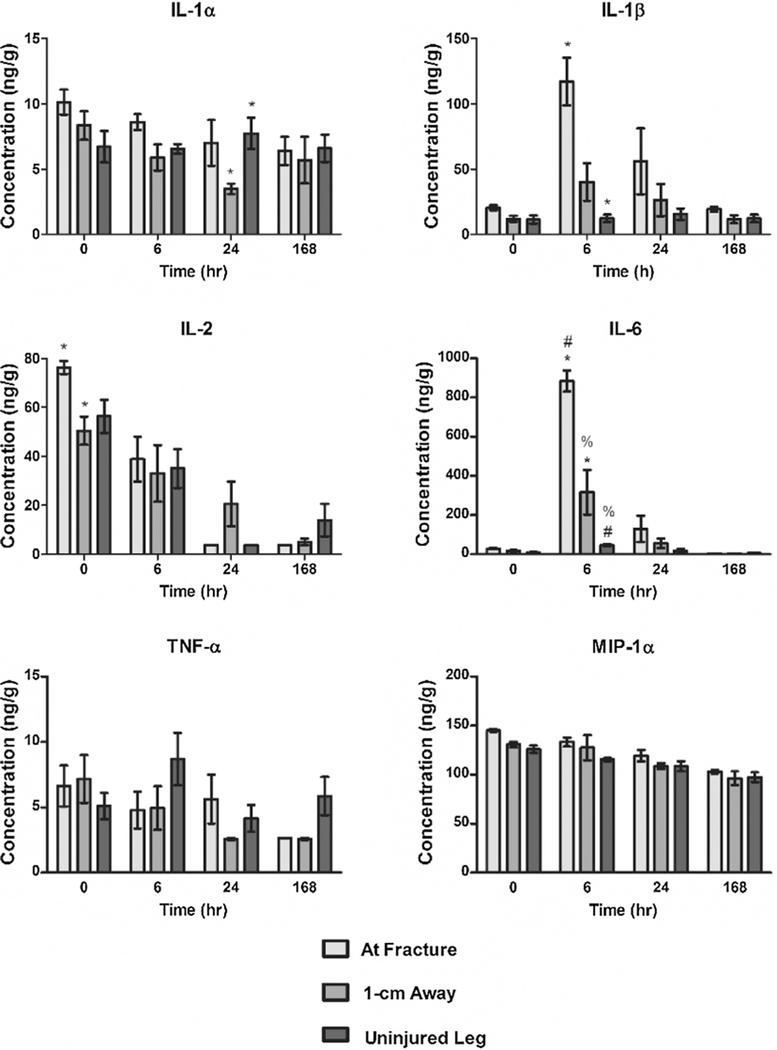
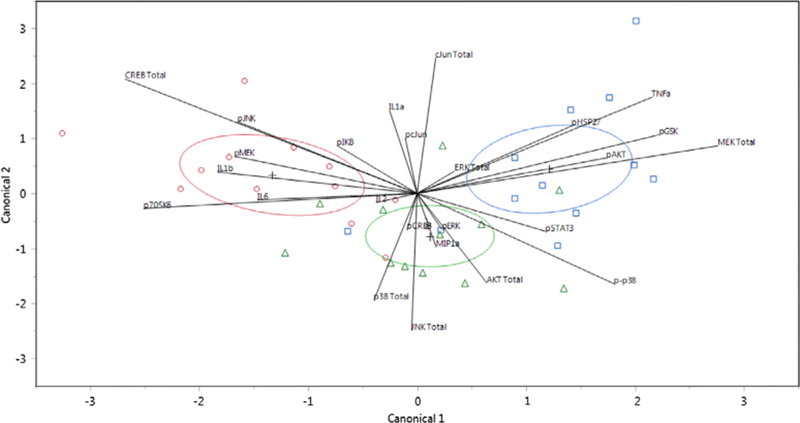
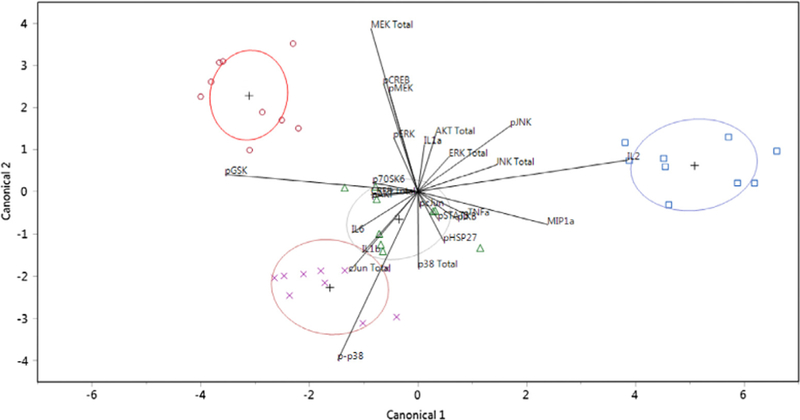
Molecular mechanisms of wound healing have been extensively characterized, providing a better understanding of the processes involved in wound repair and offering advances in treatment methods. Both spatial and temporal investigations of injury biomarkers have helped to pinpoint significant time points and locations during the recovery process, which may be vital in managing the injury and making the appropriate diagnosis. This study addresses spatial and temporal differences of phosphoproteins found in skeletal muscle tissue following a traumatic femur fracture, which were further compared to co-localized cytokine responses. In particular, several proteins (Akt, ERK, c-Jun, CREB, JNK, MEK1, and p38) and post-translational phosphorylations (p-Akt, p-c-Jun, p-CREB, p-ERK1/2, p-MEK1, p-p38, p-GSK3α/β, p-HSP27, p-p70S6K, and p-STAT3) associated with inflammation, new tissue formation, and remodeling were found to exhibit significant spatial and temporal differences in response to the traumatic injury. Quadratic discriminant analysis of all measured responses, including cytokine concentrations from previously published findings, was used to classify temporal and spatial observations at high predictive rates, further confirming that distinct spatiotemporal distributions for total protein, phosphorylation signaling, and cytokine (IL-1α, IL-1ß, IL2, IL6, TNF-α, and MIP-1α) responses exist. Finally, phosphoprotein measurements were found to be significantly correlated to cytokine concentrations, suggesting coordinated intracellular and extracellular activity during crucial periods of repair. This study represents a first attempt to monitor and assess integrated changes in extracellular and intracellular signaling in response to a traumatic injury in muscle tissues, which may provide a framework for future research to improve both our understanding of wounds and their treatment options.
Keywords: Cytokine; Phosphoprotein; Phosphorylation; Spatiotemporal distribution; Traumatic injury.
Copyright © 2015 Elsevier Ltd. All rights reserved.
Figures

Similar articles
-
The impact of cytokine responses in the intra- and extracellular signaling network of a traumatic injury.Cytokine. 2018 Jun;106:136-147. doi: 10.1016/j.cyto.2017.10.027. Epub 2017 Nov 2. Cytokine. 2018. PMID: 29103821 Free PMC article.
-
Spatial cytokine distribution following traumatic injury.Cytokine. 2014 Apr;66(2):112-8. doi: 10.1016/j.cyto.2014.01.001. Epub 2014 Jan 21. Cytokine. 2014. PMID: 24461742
-
ISSLS prize winner: repeated disc injury causes persistent inflammation.Spine (Phila Pa 1976). 2007 Dec 1;32(25):2812-9. doi: 10.1097/BRS.0b013e31815b9850. Spine (Phila Pa 1976). 2007. PMID: 18246002
-
Interleukin-6 stimulates Akt and p38 MAPK phosphorylation and fibroblast migration in non-diabetic but not diabetic mice.PLoS One. 2017 May 23;12(5):e0178232. doi: 10.1371/journal.pone.0178232. eCollection 2017. PLoS One. 2017. PMID: 28542434 Free PMC article.
-
The protective effect of the blood brain barrier from systemic cytokines in an animal femur fracture model.J Trauma. 2007 Sep;63(3):591-5. doi: 10.1097/TA.0b013e31812e51c7. J Trauma. 2007. PMID: 18073605
Cited by
-
The contribution of interleukin-2 to effective wound healing.Exp Biol Med (Maywood). 2017 Feb;242(4):384-396. doi: 10.1177/1535370216675773. Epub 2016 Oct 25. Exp Biol Med (Maywood). 2017. PMID: 27798123 Free PMC article. Review.
-
The Effects of Tissue Healing Factors in Wound Repair Involving Absorbable Meshes: A Narrative Review.J Clin Med. 2023 Aug 31;12(17):5683. doi: 10.3390/jcm12175683. J Clin Med. 2023. PMID: 37685753 Free PMC article. Review.
-
NCAM1 modulates the proliferation and migration of pulmonary arterial smooth muscle cells in pulmonary hypertension.Respir Res. 2024 Dec 19;25(1):435. doi: 10.1186/s12931-024-03068-7. Respir Res. 2024. PMID: 39696429 Free PMC article.
-
Tissue-level cytokines in a rodent model of chronic implant-associated infection.J Orthop Res. 2021 Oct;39(10):2159-2168. doi: 10.1002/jor.24940. Epub 2020 Dec 15. J Orthop Res. 2021. PMID: 33283316 Free PMC article.
-
Impact of Cytokines and Phosphoproteins in Response to Chronic Joint Infection.Biology (Basel). 2020 Jul 16;9(7):167. doi: 10.3390/biology9070167. Biology (Basel). 2020. PMID: 32708756 Free PMC article.
References
-
- Gurtner GC, Werner S, Barrandon Y, Longaker MT, Wound repair and regeneration, Nature 453 (2008) 314–321. - PubMed
-
- Velnar T, Bailey T, Smrkoli V, The wound healing process: an overview of the cellular and molecular mechanisms, J. Int. Med. Res 37 (2009) 1528–1542. - PubMed
-
- Witte MB, Barbul A, General principles of wound healing, Surg. Clin. North Am (1997) 77. 509-+. - PubMed
-
- Broughton G 2nd, Janis JE, Attinger CE, The basic science of wound healing, Plast. Reconstr. Surg 117 (2006) 12s–34s. - PubMed
Publication types
MeSH terms
Substances
Grants and funding
LinkOut - more resources
Full Text Sources
Other Literature Sources
Medical
Research Materials
Miscellaneous
