

Ultrashort echo time and zero echo time MRI at 7T
- PMID: 26702940
- PMCID: PMC4892974
- DOI: 10.1007/s10334-015-0509-0
Ultrashort echo time and zero echo time MRI at 7T
Abstract
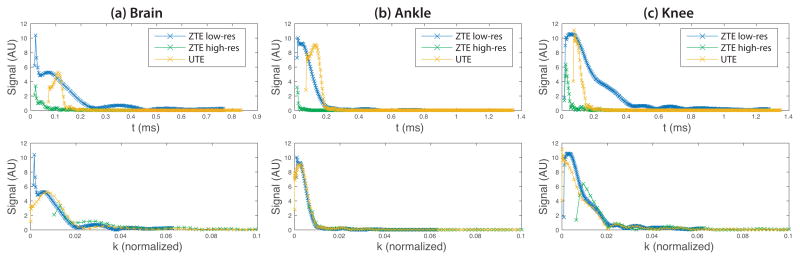
Objective: Zero echo time (ZTE) and ultrashort echo time (UTE) pulse sequences for MRI offer unique advantages of being able to detect signal from rapidly decaying short-T2 tissue components. In this paper, we applied 3D ZTE and UTE pulse sequences at 7T to assess differences between these methods.
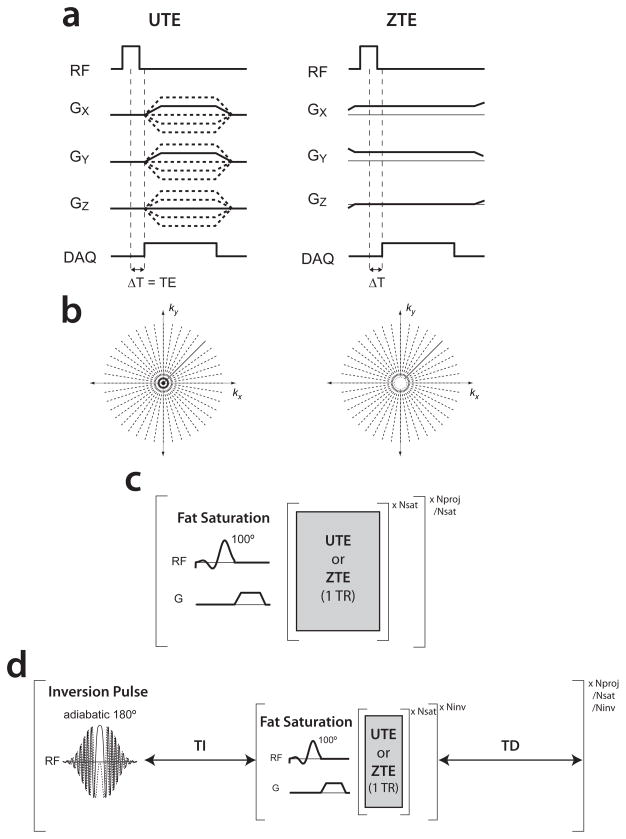
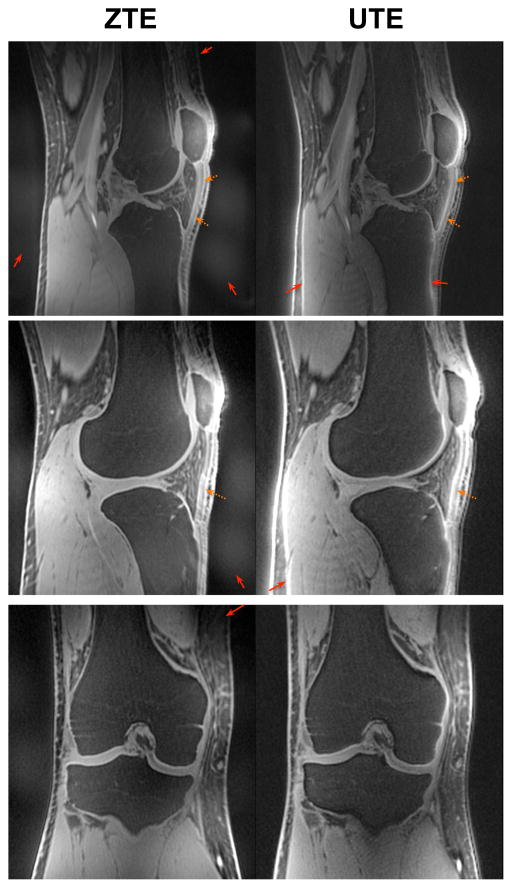
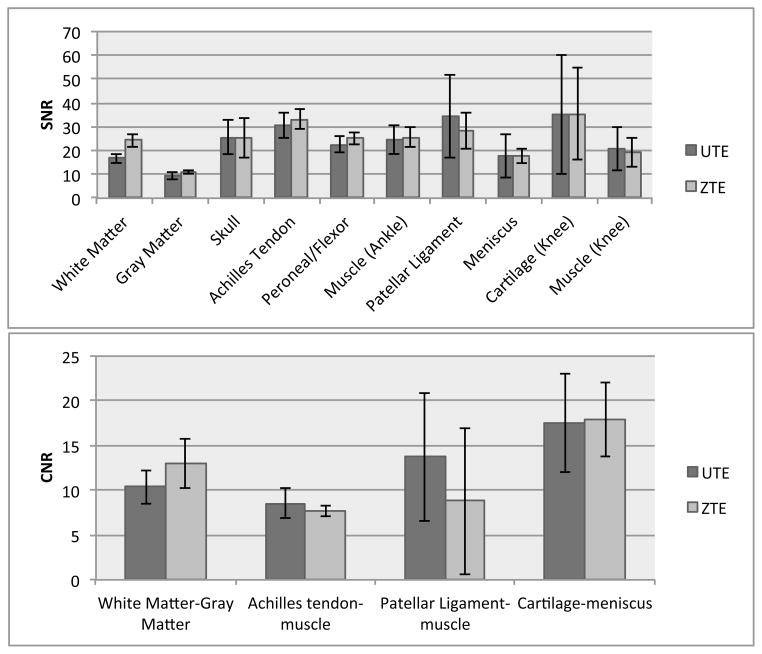
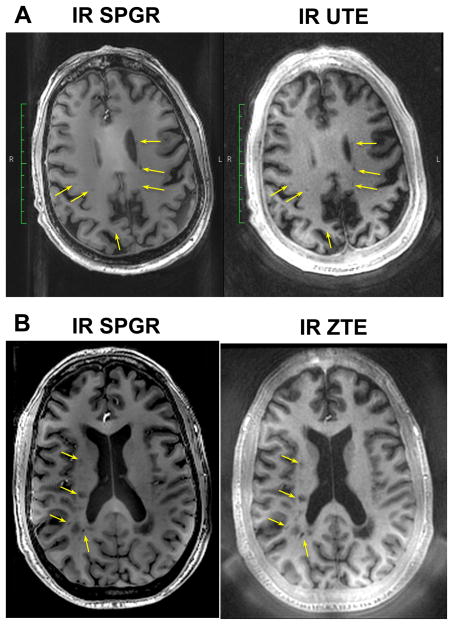
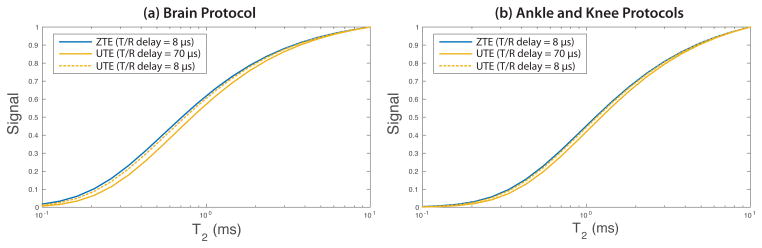
Materials and methods: We matched the ZTE and UTE pulse sequences closely in terms of readout trajectories and image contrast. Our ZTE used the water- and fat-suppressed solid-state proton projection imaging method to fill the center of k-space. Images from healthy volunteers obtained at 7T were compared qualitatively, as well as with SNR and CNR measurements for various ultrashort, short, and long-T2 tissues.
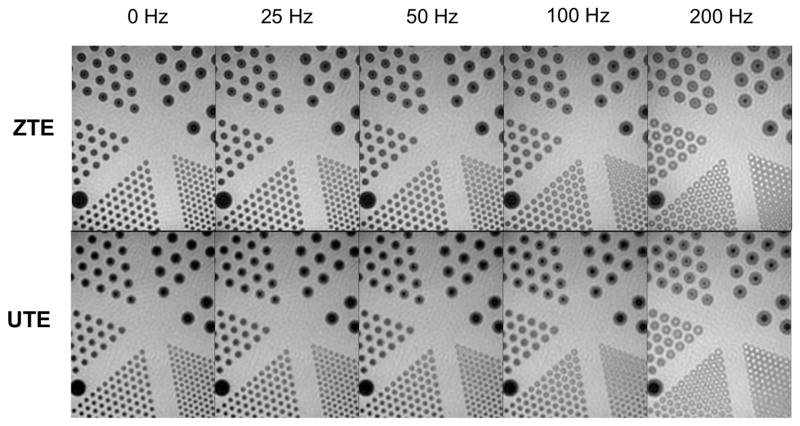
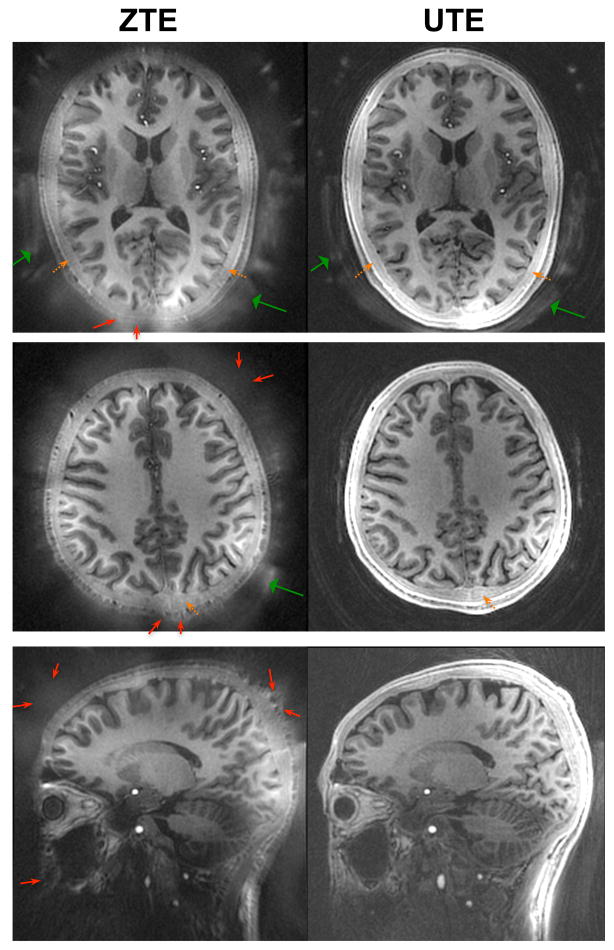
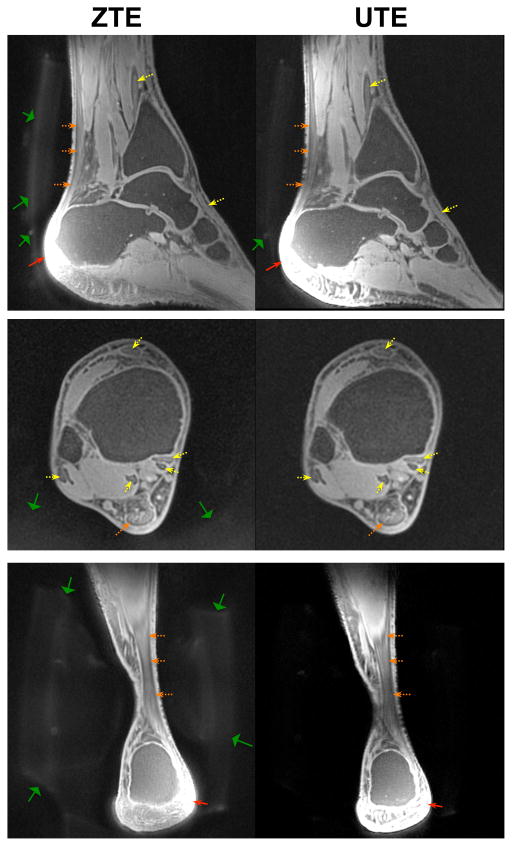
Results: We measured nearly identical contrast-to-noise and signal-to-noise ratios (CNR/SNR) in similar scan times between the two approaches for ultrashort, short, and long-T2 components in the brain, knee and ankle. In our protocol, we observed gradient fidelity artifacts in UTE, and our chosen flip angle and readout also resulted in shading artifacts in ZTE due to inadvertent spatial selectivity. These can be corrected by advanced reconstruction methods or with different chosen protocol parameters.
Conclusion: The applied ZTE and UTE pulse sequences achieved similar contrast and SNR efficiency for volumetric imaging of ultrashort-T2 components. Key differences include that ZTE is limited to volumetric imaging, but has substantially reduced acoustic noise levels during the scan. Meanwhile, UTE has higher acoustic noise levels and greater sensitivity to gradient fidelity, but offers more flexibility in image contrast and volume selection.
Keywords: Magnetic resonance imaging; Musculoskeletal system; Neuroimaging.
Figures
Similar articles
-
Comparison of lung imaging using three-dimensional ultrashort echo time and zero echo time sequences: preliminary study.Eur Radiol. 2019 May;29(5):2253-2262. doi: 10.1007/s00330-018-5889-x. Epub 2018 Dec 13. Eur Radiol. 2019. PMID: 30547204
-
Three-dimensional accurate detection of lung emphysema in rats using ultra-short and zero echo time MRI.NMR Biomed. 2015 Nov;28(11):1471-9. doi: 10.1002/nbm.3417. Epub 2015 Sep 24. NMR Biomed. 2015. PMID: 26403226
-
Long-T2 -suppressed zero echo time imaging with weighted echo subtraction and gradient error correction.Magn Reson Med. 2020 Feb;83(2):412-426. doi: 10.1002/mrm.27925. Epub 2019 Sep 10. Magn Reson Med. 2020. PMID: 31502718
-
Clinical application of ultrashort echo time (UTE) and zero echo time (ZTE) magnetic resonance (MR) imaging in the evaluation of osteoarthritis.Skeletal Radiol. 2023 Nov;52(11):2149-2157. doi: 10.1007/s00256-022-04269-1. Epub 2023 Jan 6. Skeletal Radiol. 2023. PMID: 36607355 Free PMC article. Review.
-
Beyond X-Rays: Unveiling the Future of Dental Diagnosis with Dental Magnetic Resonance Imaging.Diagnostics (Basel). 2025 May 1;15(9):1153. doi: 10.3390/diagnostics15091153. Diagnostics (Basel). 2025. PMID: 40361971 Free PMC article. Review.
Cited by
-
Quantitative measurement of T2, T1ρ and T1 relaxation times in articular cartilage and cartilage-bone interface by SE and UTE imaging at microscopic resolution.J Magn Reson. 2018 Dec;297:76-85. doi: 10.1016/j.jmr.2018.10.008. Epub 2018 Oct 12. J Magn Reson. 2018. PMID: 30366222 Free PMC article.
-
3D-T1ρ prepared zero echo time-based PETRA sequence for in vivo biexponential relaxation mapping of semisolid short-T2 tissues at 3 T.J Magn Reson Imaging. 2019 Oct;50(4):1207-1218. doi: 10.1002/jmri.26664. Epub 2019 Jan 28. J Magn Reson Imaging. 2019. PMID: 30693600 Free PMC article.
-
Silent zero TE MR neuroimaging: Current state-of-the-art and future directions.Prog Nucl Magn Reson Spectrosc. 2021 Apr;123:73-93. doi: 10.1016/j.pnmrs.2021.03.002. Epub 2021 Mar 26. Prog Nucl Magn Reson Spectrosc. 2021. PMID: 34078538 Free PMC article. Review.
-
Fast quantitative three-dimensional ultrashort echo time (UTE) Cones magnetic resonance imaging of major tissues in the knee joint using extended sprial sampling.NMR Biomed. 2020 Oct;33(10):e4376. doi: 10.1002/nbm.4376. Epub 2020 Jul 15. NMR Biomed. 2020. PMID: 32667115 Free PMC article.
-
In vivo characterization of brain ultrashort-T2 components.Magn Reson Med. 2018 Aug;80(2):726-735. doi: 10.1002/mrm.27037. Epub 2017 Dec 1. Magn Reson Med. 2018. PMID: 29194734 Free PMC article.
References
-
- Gold GE, Wren TAL, Nayak KS. In vivo short echo time imaging of Achilles tendon. Proceedings of the 9th Annual Meeting of ISMRM; Glasgow. 2001. p. 244.
-
- Robson MD, Benjamin M, Gishen P, Bydder GM. Magnetic resonance imaging of the Achilles tendon using ultrashort TE (UTE) pulse sequences. Clin Radiol. 2004;59:727–735. - PubMed
-
- Filho GH, Du J, Pak BC, Statum S, Znamorowski R, Haghighi P, Bydder G, Chung CB. Quantitative characterization of the achilles tendon in cadaveric specimens: T1 and R2* measurements using ultrashort-TE MRI at 3 T. AJR Am J Roentgenol. 2009;192:W117–24. - PubMed
-
- Grosse U, Syha R, Martirosian P, Wuerslin C, Horger M, Grözinger G, Schick F, Springer F. Ultrashort echo time MR imaging with off-resonance saturation for characterization of pathologically altered achilles tendons at 3 T. Magn Reson Med. 2013;70:184–92. - PubMed
-
- Juras V, Zbyn S, Pressl C, Valkovic L, Szomolanyi P, Frollo I, Trattnig S. Regional variations of T2* in healthy and pathologic achilles tendon in vivo at 7 tesla: preliminary results. Magn Reson Med. 2012;68:1607–13. - PubMed
MeSH terms
Substances
Grants and funding
LinkOut - more resources
Full Text Sources
Other Literature Sources
Medical
