. 2016 Feb:99:72-8.
doi: 10.1016/j.resuscitation.2015.12.001. Epub 2015 Dec 17.

Long-term survival following in-hospital cardiac arrest: A matched cohort study

Affiliations

Long-term survival following in-hospital cardiac arrest: A matched cohort study

Paul Feingold et al. Resuscitation. 2016 Feb.

Abstract

Background: Each year, 200,000 patients undergo an in-hospital cardiac arrest (IHCA), with approximately 15-20% surviving to discharge. Little is known, however, about the long-term prognosis of these patients after discharge. Previous efforts to describe out-of-hospital survival of IHCA patients have been limited by small sample sizes and narrow patient populations

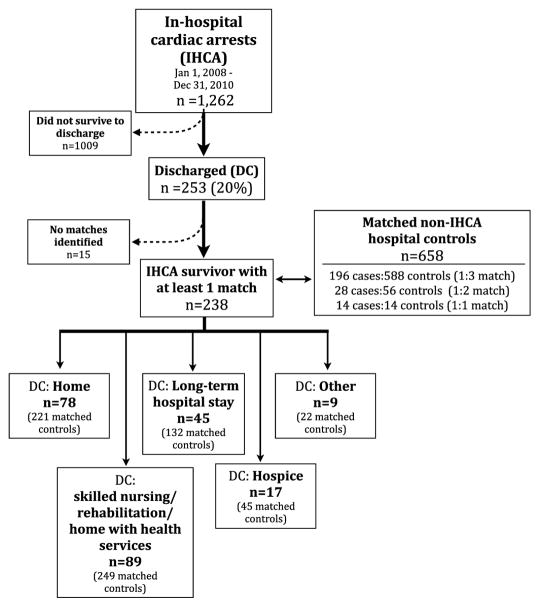
Methods: A single institution matched cohort study was undertaken to describe mortality following IHCA. Patients surviving to discharge following an IHCA between 2008 and 2010 were matched on age, sex, race and hospital admission criteria with non-IHCA hospital controls and follow-up between 9 and 45 months. Kaplan-Meier curves and Cox PH models assessed differences in survival.

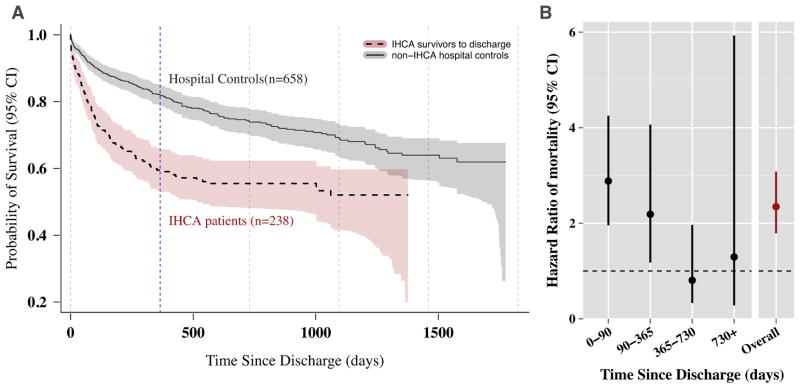
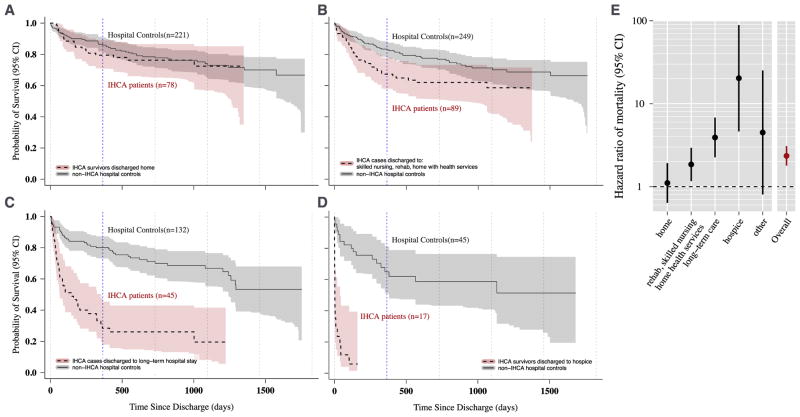
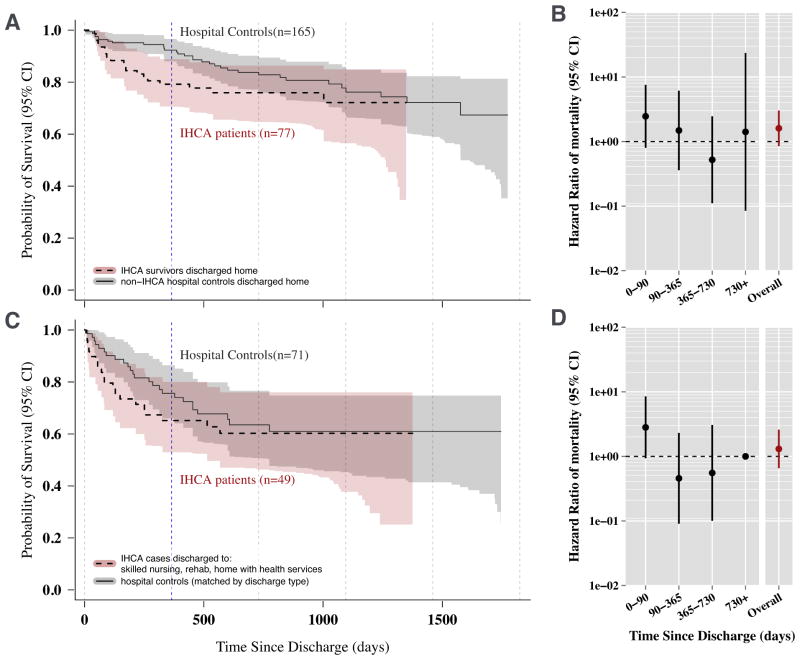
Results: Of the 1262 IHCAs, 20% survived to hospital discharge. Of those discharged, survival at 1 year post-discharge was 59% for IHCA patients and 82% for controls (p<0.0001). Hazard ratios (IHCA vs. controls) for mortality were greatest within the 90 days following discharge (HR=2.90, p<0.0001) and decreased linearly thereafter, with those surviving to one year post-discharge having an HR for mortality below 1.0. Survival after discharge varied amongst IHCA survivors. When grouped by discharge destination, out of hospital survival varied; in fact, IHCA patients discharged home without services demonstrated no survival difference compared to their non-IHCA controls (HR 1.10, p=0.72). IHCA patients discharged to long-term hospital care or hospice, however, had a significantly higher mortality compared to matched controls (HR 3.91 and 20.3, respectively; p<0.0001).

Conclusion: Among IHCA patients who survive to hospital discharge, the highest risk of death is within the first 90 days after discharge. Additionally, IHCA survivors overall have increased long-term mortality vs.

Controls: Survival rates were varied widely with different discharge destinations, and those discharged to home, skilled nursing facilities or to rehabilitation services had survival rates no different than controls. Thus, increased mortality was primarily driven by patients discharged to long-term care or hospice.

Keywords: Cardiopulmonary resuscitation; Heart arrest; Outcome studies; Survival.


Conflict of interest statement

Conflicts of interest statement

None.

Figures

Fig. 1
Fig. 1
Flow diagram for IHCA patients and matching controls.
Fig. 2
Fig. 2
Survival and hazard ratios for mortality following hospital discharge among IHCA survivors versus matched hospital controls. (A) Kaplan–Meier curves for survival following discharge for IHCA patients surviving to discharge and matched non-IHCA hospital controls. Shaded regions represent 95% confidence bands for survival. (B) Hazard ratios for mortality of IHCA survivors versus matched non-IHCA controls during discrete observation windows following discharge, conditioned on survival to the start of each period of time. “Overall” indicates the hazard ratio for mortality over the entire follow-up period (shown in A). Hazard ratios with 95% confidence intervals not including the value 1 are statistically significant to an alpha of 0.05. Vertical lines represent 1-year intervals.
Fig. 3
Fig. 3
Survival and hazard ratios of mortality following discharge for IHCA survivors versus matched hospital controls: stratified by discharge disposition of IHCA patients. Kaplan–Meier survival curves were plotted for IHCA patients (broken lines) and their matched non-IHCA hospital controls (solid lines), stratified by IHCA patient discharge disposition: (A) home without health services; (B) home with health services, skilled nursing, rehabilitation, intermediate care facility or short-term hospital stay; (C) long-term hospital care and; (D) hospice care. Shaded regions indicate 95% confidence bands. (E) Cox proportional hazards ratios of mortality for IHCA patients versus non-IHCA matched controls for each of the pairs of curves plotted in (A–D) are shown. “Overall” is the combined hazard ratio for mortality for all patients and “other” includes 9 IHCA patients (and 22 controls), 6 who were transferred to cancer facilities and 3 who left against medical advice. 95% confidence intervals are shown surrounding the point estimate for the hazard ratio. Hazard ratios with 95% confidence intervals not including the value 1 are statistically significant to an alpha of 0.05. (Note log-scale on y-axis). Vertical lines represent 1-year intervals.
Fig. 4
Fig. 4
Survival and hazard ratios of mortality following hospital discharge for IHCA survivors and matched non-IHCA hospital controls with concordant discharge dispositions: stratified by discharge disposition. Kaplan–Meier survival curves were plotted for IHCA patients (broken lines) and their matched and discharge disposition concordant non-IHCA hospital controls (solid lines), stratified by discharge disposition: (A) home without health services; (C) home with health services, skilled nursing, rehabilitation, intermediate care facility or short-term hospital stay. Shaded regions indicate 95% confidence bands. In (B and D) Cox proportional hazards ratios of overall mortality and during discrete observation windows following discharge for IHCA patients versus discharge disposition-concordant non-IHCA matched controls are shown. “Overall” is the combined hazard ratio for mortality for the entire follow-period. 95% confidence intervals are shown surrounding the point estimate for the hazard ratios. Hazard ratios with 95% confidence intervals not including the value 1 are statistically significant to an alpha of 0.05. All intervals crossed 1 and thus none had statistically significant hazard ratios for mortality. (Note log-scale on y-axis). Vertical lines represent 1-year intervals.

References

    1. Merchant RM, Yang L, Becker LB, et al. Incidence of treated cardiac arrest in hospitalized patients in the United States. Crit Care Med. 2011;39:2401–6. - PMC - PubMed
    1. Sandroni C, Nolan J, Cavallaro F, Antonelli M. In-hospital cardiac arrest: incidence, prognosis and possible measures to improve survival. Intensive Care Med. 2007;33:237–45. - PubMed
    1. Girotra S, Nallamothu BK, Spertus JA, Li Y, Krumholz HM, Chan PS. Trends in survival after in-hospital cardiac arrest. N Engl J Med. 2012;367:1912–20. - PMC - PubMed
    1. Skrifvars MB, Castren M, Nurmi J, Thoren AB, Aune S, Herlitz J. Do patient characteristics or factors at resuscitation influence long-term outcome in patients surviving to be discharged following in-hospital cardiac arrest? J Intern Med. 2007;262:488–95. - PubMed
    1. Bloom HL, Shukrullah I, Cuellar JR, Lloyd MS, Dudley SC, Jr, Zafari AM. Long-term survival after successful inhospital cardiac arrest resuscitation. Am Heart J. 2007;153:831–6. - PMC - PubMed

Publication types