. 2015 Dec 24:15:292.
doi: 10.1186/s12862-015-0557-0.

Tooth and scale morphogenesis in shark: an alternative process to the mammalian enamel knot system

Affiliations

Tooth and scale morphogenesis in shark: an alternative process to the mammalian enamel knot system

Mélanie Debiais-Thibaud et al. BMC Evol Biol. .

Abstract

Background: The gene regulatory network involved in tooth morphogenesis has been extremely well described in mammals and its modeling has allowed predictions of variations in regulatory pathway that may have led to evolution of tooth shapes. However, very little is known outside of mammals to understand how this regulatory framework may also account for tooth shape evolution at the level of gnathostomes. In this work, we describe expression patterns and proliferation/apoptosis assays to uncover homologous regulatory pathways in the catshark Scyliorhinus canicula.

Results: Because of their similar structural and developmental features, gene expression patterns were described over the four developmental stages of both tooth and scale buds in the catshark. These gene expression patterns differ from mouse tooth development, and discrepancies are also observed between tooth and scale development within the catshark. However, a similar nested expression of Shh and Fgf suggests similar signaling involved in morphogenesis of all structures, although apoptosis assays do not support a strictly equivalent enamel knot system in sharks. Similarities in the topology of gene expression pattern, including Bmp signaling pathway, suggest that mouse molar development is more similar to scale bud development in the catshark.

Conclusions: These results support the fact that no enamel knot, as described in mammalian teeth, can be described in the morphogenesis of shark teeth or scales. However, homologous signaling pathways are involved in growth and morphogenesis with variations in their respective expression patterns. We speculate that variations in this topology of expression are also a substrate for tooth shape evolution, notably in regulating the growth axis and symmetry of the developing structure.


Figures
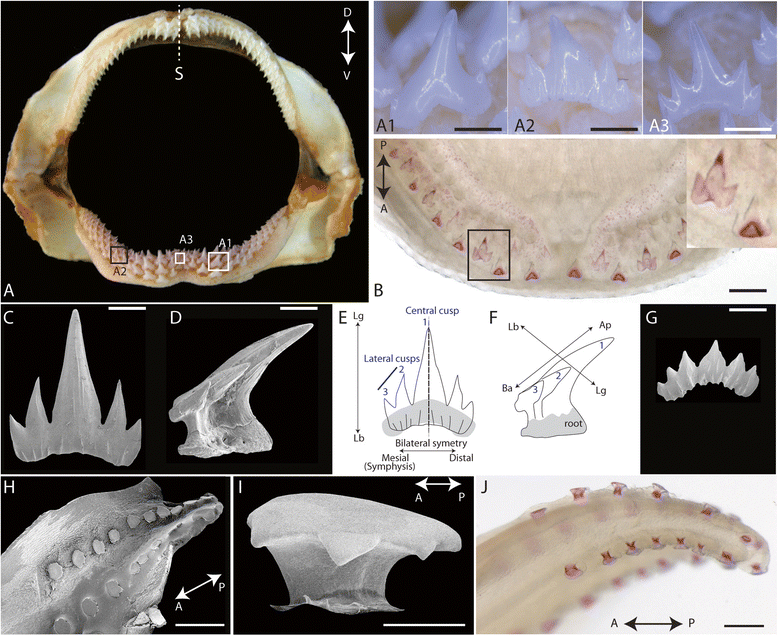
Fig. 1
Fig. 1
External morphology of adult and developing teeth and scales in Scyliorhinus canicula. a adult male jaw, frontal view with insets on teeth from the lower jaw (A1, tooth from the lateral side, A2, para-symphyseal tooth, A3, symphyseal tooth). b dorsal view of an alizarin red stained lower jaw of a 7.5 cm long embryo with inset on the tricuspid mineralized first generation teeth. c SEM, labial view of a bilaterally symetric tooth with five cusps from an adult female, d SEM, lateral view of a similar tooth. e and f: schematics of teeth in c and d with crown orientation: ap: apical; ba: basal; lb: labial; lg, lingual. g: SEM, tooth of an adult female with altered symmetry and small central cusp. h: SEM, lateral view of the tip of the tail of a 4.8 cm long embryo showing the caudal scales. i: SEM, lateral view of one erupted caudal scale. j: ventral view of the tail of a 5 cm long embryo after staining with alizarin red showing developing caudal scales. Scale bars: A1, A3, B, H: 500 μm; A2: 700 μm; C, D, G, J: 250 μm; I: 50 μm
Fig. 2
Fig. 2
Gene expression patterns prior to tooth initiation in the catshark Scyliorhinus canicula. Expression is seen on whole mount lower jaws (a–g) and longitudinal sections (a1–g1) showing tissue specific expression in the odontogenic band (black arrow) except for Sc-Shh. A schematic of the whole section surface, with orientation, is given in a2. The square indicates the region magnified in a1-g1. Gene names are indicated of the left side of the panel. The basal membrane is located with a dotted red line. ap: apical, ba: basal, e: epithelium of the odontogenic band, lb: labial, lg: lingual, m: mesenchyme. Scale bars: (a–g) 200 μm, (a1-g1) 50 μm
Fig. 3
Fig. 3
Gene expression patterns during early tooth development in the catshark Scyliorhinus canicula. Longitudinal sections showing tissue specific expression in tooth buds at stage EM (a, c, e, g, i, k, m, o) and LM (b, d, f, h, j, l, n, p). Gene names are indicated of the left side of each panel, the basal membrane is located with a dotted red line. ap: apical, ba: basal, ie: inner epithelium, lb: labial, lg: lingual, m: mesenchyme, oe: outer epithelium. Scale bars: 50 μm
Fig. 4
Fig. 4
Gene expression patterns during late tooth development in the catshark Scyliorhinus canicula. a and b schematics of tooth bud at respectively ED and LD stage, dorsal view, labial side to the top. c schematic of histological section following section plane 1. Whole-mount dorsal views of tooth buds at ED and LD stages (d–s) and longitudinal sections following section plane 1 showing tissue specific expression (d1–s1). e2 and e3 longitudinal sections following section planes 2 and 3. Gene names are indicated of the left side of the panel, same legends as Fig. 3. Scale bars: 50 μm
Fig. 5
Fig. 5
Gene expression patterns during dermal scale development in the catshark Scyliorhinus canicula. Whole-mount hybridized tails of about 3 cm long embryos (a–g) and transverse sections showing tissue specific expression in scale buds at stage EM (a1–g1), LM (a2–g2), ED (a3–g3) and LD (a4–g4). Gene names are indicated of the left side of each panel, same legends as Figs. 3 and 4. Scale bars: (a–g) 200 μm, (a1–g4) 50 μm
Fig. 6
Fig. 6
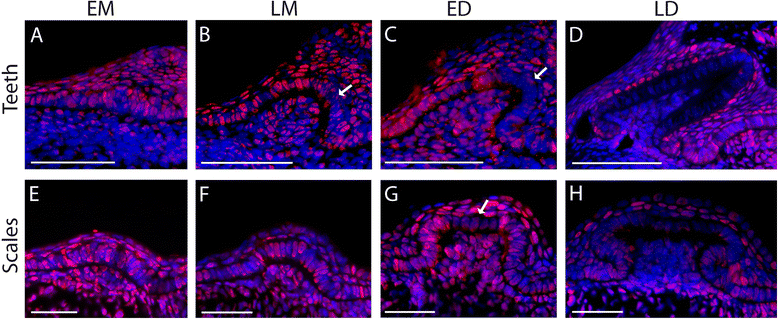
Cell proliferation pattern during tooth bud (a–d) and scale bud (e–h) development in the catshark Scyliorhinus canicula. a–d Histological sections of dissected jaws. e–h Histological sections of dissected tails. PCNA staining appears red and counter-staining of the nuclei is blue. Developmental stages are indicated on the figure. Scale bars: 50 μm
Fig. 7
Fig. 7
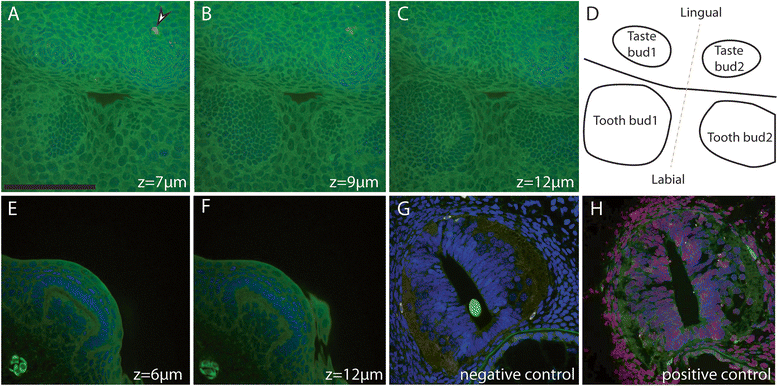
Apoptosis detection in developing tooth and scale buds in the catshark Scyliorhinus canicula. Apoptotic cells (TUNEL, red), actin (phalloidin, green) and DNA (DAPI, blue) were localized by triple labelling and confocal microscopy imaging. Dorsal views of successive z-planes of a whole-mount lower jaw, merged for all three canals (a, buccal surface with taste buds; b, dental epithelium layer of tooth bud 1, late LM; c, dental epithelium layer of tooth bud 2, late LM; d: schematic of the dorsal view). Lateral views of successive planes in a caudal scale, merged for all three canals, early ED (e, scale bud side, z = 6 μm; f, scale bud center, z = 12 μm). Sections through the neural tube merged for all three canals, g negative control without the terminal deoxynucleotidyl transferase (TdT) enzyme, no apoptosis is detected; h positive control after DNAse I digestion, all nuclei are positively stained with both the DAPI and the TUNEL, resulting in purple fake color. White arrowhead: TUNEL positive staining in the buccal epithelium. See Additional files 2 and 3 for all z-planes. Scale bar: 150 μm
Fig. 8
Fig. 8
A summary of epithelial gene expression patterns in tooth and scale buds of the catshark Scyliorhinus canicula, in comparison to mouse molar development. Co-expression of anti- and pro-proliferative signals are colored similarly in shark tooth and scale buds and mouse tooth buds, Fgf and Bmp zones of expression correspond to Fgf8 and Bmp4 in the catshark, Bmp4 and Fgf4 in mouse (following [17]). E: epithelium; M: mesenchyme; oe: outer epithelium; ie: inner epithelium
Fig. 9
Fig. 9
A model of evolution for the regulatory system involved in odontode morphogenesis in the course of vertebrate diversification. The phylogenetic framework is from [56] and the odontode structures (lateral views) are from [55]. The relative expression domains of Shh and Bmps are indicated in green and orange respectively. The orientation of growth, following the putative Shh signal, is indicated by a green arrow. Odontodes are an ancestral character for vertebrates that first occurred as outer mineralized structures (A). In particular, thelodonts display both radially symmetrical and bilaterally symmetrical scales. A strict coupling of the Shh and Bmp pathways involved in cusp growth is currently described only in mammals (B) but may be proposed as a mechanism for cuspid growth in placoderms

Similar articles

Cited by

References

    1. Harjunmaa E, Seidel K, Häkkinen T, Renvoisé E, Corfe IJ, Kallonen A, et al. Replaying evolutionary transitions from the dental fossil record. Nature. 2014;512:44–8. - PMC - PubMed
    1. Rodrigues HG, Renaud S, Charles C, Le Poul Y, Solé F, Aguilar J-P, et al. Roles of dental development and adaptation in rodent evolution. Nat Commun. 2013;4:2504. doi: 10.1038/ncomms3504. - DOI - PubMed
    1. Jernvall J, Keränen SV, Thesleff I. Evolutionary modification of development in mammalian teeth: quantifying gene expression patterns and topography. Proc Natl Acad Sci U S A. 2000;97:14444–8. doi: 10.1073/pnas.97.26.14444. - DOI - PMC - PubMed
    1. Debiais-Thibaud M, Oulion S, Bourrat F, Laurenti P, Casane D, Borday-Birraux V. The homology of odontodes in gnathostomes: insights from Dlx gene expression in the dogfish, Scyliorhinus canicula. BMC Evol Biol. 2011;11:307. doi: 10.1186/1471-2148-11-307. - DOI - PMC - PubMed
    1. Debiais-Thibaud M, Borday-Birraux V, Germon I, Bourrat F, Metcalfe CJ, Casane D, et al. Development of oral and pharyngeal teeth in the medaka (Oryzias latipes): comparison of morphology and expression of eve1 gene. J Exp Zool B Mol Dev Evol. 2007;708(May):693–708. doi: 10.1002/jez.b.21183. - DOI - PubMed

MeSH terms

Substances

LinkOut - more resources