. 2016 Mar;170(3):1216-34.
doi: 10.1104/pp.15.01907. Epub 2015 Dec 24.

PSR1 Is a Global Transcriptional Regulator of Phosphorus Deficiency Responses and Carbon Storage Metabolism in Chlamydomonas reinhardtii

Affiliations

PSR1 Is a Global Transcriptional Regulator of Phosphorus Deficiency Responses and Carbon Storage Metabolism in Chlamydomonas reinhardtii

Amit K Bajhaiya et al. Plant Physiol. 2016 Mar.

Abstract

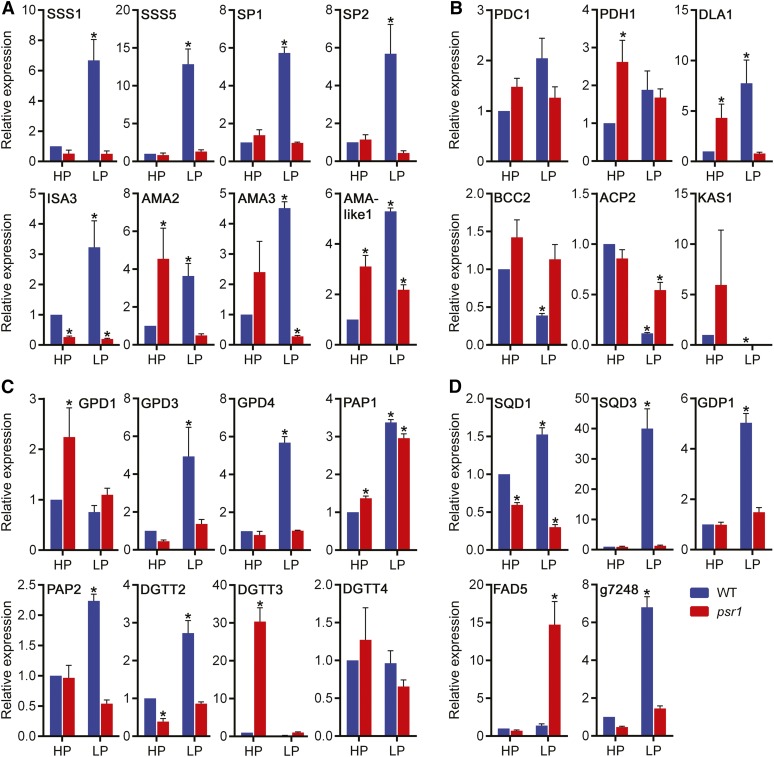
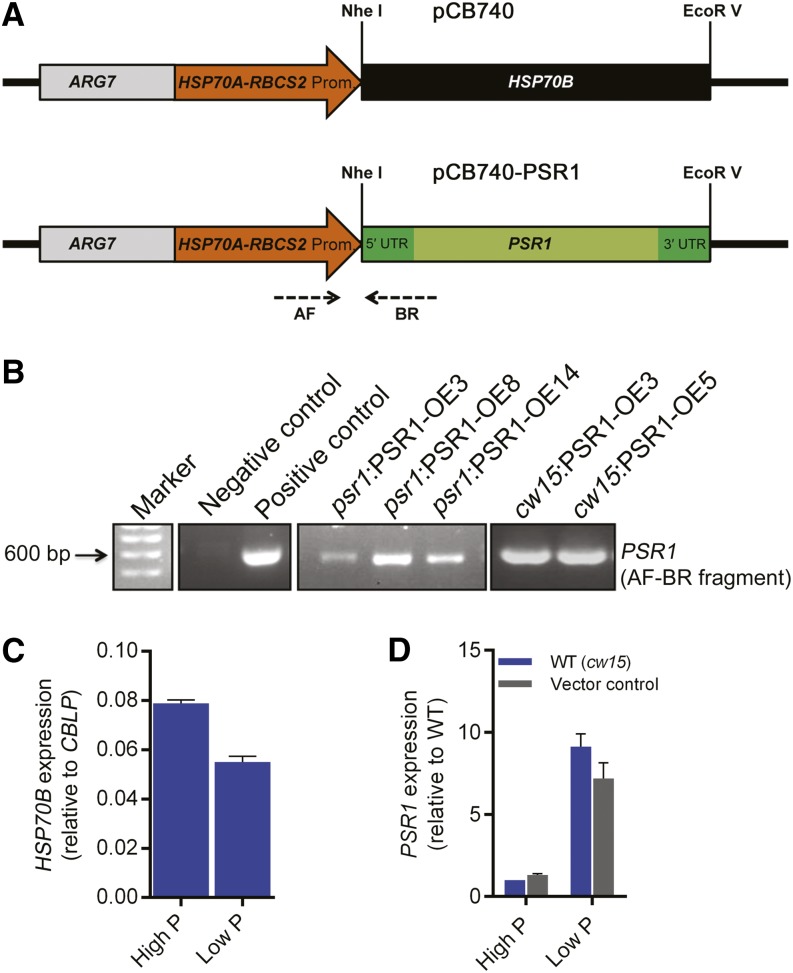
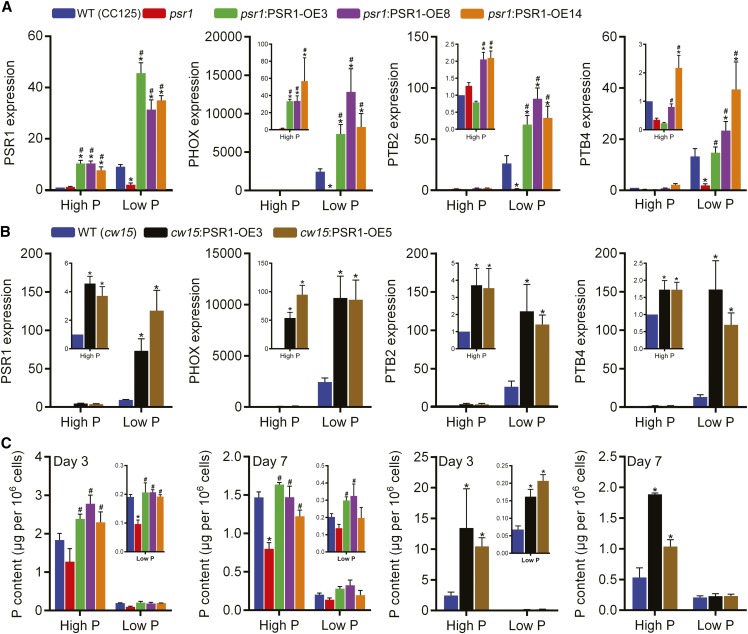
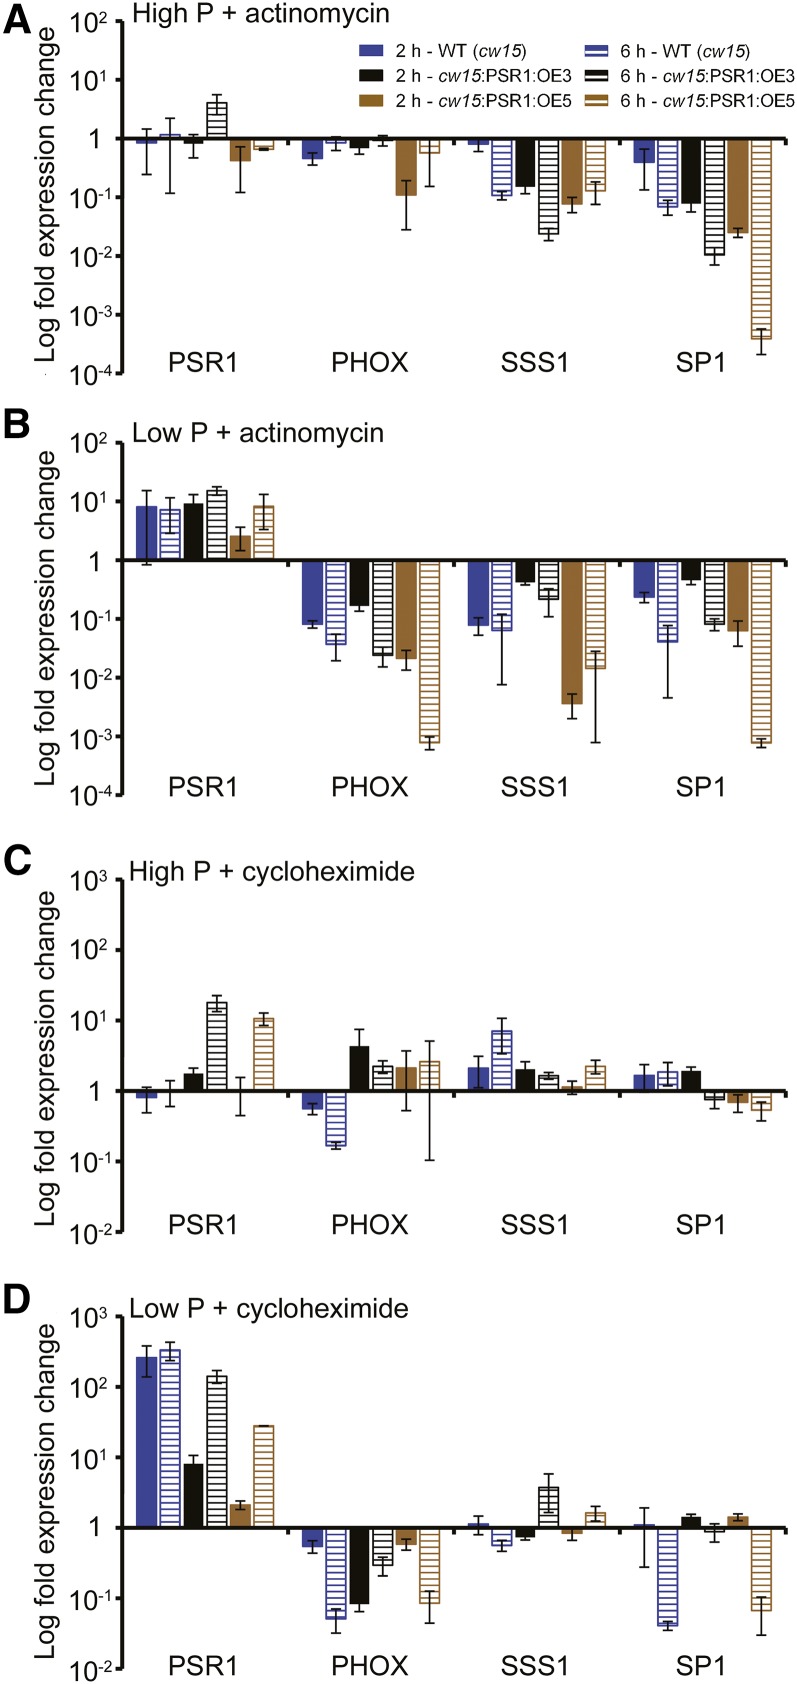
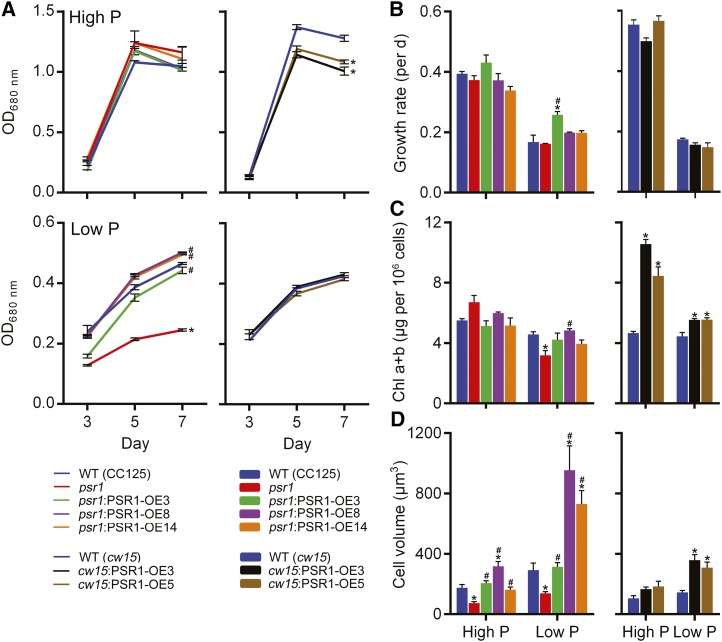
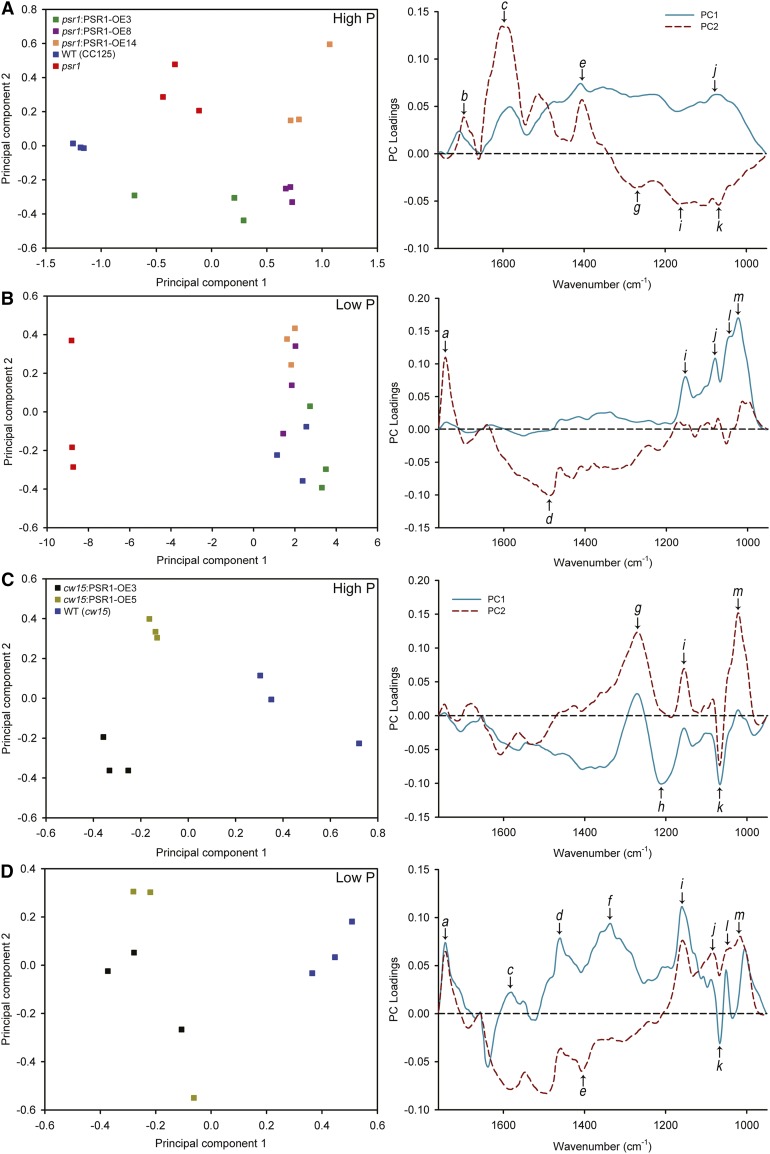
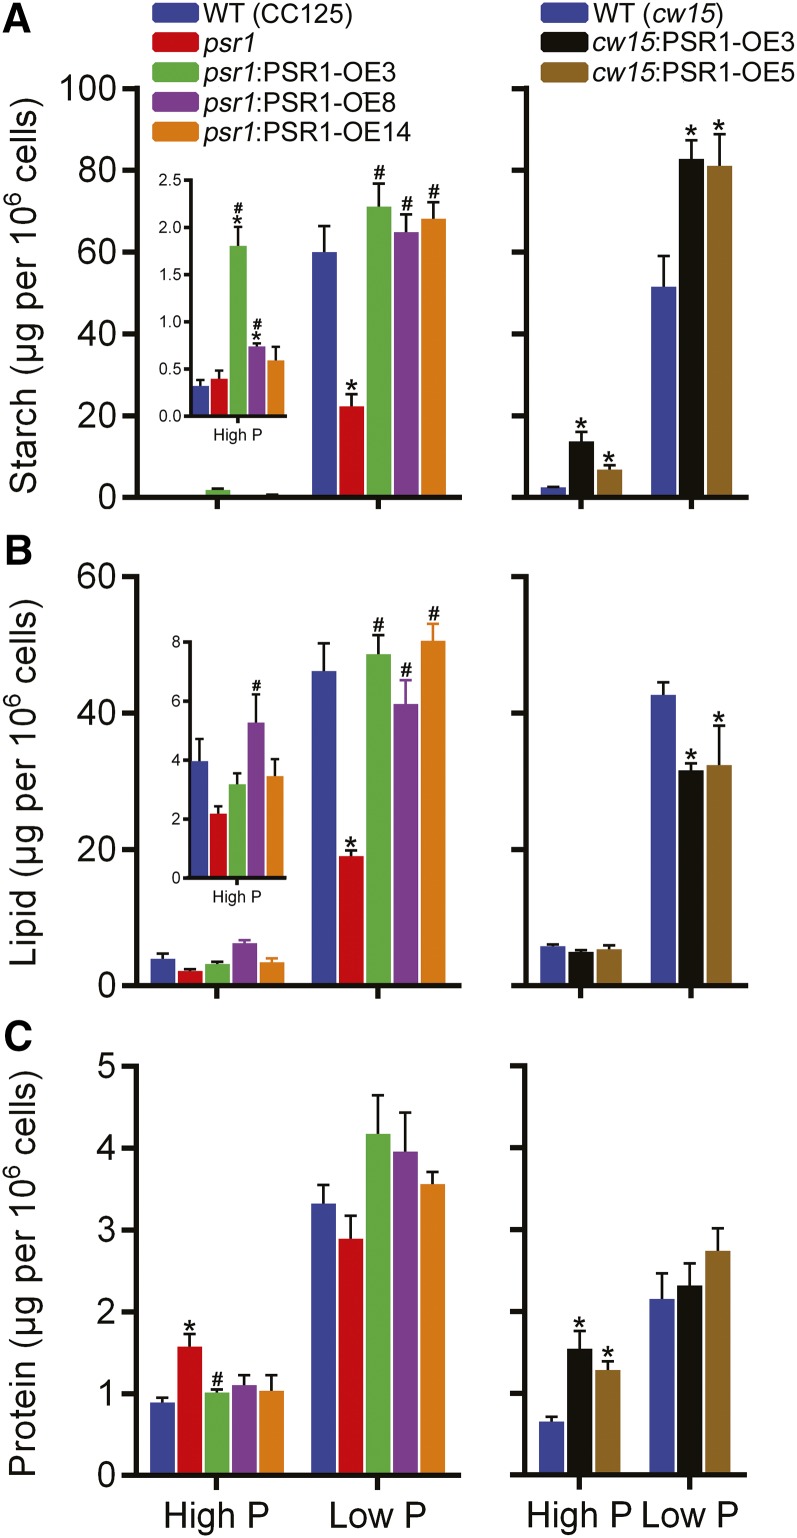
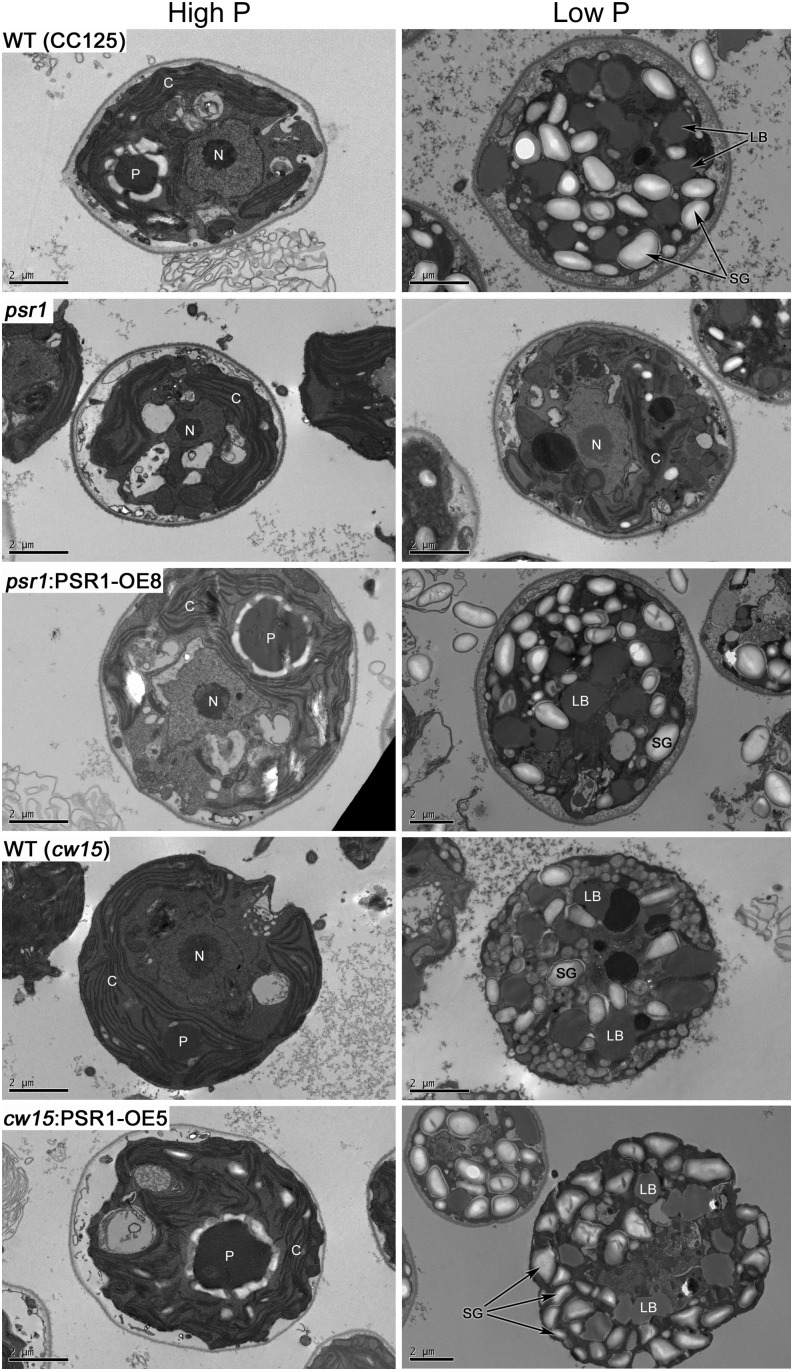
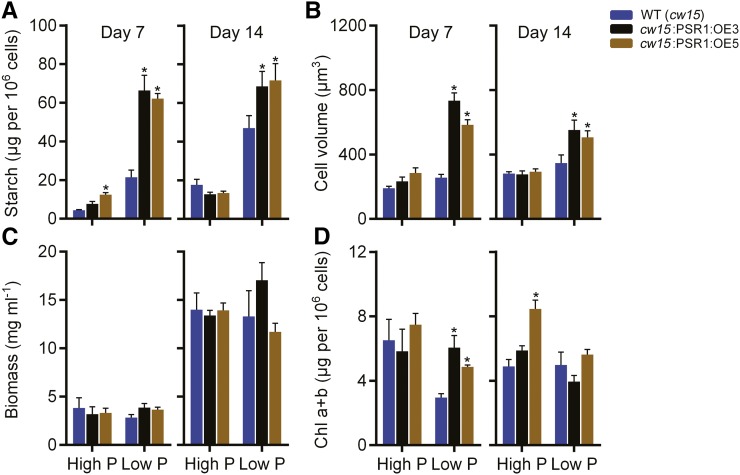
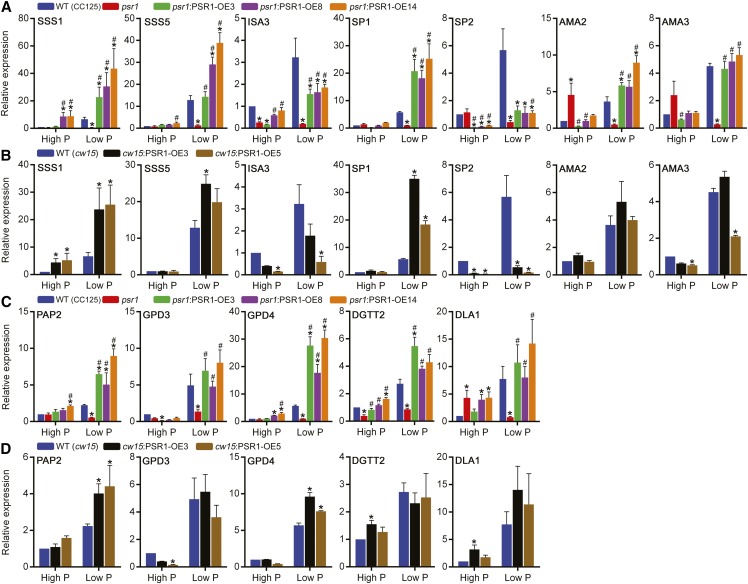
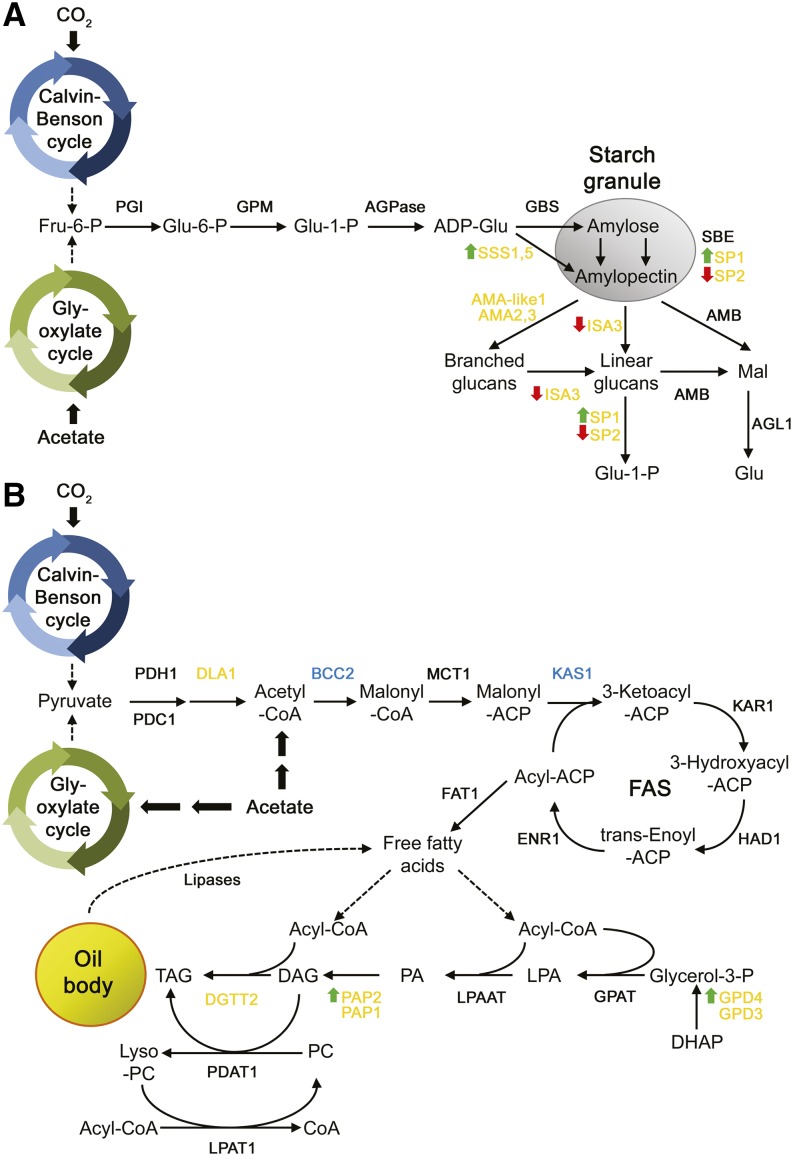
Many eukaryotic microalgae modify their metabolism in response to nutrient stresses such as phosphorus (P) starvation, which substantially induces storage metabolite biosynthesis, but the genetic mechanisms regulating this response are poorly understood. Here, we show that P starvation-induced lipid and starch accumulation is inhibited in a Chlamydomonas reinhardtii mutant lacking the transcription factor Pi Starvation Response1 (PSR1). Transcriptomic analysis identified specific metabolism transcripts that are induced by P starvation but misregulated in the psr1 mutant. These include transcripts for starch and triacylglycerol synthesis but also transcripts for photosynthesis-, redox-, and stress signaling-related proteins. To further examine the role of PSR1 in regulating lipid and starch metabolism, PSR1 complementation lines in the psr1 strain and PSR1 overexpression lines in a cell wall-deficient strain were generated. PSR1 expression in the psr1 lines was shown to be functional due to rescue of the psr1 phenotype. PSR1 overexpression lines exhibited increased starch content and number of starch granules per cell, which correlated with a higher expression of specific starch metabolism genes but reduced neutral lipid content. Furthermore, this phenotype was consistent in the presence and absence of acetate. Together, these results identify a key transcriptional regulator in global metabolism and demonstrate transcriptional engineering in microalgae to modulate starch biosynthesis.


Figures

Figure 1.
Figure 1.
psr1-dependent misregulation of P starvation-induced starch and lipid metabolism genes. Relative expression is shown for selected starch metabolism genes (A), selected fatty acid synthesis-related genes (B), selected TAG synthesis genes (C), and other selected lipid metabolism genes (D) in high-P-treated (HP) and low-P-treated (LP) wild-type (WT; CC125) and psr1 cells at day 3. Expression of the mRNA transcripts by real-time PCR was determined relative to CBLP expression and is shown relative to the high-P-treated wild-type transcript. Data points are means ± se calculated from at least three biological replicates each with three technical replicates. Asterisks denote significant differences (P < 0.05) from high-P-treated wild-type values as determined by one-way ANOVA.
Figure 2.
Figure 2.
PSR1 expression construct. A, Schematic diagram of the selectable marker-promoter gene region (not to scale) of the PSR1 expression construct. The pCB740 plasmid contains the selectable marker ARG7, the tandem HSP70A-RBCS2 promoter, and the HSP70B gene. HSP70B was replaced with the genomic fragment of PSR1 by NheI and EcoRV restriction enzyme digestion to generate the pCB740-PSR1 plasmid used for transformation into psr1 or wild-type (cw15) cells to generate complementation or overexpression lines, respectively. AF and BR are primer sites used for screening pCB740-PSR1 transformation lines. UTR, Untranslated region. B, PCR genotype analysis of pCB740-PSR1 transformation lines. PSR1 PCR products were amplified using primers AF and BR from genomic DNA isolated from three individual psr1:PSR1-OE lines and two individual cw15:PSR1-OE lines. PCR using a negative control (untransformed cw15 genomic DNA) and a positive control (pCB740+PSR1) is shown. The 600-bp marker is indicated. C and D, Expression in high-P and low-P conditions of HSP70B in wild-type (WT; cw15) cells transformed with pCB740 (C) and of PSR1 in untransformed wild-type (cw15) cells and those transformed with pCB740 (vector control; D). HSP70B and PSR1 expression was determined relative to CBLP expression by real-time PCR. Data points are means ± se calculated from three biological replicates each with three technical replicates.
Figure 3.
Figure 3.
Altered P homeostasis in PSR1 overexpression lines. A and B, Relative expression of PSR1 was quantified in psr1:PSR1 complementation lines compared with the wild type (WT; CC125) and psr1 (A) and in overexpression lines compared with the wild type (cw15; B) under high-P and low-P conditions at day 3. The relative expression of known PSR1-dependent, low-P-induced P homeostasis genes (PHOX, PTB2, and PTB4) was quantified in psr1:PSR1 complementation lines (A) and overexpression lines (B). Expression of the mRNA transcripts by real-time PCR was determined relative to CBLP expression and is shown relative to high-P-treated wild-type transcript. C, Pi accumulation in psr1:PSR1 complementation lines and overexpression lines compared with the wild type and psr1 in high-P and low-P conditions. Cellular Pi concentrations at days 3 and 7 are shown. Each data point represents the mean ± se of three biological and technical replicate culture flasks and is representative of three independent experiments. Asterisks denote significant differences (P < 0.05) from wild-type values and pound signs denote significant differences (P < 0.05) from psr1 values, both as determined by one-way ANOVA.
Figure 4.
Figure 4.
Effect of actinomycin D and cycloheximide treatment on transcript abundance in PSR1 overexpression lines. Change in expression is shown for PSR1, PHOX, SSS1, and SP1 in PSR1 overexpression lines and the wild type (WT; cw15) at day 3 following treatment for 2 h (solid bars) and 6 h (hatched bars) with the transcription inhibitor actinomycin D during high-P (A) and low-P (B) growth and with the translation inhibitor cycloheximide during high-P (C) and low-P (D) growth. Expression of the mRNA transcripts by real-time PCR was determined relative to CBLP expression, and the increase or decrease in transcript abundance is shown relative to expression without inhibitor treatment. Each data point represents the mean ± se of three biological and technical replicate culture flasks.
Figure 5.
Figure 5.
Changes in the physiology of PSR1-expressing cells in response to P starvation. Cell density determined by optical density at 680 nm (OD680nm) measurement (A) and specific growth rate determined at exponential phase from optical density at 680 nm values (B), total chlorophyll (Chl a+b; C), and biovolume (D) of PSR1 overexpression lines are shown. Chlorophyll and biovolume were quantified at day 7. Each data point represents the mean ± se of three replicates each with three technical replicates and is representative of three independent experiments. Asterisks denote significant differences (P < 0.05) from wild-type (WT) values and pound signs denote significant differences (P < 0.05) from psr1 values, both as determined by one-way ANOVA.
Figure 6.
Figure 6.
FT-IR spectroscopy analysis of PSR1 expression lines. Principal component analysis scores (left) and principal component (PC) loading plots (right) are shown for FT-IR spectra from the wild type (WT; CC125), psr1, and psr1:PSR1 complementation lines (A and B) and wild-type (cw15) and PSR1 overexpression lines (C and D) under high-P (A and C) and low-P (B and D) conditions. Analysis was performed on three replicate spectra for each sample and treatment. Selected bands that show strong changes are highlighted on the loading plots: a, νC=O of ester functional groups from lipids and fatty acids; b, νC=O of amides associated with protein (amide I); c, δ N-H of amides associated with protein (amide II); d, δas CH3 and δas CH2 of lipids and proteins; e, δas CH3 and δas CH2 of proteins, νsC-O of carboxylic groups; f, unknown; g, νasP=O of nucleic acids, phosphoryl group, due to DNA/RNA backbones, phosphorylated proteins, and polyphosphate storage products; h, νC-O-C of polysaccharides; i, νC-O of carbohydrates; j, νC-O of carbohydrates; k, νC-O-C of carbohydrates; l, νC-O of carbohydrates; m, νC-O of carbohydrates.
Figure 7.
Figure 7.
Metabolite contents in PSR1 overexpression lines. Total starch (A), lipid (B), and protein (C) were quantified at day 7 in high-P and low-P growth conditions. Each data point represents the mean ± se of three replicates each with three technical replicates and is representative of three independent experiments. Asterisks denote significant differences (P < 0.05) from wild-type (WT) values and pound signs denote significant differences (P < 0.05) from psr1 values, both as determined by one-way ANOVA.
Figure 8.
Figure 8.
Changes in the morphology of PSR1-expressing cells in response to P starvation. TEM images (representative of 15–20 images) are shown for wild-type (WT; CC125 and cw15), psr1, psr1:PSR1-OE8, and cw15:PSR1-OE5 cells in high-P and low-P conditions at day 7 of growth. Some subcellular structures are labeled: C, chloroplast; LB, lipid body; N, nucleus; P, pyrenoid; SG, starch granule. Bars = 2 µm.
Figure 9.
Figure 9.
Changes in the starch content and physiology of PSR1-expressing cells in response to P starvation in the absence of acetate. Total starch (A), biovolume (B), fresh weight biomass (C), and total chlorophyll (Chl a+b; D) of PSR1 overexpression lines are shown. Parameters were quantified at days 7 and 14 in high-P and low-P growth conditions in the absence of acetate. Each data point represents the mean ± se of three replicates each with three technical replicates and is representative of three independent experiments. Asterisks denote significant differences (P < 0.05) from wild-type (WT) values as determined by one-way ANOVA.
Figure 10.
Figure 10.
Altered starch and lipid gene expression in PSR1 overexpression lines. Relative expression of selected starch metabolism genes (A and B) and selected lipid metabolism genes (C and D) in psr1:PSR1 complementation lines is shown compared with the wild type (WT; CC125) and psr1 (A and C) and in overexpression lines compared with the wild type (cw15; B and D) under high-P and low-P conditions at day 3. Expression of the mRNA transcripts by real-time PCR was determined relative to CBLP expression and is shown relative to the high-P-treated wild-type transcript. Each data point represents the mean ± se of three biological replicates each with three technical replicates. Asterisks denote significant differences (P < 0.05) from wild-type values and pound signs denote significant differences (P < 0.05) from psr1 values, both as determined by one-way ANOVA.
Figure 11.
Figure 11.
Model of the effects of PSR1 overexpression on starch and lipid metabolism. The schematic diagrams represent starch synthesis and breakdown (A) and fatty acid and TAG synthesis (B). Genes in yellow and blue are those up-regulated and down-regulated by P starvation, respectively, as determined by real-time PCR. For gene definitions, see Supplemental Table S1. Green up arrows and red down arrows indicate genes that are positively or negatively regulated by PSR1 overexpression, respectively.

References

    1. Aksoy M, Pootakham W, Pollock SV, Moseley JL, González-Ballester D, Grossman AR (2013) Tiered regulation of sulfur deprivation responses in Chlamydomonas reinhardtii and identification of an associated regulatory factor. Plant Physiol 162: 195–211 - PMC - PubMed
    1. Bajhaiya AK, Dean AP, Driver T, Trivedi DK, Rattray NJW, Allwood JW, Goodacre R, Pittman JK (2016) High-throughput metabolic screening of microalgae genetic variation in response to nutrient limitation. Metabolomics 12: 9. - PMC - PubMed
    1. Baker EJ, Liggit P (1993) Accelerated poly(A) loss and mRNA stabilization are independent effects of protein synthesis inhibition on α-tubulin mRNA in Chlamydomonas. Nucleic Acids Res 21: 2237–2246 - PMC - PubMed
    1. Ball S, Marianne T, Dirick L, Fresnoy M, Delrue B, Decq A (1991) A Chlamydomonas reinhardtii low-starch mutant is defective for 3-phosphoglycerate activation and orthophosphate inhibition of ADP-glucose pyrophosphorylase. Planta 185: 17–26 - PubMed
    1. Ball SG, Morell MK (2003) From bacterial glycogen to starch: understanding the biogenesis of the plant starch granule. Annu Rev Plant Biol 54: 207–233 - PubMed

Publication types

MeSH terms