. 2016 Apr 20;44(7):e67.
doi: 10.1093/nar/gkv1495. Epub 2015 Dec 23.

Standardizing chromatin research: a simple and universal method for ChIP-seq

Affiliations

Standardizing chromatin research: a simple and universal method for ChIP-seq

Laura Arrigoni et al. Nucleic Acids Res. .

Abstract

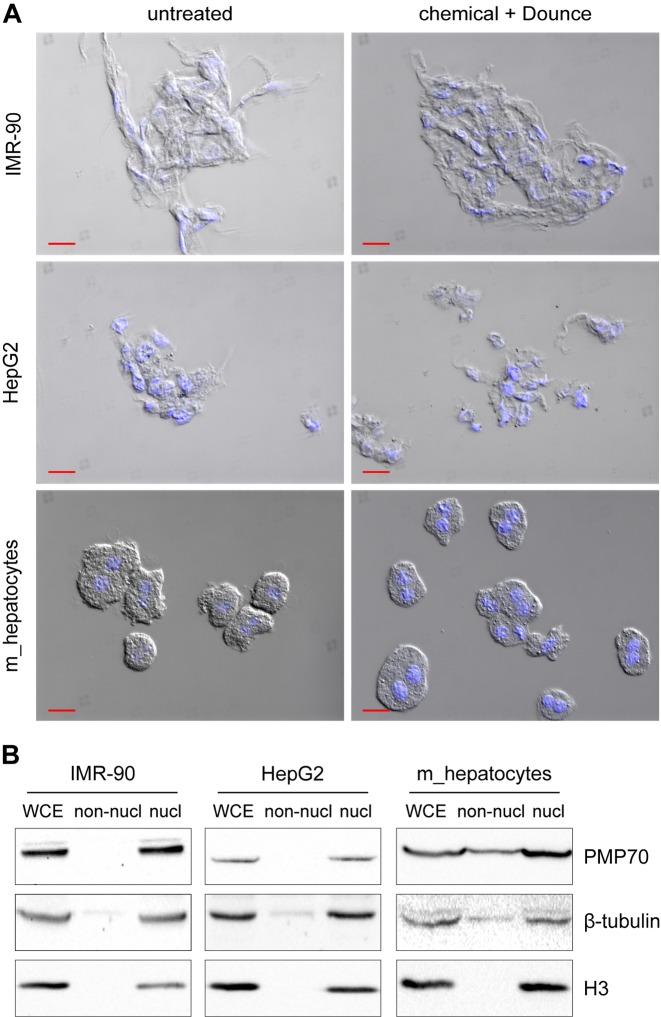
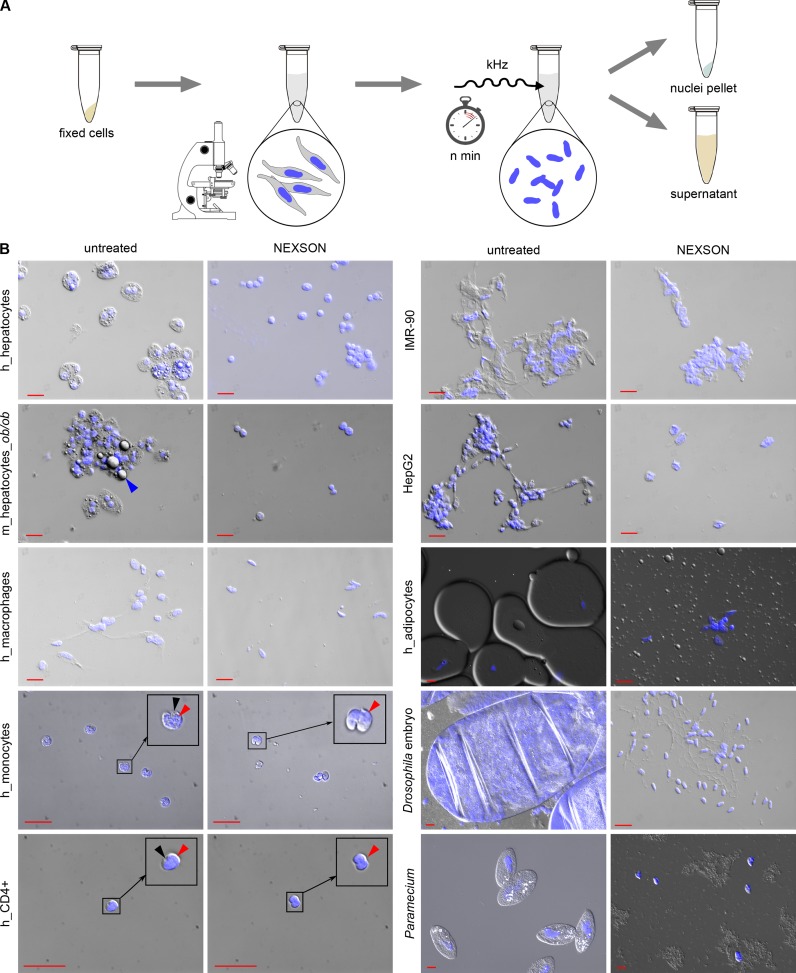
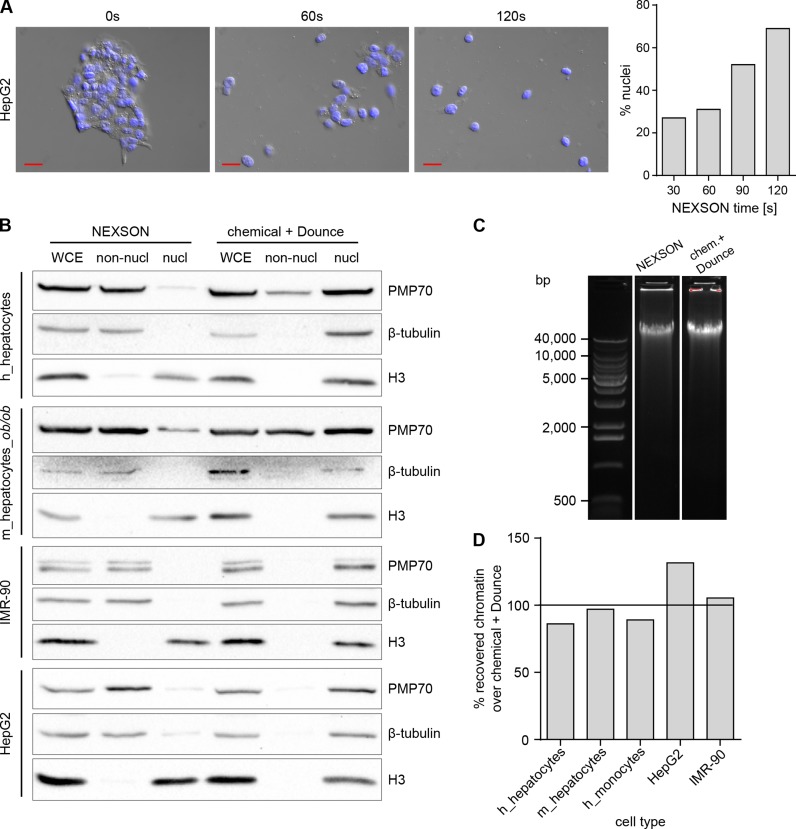
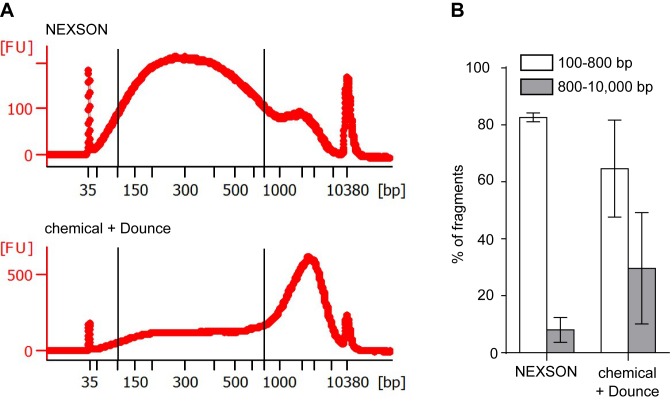
Chromatin immunoprecipitation followed by next generation sequencing (ChIP-seq) is a key technique in chromatin research. Although heavily applied, existing ChIP-seq protocols are often highly fine-tuned workflows, optimized for specific experimental requirements. Especially the initial steps of ChIP-seq, particularly chromatin shearing, are deemed to be exceedingly cell-type-specific, thus impeding any protocol standardization efforts. Here we demonstrate that harmonization of ChIP-seq workflows across cell types and conditions is possible when obtaining chromatin from properly isolated nuclei. We established an ultrasound-based nuclei extraction method (NEXSON: Nuclei EXtraction by SONication) that is highly effective across various organisms, cell types and cell numbers. The described method has the potential to replace complex cell-type-specific, but largely ineffective, nuclei isolation protocols. By including NEXSON in ChIP-seq workflows, we completely eliminate the need for extensive optimization and sample-dependent adjustments. Apart from this significant simplification, our approach also provides the basis for a fully standardized ChIP-seq and yields highly reproducible transcription factor and histone modifications maps for a wide range of different cell types. Even small cell numbers (∼10,000 cells per ChIP) can be easily processed without application of modified chromatin or library preparation protocols.


Figures

Figure 1.
Figure 1.
Traditional methods fail to isolate nuclei from formaldehyde-fixed cells. (A) Microscope pictures of fixed samples resuspended in phosphate-buffered saline, prior (untreated) or after (chemical + Dounce) nuclei extraction. Pictures show the merge between DAPI (blue: nuclei) and differential interference contrast (DIC) channels. Red scale bar: 20 μm. Different cell types were fixed for 5 min using formaldehyde; subsequently, cells pellets were freeze-thawed and nuclei were extracted using detergent-containing hypotonic buffers in conjunction with mechanical homogenization (30 Dounce homogenizer strokes with a tight pestle). (B) Western blot analysis of fractions collected prior (WCE: whole cell extract) or after nuclei extraction treatment (non-nucl: non-nuclear equals supernatant after treatment; nucl: nuclear extract equals pellet after treatment). PMP70, β-tubulin (cytoplasmic markers) and histone H3 (nuclear marker) were visualized with the respective antibodies on the same experiment to confirm successful nuclei extraction. Abbreviation: m: mouse.
Figure 2.
Figure 2.
Nuclei extraction by sonication (NEXSON) from formaldehyde-fixed cells. (A) Schematic representation of NEXSON. Formaldehyde-fixed cells are suspended in a buffer compatible with nuclei extraction and subsequent ChIP, and treated with ultrasound. Progression of nuclei extraction is controlled in real-time using a benchtop phase-contrast microscope. Based on the cell type in use, the sonication time needs marginal adjustments. Nuclear and non-nuclear fractions are separated by centrifugation when most of the nuclei were isolated. The whole procedure can be completed in less than 20 min. (B) Various fixed cell types or whole organisms (Drosphila embryos in cellularization stage five, Paramecium) were treated by NEXSON. Formaldehyde-fixed cells were resuspended in nuclei extraction buffer and treated by sonication to induce nuclei extraction. Pictures in DAPI (blue, nuclei) and differential interference contrast (DIC) channels were taken before (untreated) and after (NEXSON) ultrasound treatment. The analyzed cell types included blood cells (in vitro-derived macrophages, monocytes and CD4+ cells), high fat-containing cells (adipocytes and hepatocytes), as well as cell lines (HepG2, IMR-90). Monocyte and CD4+ pictures were enlarged for better visualization of nucleus and cytoplasm (encircled): red arrows indicate the nuclei, black arrows the cytoplasm. Fat droplets are highlighted in the m_hepatocytes_ob/ob sample (blue arrow). Red scale bar: 20 μm. Abbreviations: h: human, m: mouse, m_hepatocytes_ob/ob: hepatocytes extracted from leptin-deficient obese mice.
Figure 3.
Figure 3.
NEXSON quality controls. (A) NEXSON time-course on HepG2. Fixed cell pellet was resuspended in FL buffer and treated by NEXSON using increasing amount of time. A small aliquot of cells was collected at 0, 30, 60, 90 and 120 s of ultrasound treatment and inspected with a microscope. Microscope images show the merge between DAPI and differential interference contrast (DIC) channels at the indicated time points. Red scale bar: 20 μm. For nuclei counting, 150 cells/nuclei were counted; bar chart shows the percentage of isolated nuclei over the total at the indicated time point. (B) Western blot analysis of non-nuclear (non-nucl) and nuclear (nucl) fractions obtained after NEXSON or chemical + Dounce treatment were conducted to check the effectiveness of the respective nuclei extraction protocol. Whole cell extract (WCE) was collected prior nuclei extraction and served as control. Cytoplasmic (PMP70 and β-tubulin) and nuclear (histone H3) markers were used to inspect the nucleus-cytoplasm fractionation. Abbreviations: h: human, m: mouse, m_hepatocytes_ob/ob: hepatocytes extracted from leptin-deficient obese mice. (C) Quality check of DNA integrity after NEXSON or chemical + Dounce treatment. Fixed cells were treated with the indicated nuclei extraction procedure; afterwards, an aliquot of chromatin was de-crosslinked and DNA was purified. Equal DNA amounts were loaded on a 0.7% agarose gel to inspect DNA integrity. Main base pairs (bp) of the molecular weight marker are indicated. (D) Comparison of chromatin recovery after NEXSON or chemical + Dounce treatment for nuclei extraction. Fixed cells were resuspended in FL buffer, splitted in two aliquots and treated with either NEXSON or the Chemical + Dounce nuclei isolation protocol. Nuclear preparations were resuspended in shearing buffer, chromatin was sheared and DNA purified and quantified. Bar chart shows the percentage of chromatin recovered after NEXSON over the chromatin obtained after chemical and Dounce treatment.
Figure 4.
Figure 4.
NEXSON enhances the reproducibility of chromatin shearing. (A) Size distribution after chromatin shearing when extracting nuclei with either NEXSON or chemical and Dounce treatment from a single, formaldehyde-fixed cell batch (human monocytes). Chromatin was sheared with identical sonicator settings and DNA size distribution was analyzed using capillary electrophoresis. Note that differences in ultrasound exposure between the two workflows (NEXSON or chemical + Dounce) were normalized prior chromatin shearing. Electropherograms, generated with Agilent expert 2100 software, show the size distribution of the respective samples. Optimal chromatin size distribution for ChIP-seq is located between the two bars (100–800 bp). x axis: base pairs (bp), y axis: fluorescence units (FU). (B) Quantitative analysis of the chromatin size distribution of three different samples after nuclei extraction with NEXSON or chemical + Dounce homogenizer treatment. Bars show the percentage of DNA fragments in the optimal (between 100 and 800 bp, white bars) or inadequate (800–10 000 bp, gray bars) size range for ChIP-seq. Percentages of fragments in the respective region are calculated with Agilent Bioanalyzer software and averaged (error bars indicate s.d.; n = 3: fixed monocytes, IMR-90 and hepatocytes samples).
Figure 5.
Figure 5.
ChIP-seq of NEXSON-treated cells yields high-quality signals. Read coverage profiles of histone modification ChIP-seq for human monocytes (orange), hepatocytes (blue) and HepG2 cell line (green) prepared by NEXSON. Read mapping statistics and global ChIP enrichment (FRiP, Fraction of mapped Reads in Peaks) are given next to each sample. Per ChIP reaction, between 300 000 and 850 000 cells were used. Please note cell-type-specific epigenetic marking of transcript start sites (TSS) and gene bodies, e.g. of fetuin-A (AHSG), which is produced exclusively by the liver. ChIP-seq tracks show a 320 kb region of human chromosome 3; the signal of each sample is normalized with respect to sequencing depth (26).
Figure 6.
Figure 6.
ChIP-seq with NEXSON gives high-quality and reproducible enrichment signals even for limited cell numbers. Comparison of H3K4me3 and H3K27me3 IMR-90 ChIP-seq samples prepared by NEXSON with external data from the NIH Roadmap Consortium (4). NEXSON-treated samples used either 200 000, 100 000, 10 000, 1 000 or 100 cells per ChIP reaction as indicated. Roadmap samples used a high cell number (∼10 million cells/ChIP). (A) Read coverage profiles of NEXSON (orange) and Roadmap (blue) samples. The read coverage of all samples is sequencing-depth normalized. Shown is a 500 kb region of human chromosome 7. (B) Genome-wide correlation of read coverage. The heatmap shows the pairwise Pearson correlation coefficient based on read coverage of 1 kb bins excluding signal artifact regions. (C) ChIP-seq enrichment over all TSS annotated in RefSeq genes. The heatmap shows regions of 5 kb up- and downstream of the TSS with each row representing a distinct TSS. The signal intensity is measured in log2 read coverage normalized by sequencing depth. Regions were clustered by the k-means algorithm.
Figure 7.
Figure 7.
CTCF transcription factor ChIP-seq works reliably with NEXSON down to 100 000 cells. CTCF ChIP-seq enrichment in HepG2 over a consensus set of CTCF peaks. The heatmap shows all CTCF peaks ± 1 kb with each row representing a distinct peak. The signal intensity is measured in log2 read coverage normalized by sequencing depth. NEXSON-treated samples used medium (500 000) to low (100 000 or 10 000) cell numbers per ChIP reaction as indicated. External ENCODE samples used a high cell number (∼20 million cells/ChIP).
Figure 8.
Figure 8.
NEXSON ensures higher ChIP-seq reproducibility than other methods when using low cell numbers. Genome-wide correlation of ChIP-seq data from HepG2 cells treated with NEXSON compared to three existing protocols (ENCODE, BLUEPRINT, Young) and external ENCODE data (3). Pairwise correlation of (A) H3K4me3 and H3K27me3 histone modification ChIP-seq data (10 000 cells/ChIP), and (B) CTCF transcription factor ChIP-seq data (100 000 cells/ChIP), all produced in this study, with external ENCODE reference data (orange). External ENCODE data sets from two different labs are additionally compared with each other (grey). (C) Intra-protocol comparability of CTCF ChIP-seq, quantified by pairwise correlation of samples obtained from medium (500 000) versus low (100 000) cell numbers per ChIP reaction. All plots show the Pearson correlation coefficient on 1 kb bins excluding signal artifact regions.

References

    1. Barski A., Cuddapah S., Cui K., Roh T.-Y., Schones D.E., Wang Z., Wei G., Chepelev I., Zhao K. High-resolution profiling of histone methylations in the human genome. Cell. 2007;129:823–837. - PubMed
    1. Johnson D.S., Mortazavi A., Myers R.M., Wold B. Genome-wide mapping of in vivo protein-DNA interactions. Science. 2007;316:1497–1502. - PubMed
    1. ENCODE Project Consortium. Bernstein B.E., Birney E., Dunham I., Green E.D., Gunter C., Snyder M. An integrated encyclopedia of DNA elements in the human genome. Nature. 2012;489:57–74. - PMC - PubMed
    1. Roadmap Epigenomics Consortium. Kundaje A., Meuleman W., Ernst J., Bilenky M., Yen A., Kheradpour P., Zhang Z., Heravi-Moussavi A., Liu Y., Amin V., et al. Integrative analysis of 111 reference human epigenomes. Nature. 2015;518:317–330. - PMC - PubMed
    1. Egelhofer T.A., Minoda A., Klugman S., Lee K., Kolasinska-Zwierz P., Alekseyenko A.A., Cheung M.-S, Day D.S., Gadel S., Gorchakov A.A., et al. An assessment of histone-modification antibody quality. Nat. Struct. Mol. Biol. 2011;18:91–93. - PMC - PubMed

Publication types