. 2016 Feb 29;44(4):1854-70.
doi: 10.1093/nar/gkv1500. Epub 2015 Dec 23.

A genome landscape of SRSF3-regulated splicing events and gene expression in human osteosarcoma U2OS cells

Affiliations

A genome landscape of SRSF3-regulated splicing events and gene expression in human osteosarcoma U2OS cells

Masahiko Ajiro et al. Nucleic Acids Res. .

Abstract

Alternative RNA splicing is an essential process to yield proteomic diversity in eukaryotic cells, and aberrant splicing is often associated with numerous human diseases and cancers. We recently described serine/arginine-rich splicing factor 3 (SRSF3 or SRp20) being a proto-oncogene. However, the SRSF3-regulated splicing events responsible for its oncogenic activities remain largely unknown. By global profiling of the SRSF3-regulated splicing events in human osteosarcoma U2OS cells, we found that SRSF3 regulates the expression of 60 genes including ERRFI1, ANXA1 and TGFB2, and 182 splicing events in 164 genes, including EP300, PUS3, CLINT1, PKP4, KIF23, CHK1, SMC2, CKLF, MAP4, MBNL1, MELK, DDX5, PABPC1, MAP4K4, Sp1 and SRSF1, which are primarily associated with cell proliferation or cell cycle. Two SRSF3-binding motifs, CCAGC(G)C and A(G)CAGCA, are enriched to the alternative exons. An SRSF3-binding site in the EP300 exon 14 is essential for exon 14 inclusion. We found that the expression of SRSF1 and SRSF3 are mutually dependent and coexpressed in normal and tumor tissues/cells. SRSF3 also significantly regulates the expression of at least 20 miRNAs, including a subset of oncogenic or tumor suppressive miRNAs. These data indicate that SRSF3 affects a global change of gene expression to maintain cell homeostasis.


Figures

Figure 1.
Figure 1.
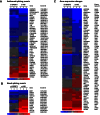
SRSF3-targeted splicing events and changes of gene expression in U2OS cells. (AC) Clustered heat maps for the top events regulated by SRSF3 identified by ExonHit splice arrays. SRSF3-targeted genes in three experimental repeats consist of 43 evidenced splicing events from 40 genes (A), 14 novel splicing events from 14 genes (B) and 62 gene with expression changes (C), with a threshold of ≥2-fold changes in log2 as determined by a B/E method and FDR cutoff of 0.1 for gene expression change and 0.2 for splicing alternation. Individual gene names and event ID are indicated on the right. Event ID specifies individual splicing events being detailed in Supplementary Table S2. SRSF3 expression level in U2OS cells with si-SRSF3 or si-NS treatment was included in (C) as a control. Color key scales in log2 values are indicated at the bottom of each panel. The full list of B/E ratio analysis result is available at NCBI GEO (http://www.ncbi.nlm.nih.gov/geo/) (accession number GSE22149).
Figure 2.
Figure 2.
Functional classification and MEME motif analysis of the identified SRSF3-responsive targets. (A) Functional classification of the SRSF3-responsive targets with alternative splicing (evidenced and novel splicing) events and gene expression changes. (B and C) Identification of enriched motifs in SRSF3-responsive alternative exons. Three hundred nucleotides (nts) upstream and downstream of 3′ splice site (3′ ss, B) or 5′ splice site (5′ ss, C) of SRSF3-responsive alternative exons were search for enriched motifs by MEME. MEME motifs are represented by sequence LOGO derived from position-specific probability matrices. A single motif around the 3′ ss (B) and two motifs around the 5′ ss (C) were identified. Each motif occurrence was counted by 50 nts as window size up to 300 nts upstream or downstream of 3′ ss or 5′ ss of alternative exons. *P < 0.05; **P < 0.01 by Student's t-test. (D) SRSF3 in HeLa cell extract binds to the enriched motif 1 and motif 2 from EP300 exon 14, CKLF exon 3 and PKP4 exon 7 by RNA pull-down assays. HPV16 ESE (16ESE) or its mutant (16ESE mt) RNA oligo (10) served as a positive or negative control. One representative experiment of two is shown.
Figure 3.
Figure 3.
Validation of the SRSF3-responsive events identified by B/E ratio analysis. U2OS and HeLa cells were transfected with Dharmacon si-NS or si-SRSF3 twice in an interval of 48 h. Total RNA from the cells were analyzed by RT-PCR to validate transcript level change of ERRFI1 (A), ANXA1 (B) and TGFB2 (C), splicing alteration of PUS3 alternative 5′ ss usage in the exon 3 (D), and exon skipping of the PKP4 exon 7 (E), KIF23 exon 18 (F), EP300 exon 14 (G) and CLINT1 exon 11 (H). The primers used in RT-PCR are shown as bars above (forward primers) and below (reverse primers) each RNA splicing diagram. GAPDH served as a loading control. RT+, reaction with reverse transcriptase; RT−, reaction without reverse transcriptase; si-SRSF3Amb, si-SRSF3 from Ambion; FC, fold-change; PSI, percent spliced-in of the alternative exon(s) or splice site (% inclusion = inclusion/sum of inclusion + exclusion).
Figure 4.
Figure 4.
Validation of other SRSF3-responsive RNA splicing events identified by ANOVA analysis. Following transfection of U2OS or HeLa cells with Dharmacon si-NS or si-SRSF3 twice in an interval of 48 h, total RNA from the cells was analyzed by RT-PCR for exon skipping of CHK1 exon 3 (A), SMC2 exon 3–4 (B), CKLF exon 3 (C), MAP4 exon 10 (D), MBNL1 exon 4 (E), MELK exon 11 (F), DDX5 exon 12 (G) and PABPC1 exon 10–11 (H). See other details in Figure 3.
Figure 5.
Figure 5.
Validation for protein expression changes following SRSF3 knockdown in U2OS and HeLa cells. U2OS and HeLa cells were transfected with Dharmacon si-NS or si-SRSF3 twice with an interval of 48 h. Whole cell lysates at 48 h after the second transfection were analyzed by Western blotting for ERRFI1 (A), ANXA1 (B), TGFβ2 (C), p300 (D) and CHK1 (E). hnRNP K or β-actin served as a sample loading control. FL, full length p300; ΔE14, p300 isoform produced by exon 14 skipping; FC, fold-change.
Figure 6.
Figure 6.
SRSF3 promotes inclusion of the EP300 exon 14 through an exonic SRSF3-binding site. (A) Diagram of EP300 minigene structure and exon 14 mutants containing detection (Δ1, Δ2, Δ3 and Δ4) of a 6-nt, putative SRSF3-binding motif. Red boxes a, b, c and d indicate individual putative SRSF3-binding motif. The EP300 minigene has a 623-bp deletion in the intron 14 indicated by a vertical line. PCMV IE, cytomegalovirus immediate early promoter; pASV40, SV40 polyadenylation signal. (B and C) Deletion of a putative SRSF3-binding motif increases skipping of the EP300 exon 14. HeLa cells were transfected with individual EP300 minigenes or a parental vector pEGFP-N1 for 24 h, and skipping of the minigene exon 14 was determined by RT-PCR with a primer set for EP300 exon 13 (F13, forward primer) and vector sequence (Rvec, reverse primer, diagrammed on the right). GAPDH RNA served as a loading control. RT-PCR products were resolved by gel electrophoresis, the band intensity was measured, and after normalizing to GAPDH RNA, a skipping rate (%) of the EP300 exon 14 was calculated. Shown in bar graphs (C) are means ± SD from two separate experiments. *P < 0.05 by Student's t-test. (DG) Introduction of point mutations into the SRSF3-binding motif c in the EP300 exon 14 disrupts its SRSF3 binding and splicing activity. Schematic diagram of the SRSF3-binding motif c in the exon 14 of the EP300 minigene construct is shown in (D), with its sequence motif (red) for wt and mt-1 or -2 containing point mutations (nucleotides underlined). Synthetic RNA oligos with the indicated RNA sequence in (D) were examined for binding of SRSF3, PTB and other SR proteins using HeLa nuclear extract and Western blot assays with indicated antibodies (E). Kaposi's sarcoma associated herpesvirus K8β RNA oligos oVM241 and oVM242 in (E) are positive and negative SRSF3 binding controls (11). HeLa cells transfected with individual EP300 minigenes or a parental vector pEGFP-N1 for 24 h were analyzed by RT-PCR with a primer set of F13 and Rvec (B) for splicing skipping of the EP300 exon 14 (F). Percentage of the EP300 exon 14 skipping are calculated as described (B) and shown in bar graph (G) are means ± SD from two separate experiments. *P < 0.05 and **P < 0.01 by Student's t-test.
Figure 7.
Figure 7.
SRSF3 and SRSF1 are mutually regulated in cells. (A) SRSF3 knockdown in HeLa cells activates the usage of a cryptic intron in the SRSF1 exon 4. HeLa cells were transfected with Dharmacon si-NS or si-SRSF3 as described in Figure 4 and total RNA from the cells was analyzed by RT-PCR for activation of a cryptic intron (dark box) in the SRSF1 3′ UTR. (B) Knocking down SRSF1 expression in HeLa cells affects SRSF3 transcript level, but not inclusion or skipping of the SRSF3 exon 4. Knockdown of SRSF1 expression in HeLa cells was performed as described in Figure 4. See other details in Figure 3. (C) Knocking down SRSF1 expression in HeLa cells does not affect SRSF3 RNA stability in a pause-chase RNA decay assay. Following 10 μg/ml actinomycin D treatment for 0, 1, 2, 4 and 8 h, HeLa cells with Dharmacon si-NS or si-SRSF1 knockdown as described in Figure 4 were examined for the quantitative levels of the exon 4-skipped SRSF3 RNA and GAPDH RNA at each time point by quantitative RT-qPCR. After normalizing to GAPDH RNA, the exon 4-skipped SRSF3 RNA decay rate was calculated by setting the RNA levels at 0 h as 100% for both si-NS and si-SRSF1 groups. Exponential fitting curves over each time point are determined as y = e−0.185x, R2 = 0.8739 for si-NS group and y = e−0.201x, R2 = 0.9819 for si-SRSF1 group. Half-life (t1/2) of the exon 4-skipped SRSF3 RNA was calculated as 3.8 h for si-NS transfected cells, and 3.5 h for si-SRSF1 transfected cells. (D) Expression of SRSF3 and SRSF1 is mutually regulated each other. HeLa or U2OS cells were transfected with Dharmacon si-NS, si-SRSF1, or si-SRSF3 twice with an interval of 48 h, and analyzed by Western blot for the corresponding protein expression by using an anti-SRSF1 or anti-SRSF3 antibody. (E) Overexpression of T7-SRSF3 increases the expression of SRSF1 in MEF3T3 cells revealed by Western blot.
Figure 8.
Figure 8.
SRSF3 and SRSF1 are mutually regulated in cell lines and coexpressed in normal and cancer cells. (A) SRSF3 and SRSF1 are coexpressed along with SRm160, SRSF5, SRSF2 and SRSF9, but only moderately with SRSF4 and SRSF6 in MRC-5, WI-38, U2OS and HeLa cells. Cell lysates for blotting SRSF3 in our previous publication (28) were reprobed by anti-SRSF1 or a pan-SR protein antibody mAb104. (B) Several paired (tumor versus tumor-adjacent normal tissues) samples from colon cancers were compared by Western blot assays for SRSF1 and SRSF3 coexpression. β-actin or β-tubulin served as a loading control for individual Western blot assay. FC, fold-change. (C) WST-8 assay for cell proliferation of HeLa and U2OS cells. Mean ± SD were calculated from three biological repeats. *P < 0.05 and **P < 0.01 by Student's t-test.

References

    1. Wang E.T., Sandberg R., Luo S., Khrebtukova I., Zhang L., Mayr C., Kingsmore S.F., Schroth G.P., Burge C.B. Alternative isoform regulation in human tissue transcriptomes. Nature. 2008;456:470–476. - PMC - PubMed
    1. Charizanis K., Lee K.Y., Batra R., Goodwin M., Zhang C., Yuan Y., Shiue L., Cline M., Scotti M.M., Xia G., et al. Muscleblind-like 2-mediated alternative splicing in the developing brain and dysregulation in myotonic dystrophy. Neuron. 2012;75:437–450. - PMC - PubMed
    1. Weyn-Vanhentenryck S.M., Mele A., Yan Q., Sun S., Farny N., Zhang Z., Xue C., Herre M., Silver P.A., Zhang M.Q., et al. HITS-CLIP and integrative modeling define the Rbfox splicing-regulatory network linked to brain development and autism. Cell Rep. 2014;6:1139–1152. - PMC - PubMed
    1. Burghes A.H., Beattie C.E. Spinal muscular atrophy: why do low levels of survival motor neuron protein make motor neurons sick. Nat. Rev. Neurosci. 2009;10:597–609. - PMC - PubMed
    1. Pittman A.M., Fung H.C., de S.R. Untangling the tau gene association with neurodegenerative disorders. Hum. Mol. Genet. 2006;15:R188–R195. - PubMed

Publication types