

doi: 10.1093/neuonc/nov297.
American Brain Tumor Association Adolescent and Young Adult Primary Brain and Central Nervous System Tumors Diagnosed in the United States in 2008-2012
Affiliations
- PMID: 26705298
- PMCID: PMC4690545
- DOI: 10.1093/neuonc/nov297
Item in Clipboard
American Brain Tumor Association Adolescent and Young Adult Primary Brain and Central Nervous System Tumors Diagnosed in the United States in 2008-2012
Neuro Oncol.
2016 Jan.
No abstract available
Figures

Average Annual Age-Adjusted Incidence Rates for the Five Most Common Cancers in Persons Age A) 15-39 Years, B) 15-19 Years, C) 20-24 Years, D) 25-29 Years, E) 30-34 Years, and F) 35-39 Years, (CBTRUS 2008-2012 and USCS 2008-2012).

Average Annual Age-Adjusted and Crude Mortality Rates for the Five Most Common Causes of Death Due to Cancer in Persons Age A) 15-39 Years, B) 15-19 Years, C) 20-24 Years, D) 25-29 Years, E) 30-34 Years, and F) 35-39 Years, (NVSS 2008-2012).

Average Annual Age-Adjusted Incidence Rates and Annual Average Casesa of Primary Brain and CNS Tumors by Age Groups (15-39 Years), (CBTRUS 2008-2012).

Average Annual Age-Adjusted Incidence Rates of All Primary Brain and CNS Tumors by Region of the United States (Age 15-39 Years), (CBTRUS 2008-2012).

Average Annual Age-Adjusted Incidence Rates of All Malignant Brain and CNS Tumors by Region of the United States (Age 15-39 Years), (CBTRUS 2008-2012).

Average Annual Age-Adjusted Incidence Rates of All Non-Malignant Brain and CNS Tumors by Region of the United States (Age 15-39 Years), (CBTRUS 2008-2012).

Distributiona of All Primary Brain and CNS Tumors by Site, Age 15-39 Years (Five-Year Total = 53,083), (CBTRUS 2008-2012).
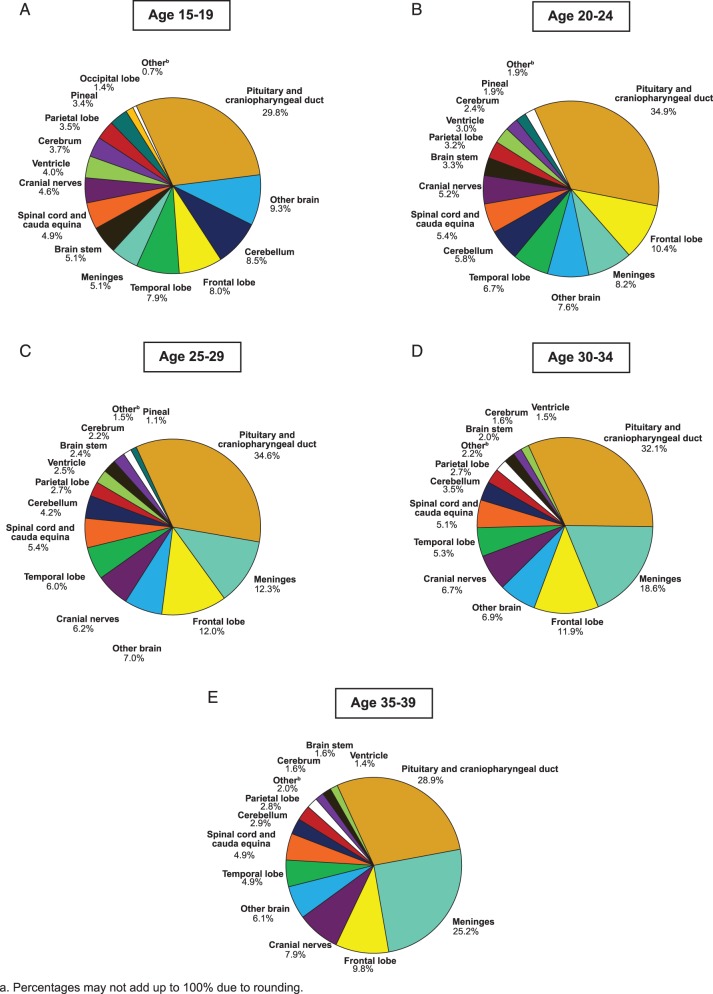
Distributiona of All Primary Brain and CNS Tumors by Site and Age Groups A) 15-19 Years (Five-Year Total = 6,747), B) 20-24 Years (Five-Year Total = 7,765), C) 25-29 Years (Five-Year Total = 10,385), D) 30-34 Years (Five-Year Total = 12,626), and E) 35-39 Years (Five-Year Total = 15,560), (CBTRUS 2008-2012).

Distributiona of Primary Malignant Brain and CNS Tumors by Site, Age 15-39 Years (Five-Year Total = 16,742), (CBTRUS 2008-2012).

Distributiona of Primary Malignant Brain and CNS Tumors by Site and Age Groups A) 15-19 Years (Five-Year Total = 2,747), B) 20-24 Years (Five-Year Total = 2,728), C) 25-29 Years (Five-Year Total = 3,421), D) 30-34 Years (Five-Year Total = 3,721), and E) 35-39 Years (Five-Year Total = 4,125), (CBTRUS 2008-2012).

Distributiona of Non-Malignant Primary Brain and CNS Tumors by Site, Age 15-39 Years (Five-Year Total = 36,341), (CBTRUS 2008-2012).

Distributiona of Non-Malignant Primary Brain and CNS Tumors by Site by Age Groups A) 15-19 Years (Five-Year Total = 4,000), B) 20-24 Years (Five-Year Total = 5,037), C) 25-29 Years (Five-Year Total = 6,964), D) 30-34 Years (Five-Year Total = 8,905), and E) 35-39 Years (Five-Year Total = 11,435), (CBTRUS 2008-2012).

Distributiona of All Primary Brain and CNS Tumors by Histology, Age 15-39 Years (Five-Year Total = 53,083), (CBTRUS 2008-2012).

Distributiona of All Primary Brain and CNS Tumors by Histology by Age Groups A) 15-19 Years (Five-Year Total = 6,747), B) 20-24 Years (Five-Year Total = 7,765), C) 25-29 Years (Five-Year Total = 10,385), D) 30-34 Years (Five-Year Total = 12,626), and E) 35-39 Years (Five-Year Total = 15,560), (CBTRUS 2008-2012).

Distributiona of Primary Malignant Brain and CNS Tumors by Histology, Age 15-39 Years (Five-Year Total = 16,742), (CBTRUS 2008-2012).

Distributiona of Primary Malignant Brain and CNS Tumors by Histology by Age Groups A) 15-19 Years (Five-Year Total = 2,747), B) 20-24 Years (Five-Year Total = 2,728), C) 25-29 Years (Five-Year Total = 3,421), D) 30-34 Years (Five-Year Total = 3,721), and E) 35-39 Years (Five-Year Total = 4,125), (CBTRUS 2008-2012).

Distributiona of Non-Malignant Primary Brain and CNS Tumors by Histology, Age 15-39 Years (Five-Year Total = 36,341), (CBTRUS 2008-2012).

Distributiona of Non-Malignant Primary Brain and CNS Tumors by Histology and Age Groups A) 15-19 Years (Five-Year Total = 4,000), B) 20-24 Years (Five-Year Total = 5,037), C) 25-29 Years (Five-Year Total = 6,964), D) 30-34 Years (Five-Year Total = 8,905), and E) 35-39 Years (Five-Year Total = 11,435), (CBTRUS 2008-2012).

Distributiona of Gliomas by Site, Age 15-39 Years (Five-Year Total = 15,002), (CBTRUS 2008-2012).

Distributiona of Gliomas by Site and Age Groups A) 15-19 Years (Five-Year Total = 2,327), B) 20-24 Years (Five-Year Total = 2,381), C) 25-29 Years (Five-Year Total = 3,112), D) 30-34 Years (Five-Year Total = 3,454), and E) 35-39 Years (Five-Year Total = 3,728), (CBTRUS 2008-2012).

Distributiona of Gliomas by Histology, Age 15-39 Years (Five-Year Total = 15,002), (CBTRUS 2008-2012).

Distributiona of Gliomas by Histology by Age Groups, A) 15-19 Years (Five-Year Total = 2,327), B) 20-24 Years (Five-Year Total = 2,381), C) 25-29 Years (Five-Year Total = 3,112), D) 30-34 Years (Five-Year Total = 3,454), and E) 35-39 Years (Five-Year Total = 3,728), (CBTRUS 2008-2012).

Incidence Rate Ratios by Gender (Males:Females) in Adolescents and Young Adults Age 15-39 Years for Selected CBTRUS Histology Groupings and Histologies, (CBTRUS 2008-2012).

Incidence Rate Ratios by Race (Whites:Blacks) in Adolescents and Young Adults Age 15-39 Years for Selected CBTRUS Histology Groupings and Histologies, (CBTRUS 2008-2012).

Average Annual Age-Adjusted Mortality Rates of All Malignant Brain and CNS Tumors by Region of the United States (Age 15-39 Years), (NVSS 2008-2012).
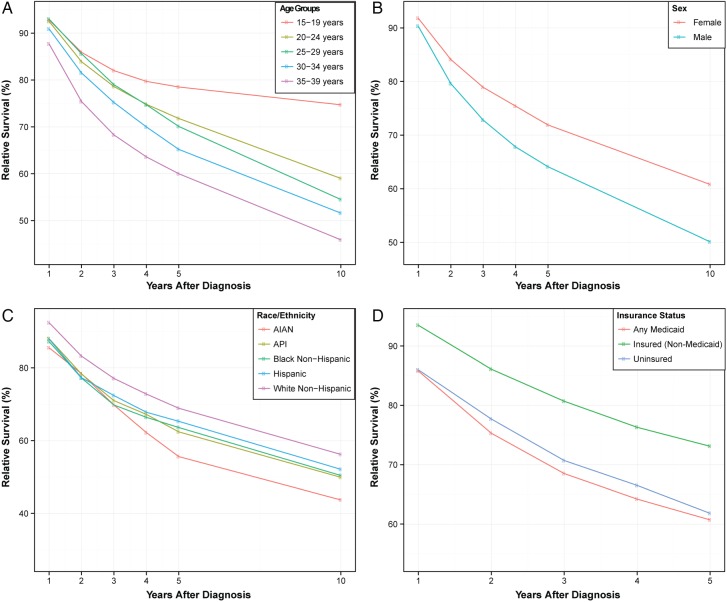
Relative Survival For 1, 2, 3, 4, 5 and 10 Years after Diagnosis with a Glioma in Persons Age 15-39 Years by A) Age Groups, B) Sex, C) Race/Ethnicity, and D) Insurance Status (data available only from 2007-2012), (SEER 1995-2012).

Five-Year Conditional Survival by Age Groups and Histology Groupings (Age 15-39 Years), (SEER 1995-2012).
References
-
- Bleyer A, Barr R, Hayes-Lattin B, et al. The distinctive biology of cancer in adolescents and young adults. Nat. Rev. Cancer. Apr 2008;8(4):288–298. - PubMed
MeSH terms
Grants and funding
LinkOut - more resources
Full Text Sources
Other Literature Sources
Medical
