. 2016 Mar:128:74-84.
doi: 10.1016/j.neuroimage.2015.12.016. Epub 2015 Dec 17.

The influence of contextual reward statistics on risk preference

Affiliations

The influence of contextual reward statistics on risk preference

Francesco Rigoli et al. Neuroimage. 2016 Mar.

Abstract

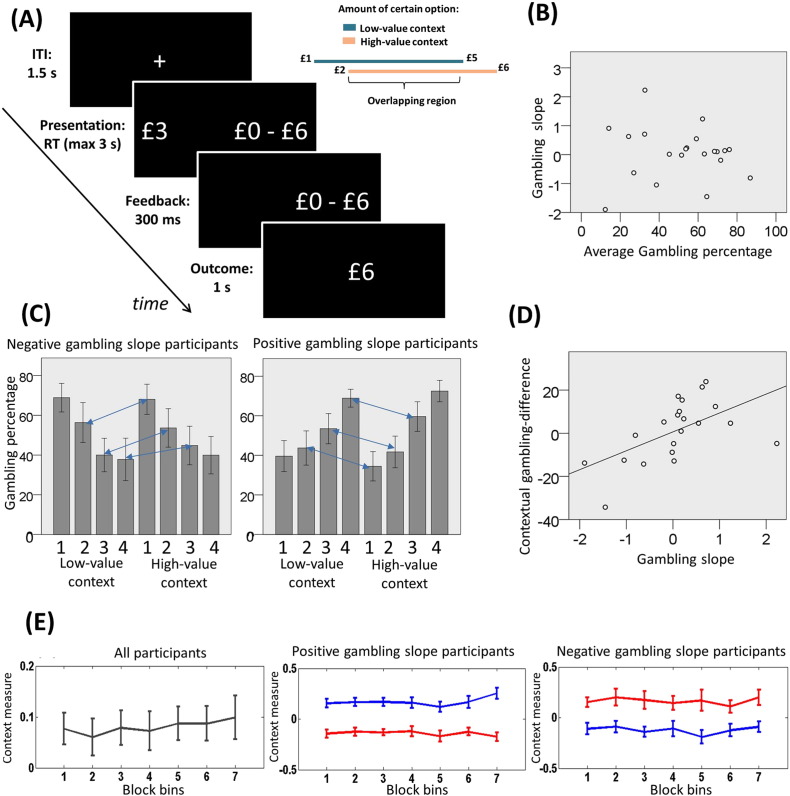
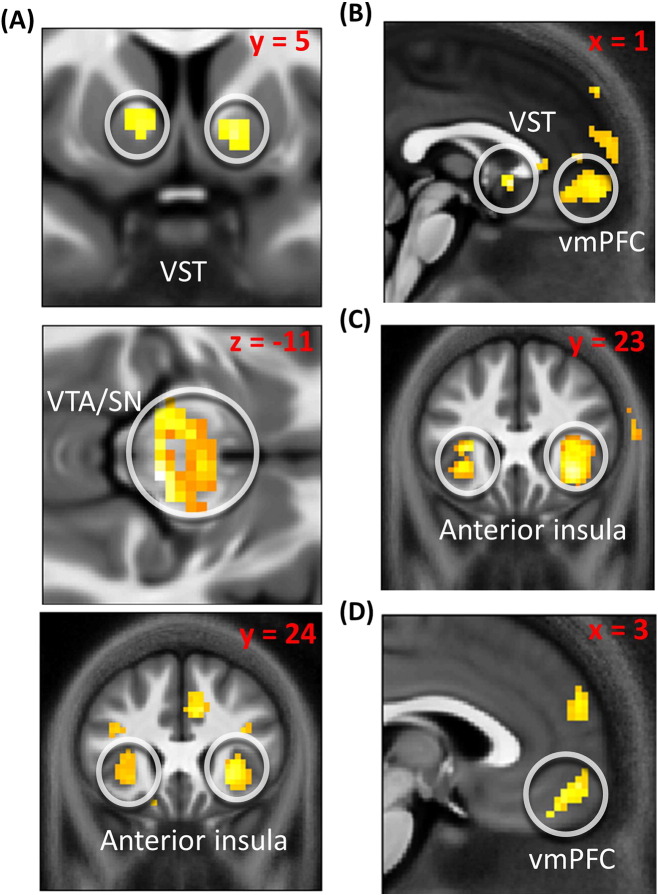
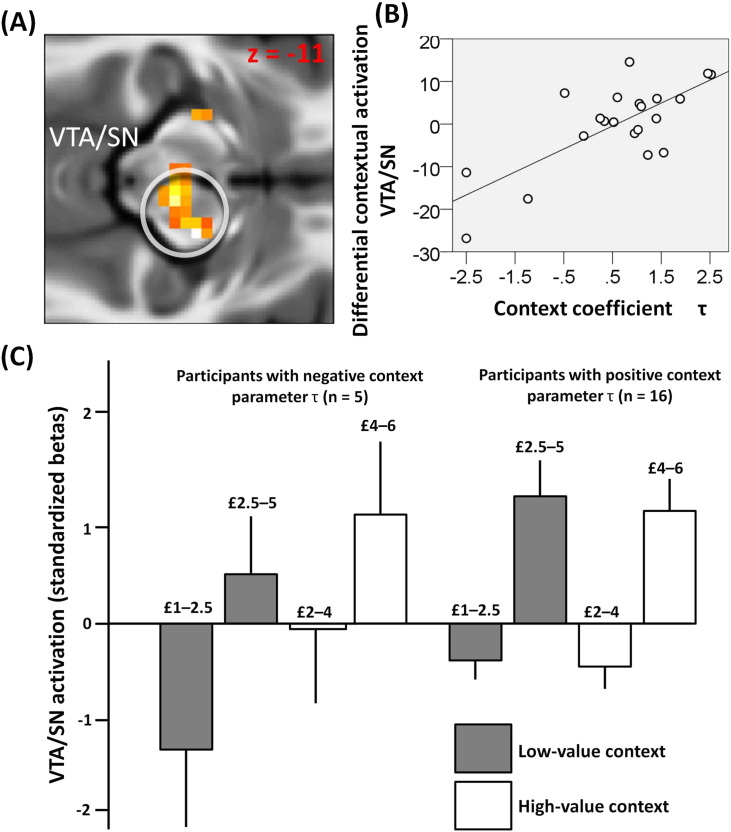
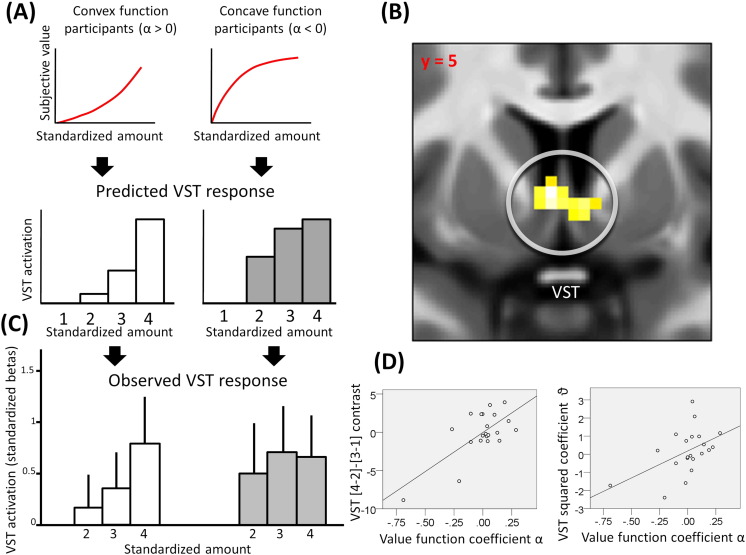
Decision theories mandate that organisms should adjust their behaviour in the light of the contextual reward statistics. We tested this notion using a gambling choice task involving distinct contexts with different reward distributions. The best fitting model of subjects' behaviour indicated that the subjective values of options depended on several factors, including a baseline gambling propensity, a gambling preference dependent on reward amount, and a contextual reward adaptation factor. Combining this behavioural model with simultaneous functional magnetic resonance imaging we probed neural responses in three key regions linked to reward and value, namely ventral tegmental area/substantia nigra (VTA/SN), ventromedial prefrontal cortex (vmPFC) and ventral striatum (VST). We show that activity in the VTA/SN reflected contextual reward statistics to the extent that context affected behaviour, activity in the vmPFC represented a value difference between chosen and unchosen options while VST responses reflected a non-linear mapping between the actual objective rewards and their subjective value. The findings highlight a multifaceted basis for choice behaviour with distinct mappings between components of this behaviour and value sensitive brain regions.


Figures

Fig. 1
Fig. 1
A: Experimental paradigm. Participants repeatedly made choices between certain gains (on the left in the example) and gambles (on the right in the example) associated with a 50% probability of either double the certain gain or zero. After a choice, the unchosen option disappeared and 300 ms later the trial outcome was shown for 1 s. The intertrial interval (ITI) was 1.5 s. At the end of the experiment, a single randomly chosen outcome was paid out to participants. B: Relationship between average gambling percentage (x-axis) and gambling slope (y-axis). This relationship was not significant (r(21) = − 0.06, p = 0.78, non-significant). Note that the gambling slope corresponds to the individual effect (i.e., the slope of a logistic regression parameter) of monetary amount on gambling, thus positive and negative gambling slopes correspond to increased gambling preference with increasing and decreasing amounts, respectively. A distribution of subjects (represented as dots) with positive and negative slopes is evident. C: Gambling percentage for different monetary amounts (grouped in 4 increasing magnitude bins: [1 2 3 4]) for each context (low and high). Participants are split in two groups based on their gambling slope (negative gambling slope: n = 9; positive gambling slope: n = 12). Blue arrows connect equivalent amounts presented in the two contexts. Consistent with a contextual normalization effect, subjects who gambled more with increasing amounts also gambled more when equivalent choices were relatively larger, that is in the low-value context. By contrast, subjects who gambled more with decreasing amounts also gambled more when equivalent choices were relatively smaller, that is in the high-value context. D: Relationship between gambling slope (x-axis) and contextual gambling difference for overlapping amounts (y-axis), corresponding to the gambling percentage in low-value minus high-value context for equal amounts (r(21) = 0.56, p = 0.008). E: Analysis of the evolution of the context effect over time. Blocks are separated into 7 bins. Values labelled as “context measure” represent an index of the context effect (see main text to see how this is obtained). Lines represent average across subjects and error bars represent standard error. The left panel combines all participants and shows that, after bins were aggregated in two sets (without considering the fourth bin), the values of the first three bins were overall not different from the values of the last three bins (t(20) = − 1.02; p = 0.319). Also, the value of the first bin was not significantly different from the value of the last bin (t(20) = − 0.758; p = 0.457) and was significantly larger than zero (t(20) = 2.46, p = 0.023). These data indicate that a context effect emerged from the very start of a new context presentation and remained stable across the duration of the block. On the middle and right panels, lines represent the risk preference for overlapping choices in the two contexts. Red and blue lines are for high- and low-value context, respectively. Participants are separated into two groups depending on whether they have a positive (middle panel) or negative (right panel) gambling slope.
Fig. 2
Fig. 2
A: Brain activation correlating with average subjective value across options in (from top to bottom) VST (right: 9, 11, − 2; Z = 2.68, p = 0.049 SVC; left: -9, 11, − 2; Z = 3.00, p = 0.021 SVC), VTA/SN (right: 6, − 22, − 11; Z = 3.20, p = 0.010 SVC; left: -9, − 19, − 11; Z = 3.26, p = 0.009 SVC) and anterior insula (right: 30, 26, − 2; Z = 3.72, p = 0.007 SVC; left: -30, 29, 1; Z = 3.26, p = 0.025 SVC). B: Brain activation correlating with the value of the chosen option minus the value of the unchosen option in vmPFC (0, 56, − 5; Z = 2.92, p = 0.042 SVC) and right VST (3, 11, − 5; Z = 2.76, p = 0.033 SVC). C: Increased response for gambling choices compared to certain option choices in right anterior insula (33, 23, − 5; Z = 3.02, p = 0.033 SVC; the effect in left insula did not survive correction for multiple comparison). D: Increased response for certain option choices compared to gambling choices in vmPFC (3, 56, − 11; Z = 3.09; p = 0.045 SVC). These results were obtained using a GLM including a regressor at option presentation modulated by the average subjective value across options, the subjective value difference for the chosen minus unchosen option, and a binary variable indicating whether the gamble or the certain option was chosen. These variables were uncorrelated across participants, allowing us to separate their specific impact on brain activity.
Fig. 3
Fig. 3
A: Activation in right VTA/SN showing, at option presentation, a correlation between the context coefficient τ (implementing a context effect by representing a parameter subtracted from the amount of the certain option in the high-value context) and a neural response for the contrast of low-value minus high-value context across all amounts. B: Results from this analysis are plotted for the right VTA/SN peak voxel (15, − 16, − 11; Z = 4.23, p < 0.001 SVC). Note that this graph is solely for the purposes of display; no further statistical analysis is conducted on it. C: VTA/SN activation (beta weights are standardized for each subject computing z-scores using the individual mean and standard deviation) as a function of monetary amount, separately for participants with negative (left, n = 5) and positive (right, n = 16) context parameter τ. Amounts are organized in two bins separately for each context. Activations are displayed for the peak VTA/SN voxel. Note that this graph is solely for the purposes of display; no statistical analysis is conducted on it.
Fig. 4
Fig. 4
A: For convex (on the right, α > 0) and concave (on the left, α < 0) value function participants, predicted VST activation as a function of monetary amount, represented as four bins normalized across contexts. B: VST activation (right: 6, 5, − 2; Z = 3.02, p = 0.025 SVC; left: -3, 5, 1, Z = 3.53, p = 0.005 SVC) for the correlation between the coefficient α, determining the concavity or convexity of the individual subjective value function, and the contrast [4–2]-[3–1]. C: Observed VST activation (beta weights are standardized for each subject computing z-scores using the individual mean and standard deviation; the standardized beta associated with standardized amount = 1 is next subtracted to all other standardized betas) as a function of monetary amount, for concave (α < 0) and convex (α > 0) value function participants (error bars indicate standard errors). Activations are displayed for the peak VST voxel. Concave and convex subjective value functions estimated from behaviour were associated respectively with concave and convex neural responses with increasing amounts. D: On left, relationship between the coefficient α and the contrast [4–2]-[3–1] for the peak VST voxel (− 3, 5, 1, Z = 3.53, p = 0.005 SVC); on right, relationship between the behavioural value function coefficient α and the coefficient ϑ, corresponding to the second-order coefficient of a polynomial function fitted to the peak VST response (standardized betas) with different amounts (r(21) = 0.49, p = 0.023). Note these correlations remain statistically significant when neural data are transformed according to a square root transformation, rendering the analysis less affected by outliers (r = 0.561, p = 0.012 for the analysis correlating the value function coefficient α and the contrast [4–2]-[3–1] in ventral striatum; r = 0.508, p = 0.022 for the analysis correlating the value function coefficient α and the quadratic component of the ventral striatal response). These graphs are solely for the purposes of display; no further statistical analysis has been conducted on them.

Similar articles

Cited by

References

    1. Aminoff E.M., Kveraga K., Bar M. The role of the parahippocampal cortex in cognition. Trends Cogn. Sci. 2013;17(8):379–390. - PMC - PubMed
    1. Bartra O., McGuire J.T., Kable J.W. The valuation system: a coordinate-based meta-analysis of BOLD fMRI experiments examining neural correlates of subjective value. NeuroImage. 2013;76:412–427. - PMC - PubMed
    1. Blair K., Marsh A.A., Morton J., Vythilingam M., Jones M., Mondillo K., Pine D.C., Drevets W.C., Blair J.R. Choosing the lesser of two evils, the better of two goods: specifying the roles of ventromedial prefrontal cortex and dorsal anterior cingulate in object choice. J. Neurosci. 2006;26(44):11379–11386. - PMC - PubMed
    1. Boorman E.D., Behrens T.E., Woolrich M.W., Rushworth M.F. How green is the grass on the other side? Frontopolar cortex and the evidence in favor of alternative courses of action. Neuron. 2009;62(5):733–743. - PubMed
    1. Christopoulos G.I., Tobler P.N., Bossaerts P., Dolan R.J., Schultz W. Neural correlates of value, risk, and risk aversion contributing to decision making under risk. J. Neurosci. 2009;29(40):12574–12583. - PMC - PubMed

Publication types