

Application of small RNA sequencing to identify microRNAs in acute kidney injury and fibrosis
- PMID: 26707937
- PMCID: PMC4912473
- DOI: 10.1016/j.taap.2015.12.002
Application of small RNA sequencing to identify microRNAs in acute kidney injury and fibrosis
Abstract
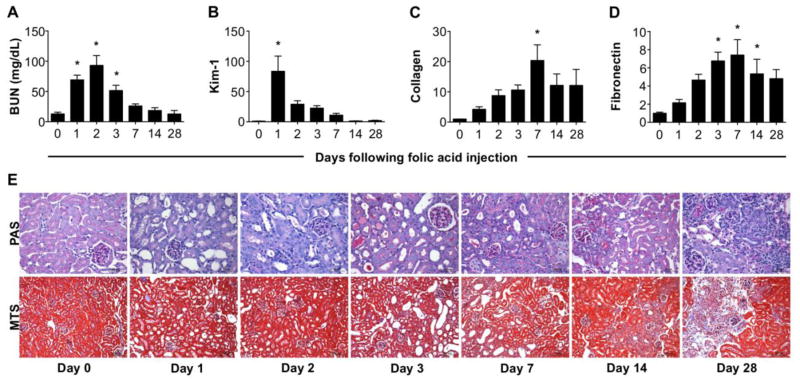
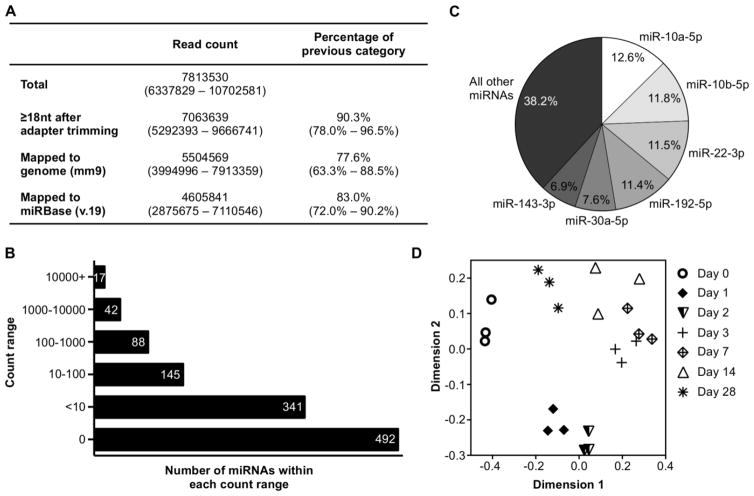
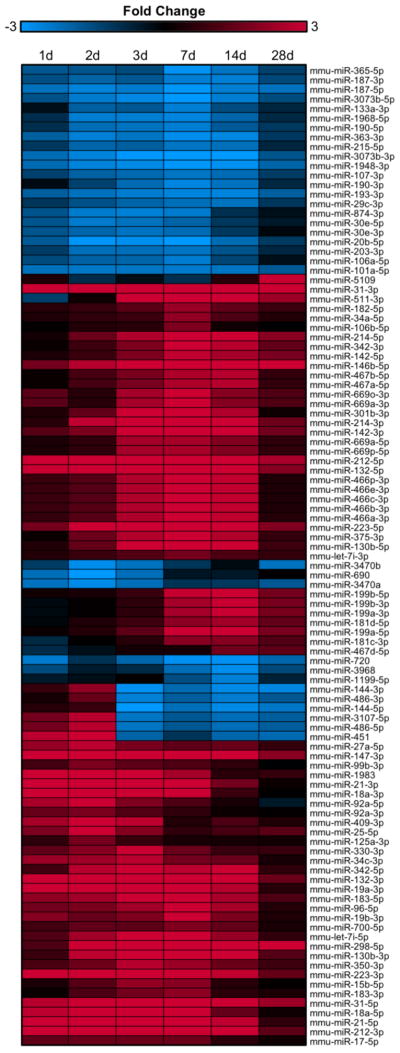
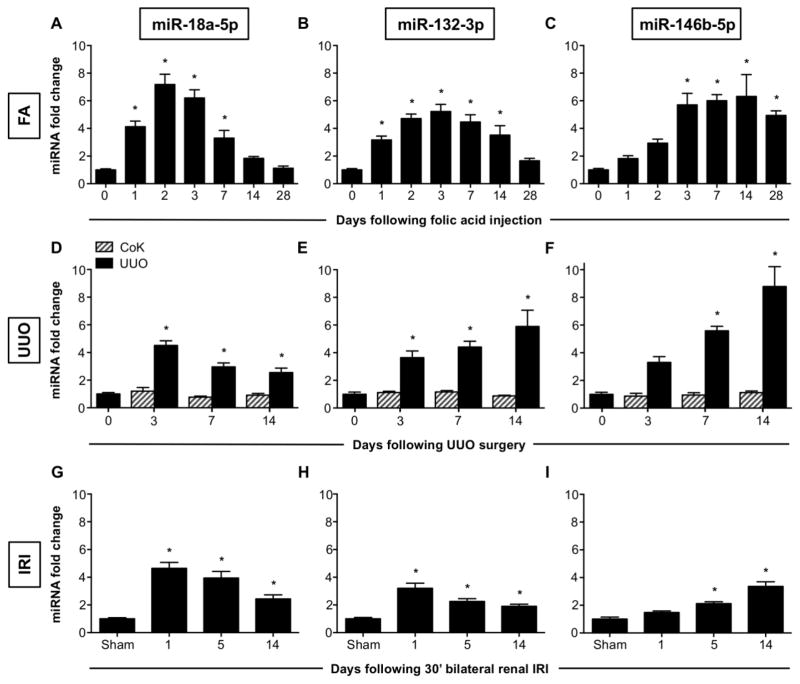
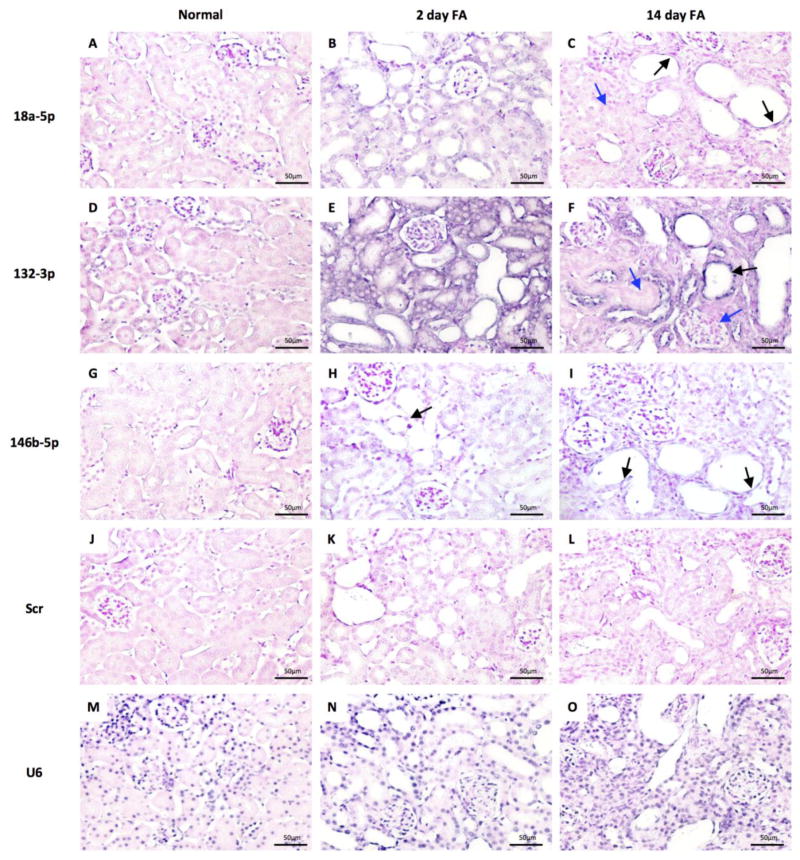
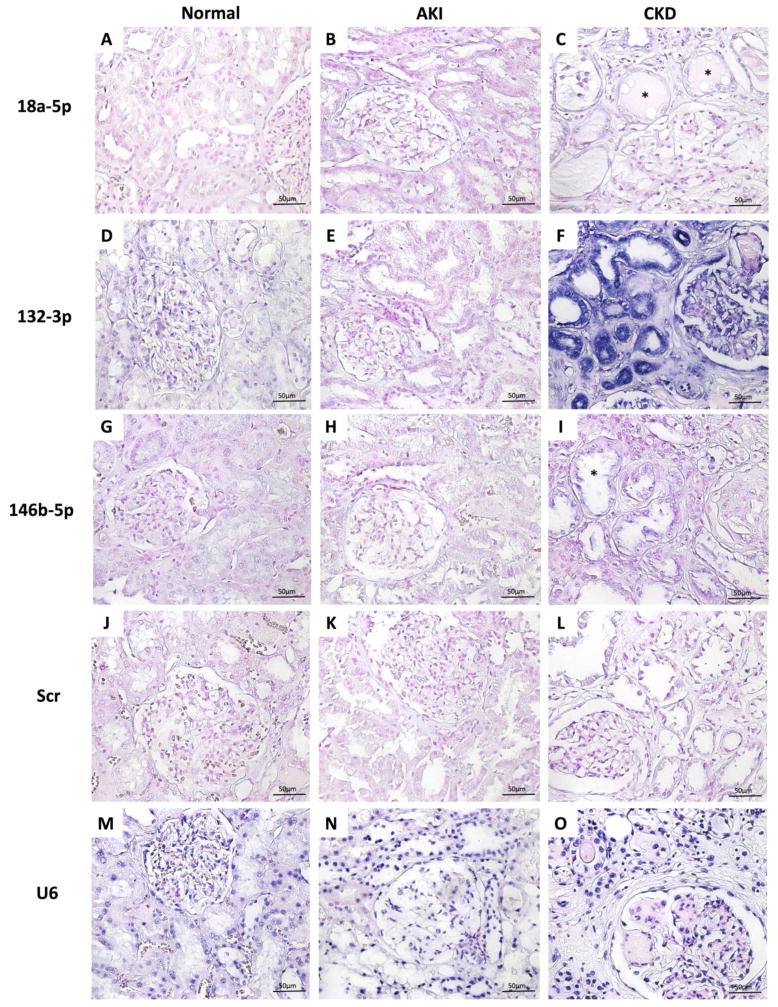
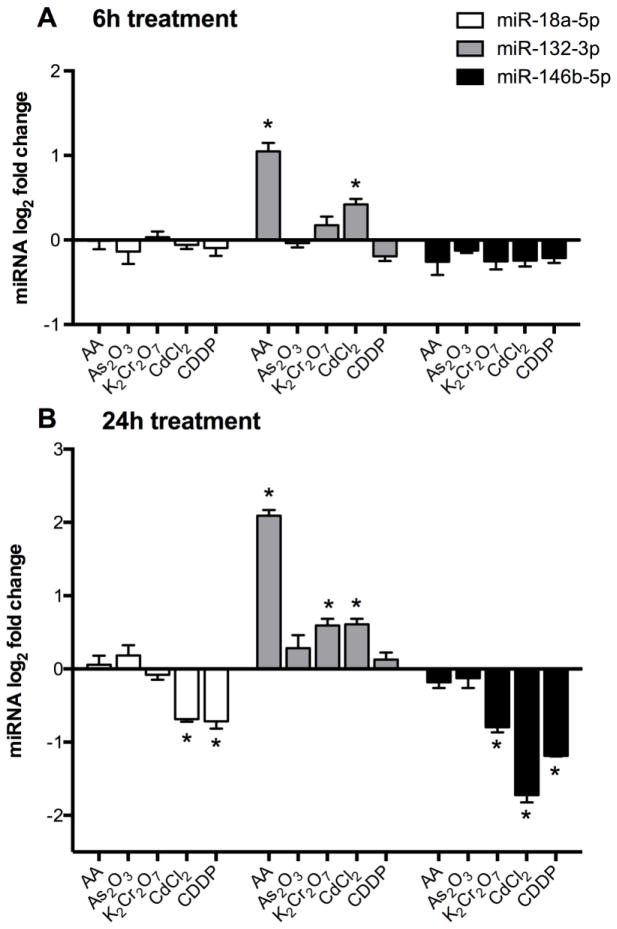
Establishing a microRNA (miRNA) expression profile in affected tissues provides an important foundation for the discovery of miRNAs involved in the development or progression of pathologic conditions. We conducted small RNA sequencing to generate a temporal profile of miRNA expression in the kidneys using a mouse model of folic acid-induced (250mg/kgi.p.) kidney injury and fibrosis. From the 103 miRNAs that were differentially expressed over the time course (>2-fold, p<0.05), we chose to further investigate miR-18a-5p, which is expressed during the acute stage of the injury; miR-132-3p, which is upregulated during transition between acute and fibrotic injury; and miR-146b-5p, which is highly expressed at the peak of fibrosis. Using qRT-PCR, we confirmed the increased expression of these candidate miRNAs in the folic acid model as well as in other established mouse models of acute injury (ischemia/reperfusion injury) and fibrosis (unilateral ureteral obstruction). In situ hybridization confirmed high expression of miR-18a-5p, miR-132-3p and miR-146b-5p throughout the kidney cortex in mice and humans with severe kidney injury or fibrosis. When primary human proximal tubular epithelial cells were treated with model nephrotoxicants such as cadmium chloride (CdCl2), arsenic trioxide, aristolochic acid (AA), potassium dichromate (K2Cr2O7) and cisplatin, miRNA-132-3p was upregulated 4.3-fold after AA treatment and 1.5-fold after K2Cr2O7 and CdCl2 treatment. These results demonstrate the application of temporal small RNA sequencing to identify miR-18a, miR-132 and miR-146b as differentially expressed miRNAs during distinct phases of kidney injury and fibrosis progression.
Keywords: Folic Acid; Kidney Fibrosis; Kidney Toxicity; Small RNA Sequencing; miRNAs.
Copyright © 2015 Elsevier Inc. All rights reserved.
Conflict of interest statement
The authors have no competing interests to declare.
Figures
Similar articles
-
Intrarenal microRNA signature related to the fibrosis process in chronic kidney disease: identification and functional validation of key miRNAs.BMC Nephrol. 2019 Aug 27;20(1):336. doi: 10.1186/s12882-019-1512-x. BMC Nephrol. 2019. PMID: 31455266 Free PMC article.
-
Urinary MicroRNA-30c-5p and MicroRNA-192-5p as potential biomarkers of ischemia-reperfusion-induced kidney injury.Exp Biol Med (Maywood). 2017 Mar;242(6):657-667. doi: 10.1177/1535370216685005. Epub 2017 Jan 5. Exp Biol Med (Maywood). 2017. PMID: 28056546 Free PMC article.
-
Integrated analysis of microRNA and mRNA expression profiles in the left atrium of patients with nonvalvular paroxysmal atrial fibrillation: Role of miR-146b-5p in atrial fibrosis.Heart Rhythm. 2015 May;12(5):1018-26. doi: 10.1016/j.hrthm.2015.01.026. Epub 2015 Jan 21. Heart Rhythm. 2015. PMID: 25617731
-
Research progress on miR-124-3p in the field of kidney disease.BMC Nephrol. 2024 Aug 7;25(1):252. doi: 10.1186/s12882-024-03688-7. BMC Nephrol. 2024. PMID: 39112935 Free PMC article. Review.
-
MicroRNAs in acute kidney injury.Hum Genomics. 2016 Sep 8;10(1):29. doi: 10.1186/s40246-016-0085-z. Hum Genomics. 2016. PMID: 27608623 Free PMC article. Review.
Cited by
-
Multi omics analysis of fibrotic kidneys in two mouse models.Sci Data. 2019 Jun 14;6(1):92. doi: 10.1038/s41597-019-0095-5. Sci Data. 2019. PMID: 31201317 Free PMC article.
-
Liquid Biopsies Poorly miRror Renal Ischemia-Reperfusion Injury.Noncoding RNA. 2023 Apr 1;9(2):24. doi: 10.3390/ncrna9020024. Noncoding RNA. 2023. PMID: 37104006 Free PMC article.
-
Differential Expression of Urinary Exosomal Small RNAs in Idiopathic Membranous Nephropathy.Biomed Res Int. 2020 Dec 29;2020:3170927. doi: 10.1155/2020/3170927. eCollection 2020. Biomed Res Int. 2020. PMID: 33457405 Free PMC article.
-
Delayed Contralateral Nephrectomy Halted Post-Ischemic Renal Fibrosis Progression and Inhibited the Ischemia-Induced Fibromir Upregulation in Mice.Biomedicines. 2021 Jul 14;9(7):815. doi: 10.3390/biomedicines9070815. Biomedicines. 2021. PMID: 34356879 Free PMC article.
-
Understanding Cisplatin Pharmacokinetics and Toxicodynamics to Predict and Prevent Kidney Injury.J Pharmacol Exp Ther. 2024 Nov 19;391(3):399-414. doi: 10.1124/jpet.124.002287. J Pharmacol Exp Ther. 2024. PMID: 39322416 Review.
References
-
- Andersen CL, Jensen JL, Orntoft TF. Normalization of real-time quantitative reverse transcription-PCR data: a model-based variance estimation approach to identify genes suited for normalization, applied to bladder and colon cancer data sets. Cancer Res. 2004;64:5245–5250. - PubMed
MeSH terms
Substances
Grants and funding
LinkOut - more resources
Full Text Sources
Other Literature Sources
Molecular Biology Databases
