

KRAS Genotype Correlates with Proteasome Inhibitor Ixazomib Activity in Preclinical In Vivo Models of Colon and Non-Small Cell Lung Cancer: Potential Role of Tumor Metabolism
- PMID: 26709701
- PMCID: PMC4692403
- DOI: 10.1371/journal.pone.0144825
KRAS Genotype Correlates with Proteasome Inhibitor Ixazomib Activity in Preclinical In Vivo Models of Colon and Non-Small Cell Lung Cancer: Potential Role of Tumor Metabolism
Abstract
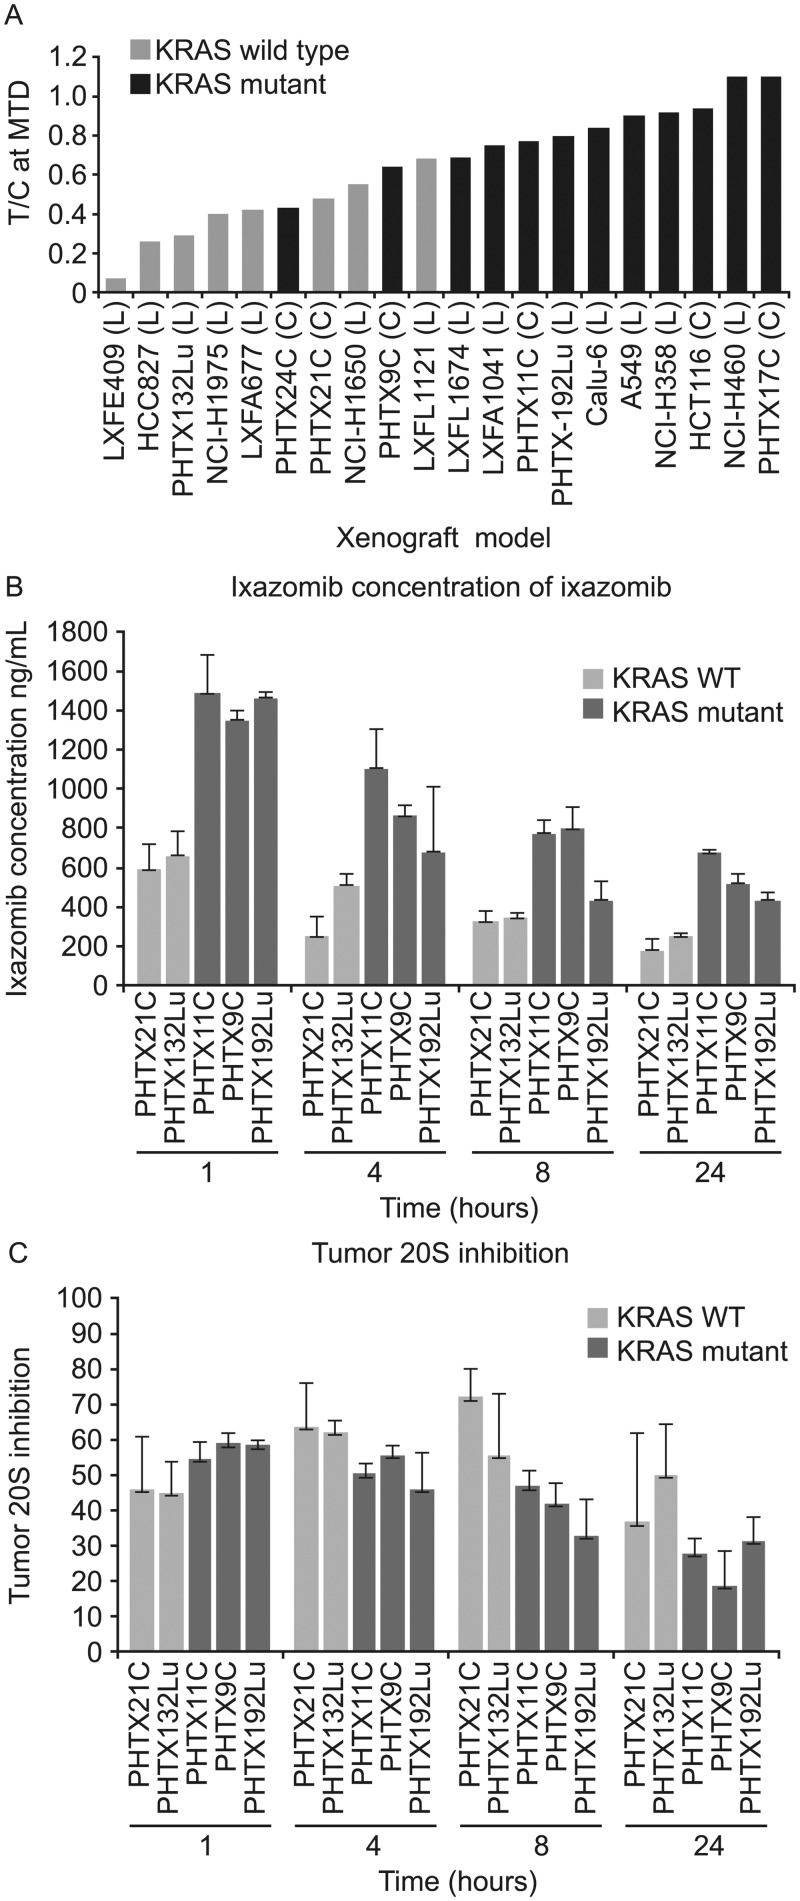
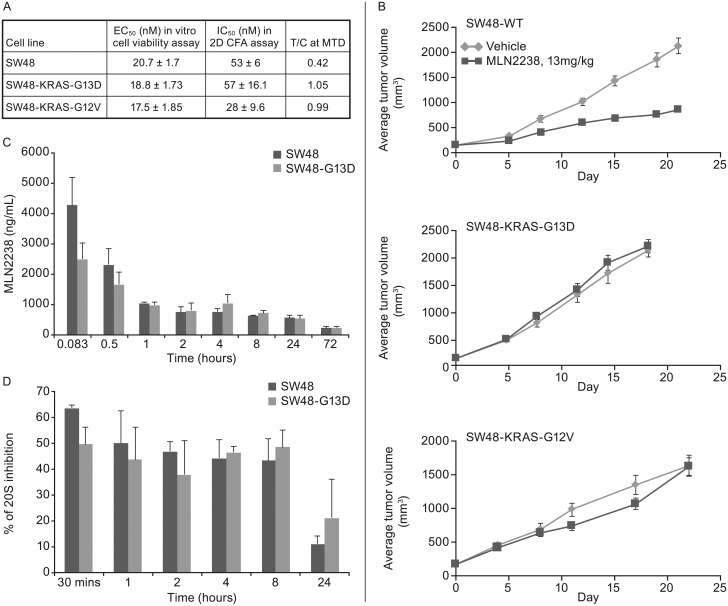
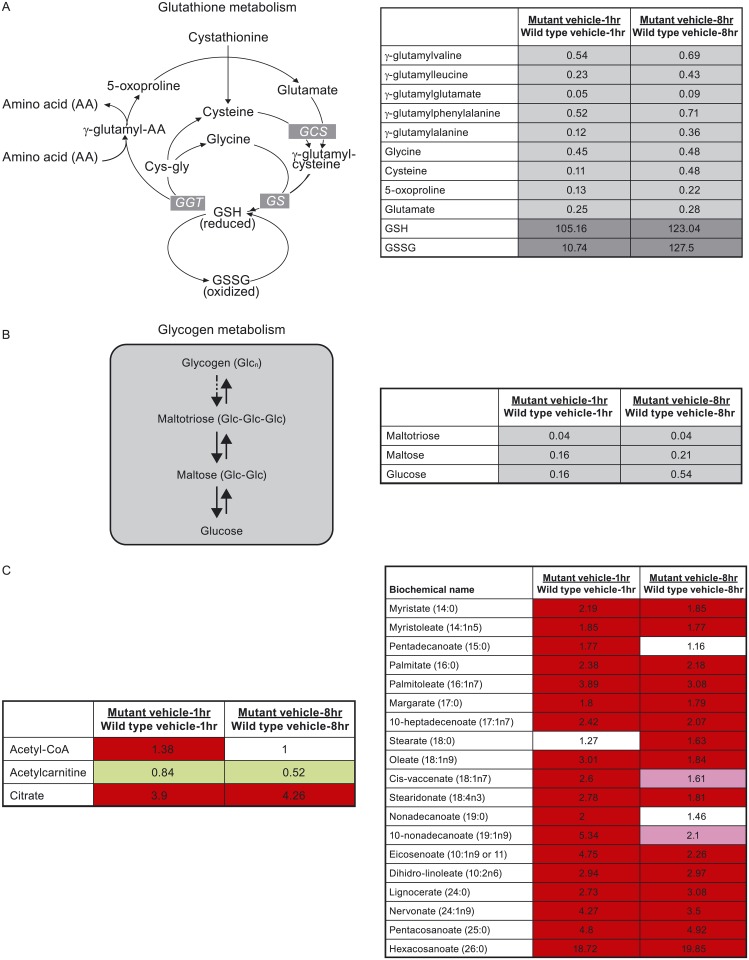
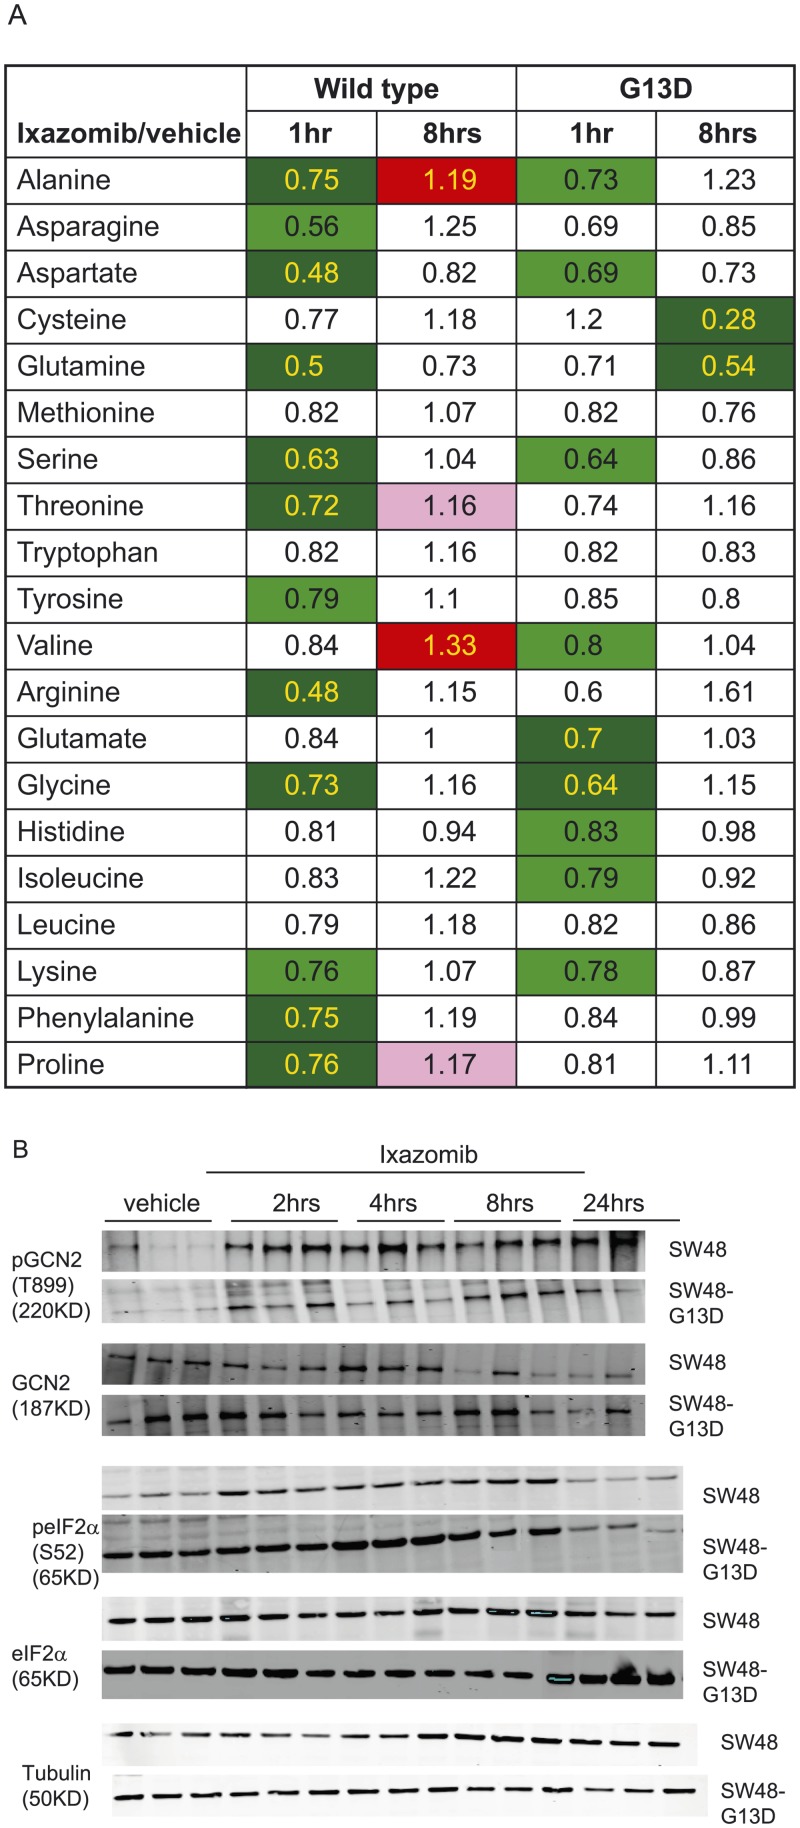
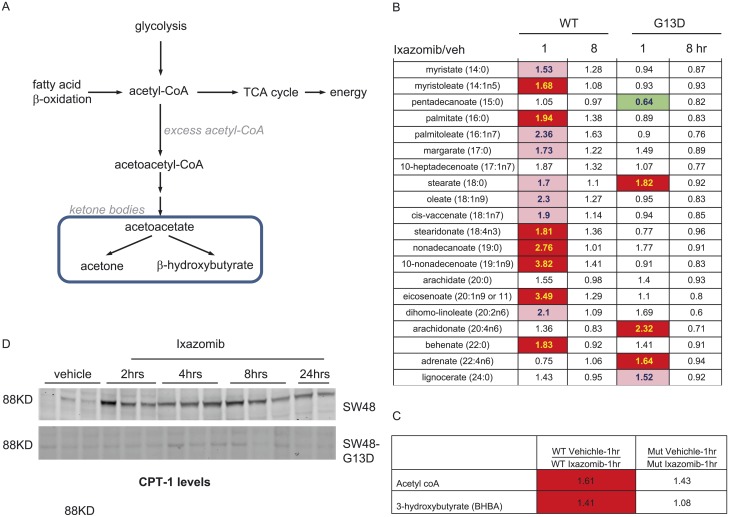
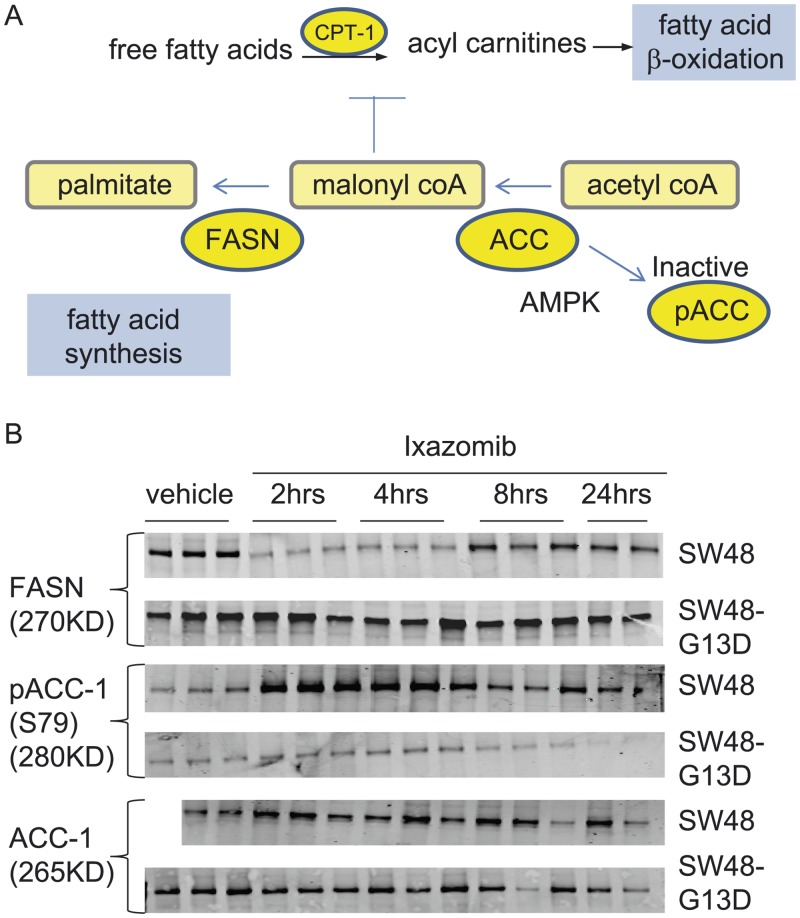
In non-clinical studies, the proteasome inhibitor ixazomib inhibits cell growth in a broad panel of solid tumor cell lines in vitro. In contrast, antitumor activity in xenograft tumors is model-dependent, with some solid tumors showing no response to ixazomib. In this study we examined factors responsible for ixazomib sensitivity or resistance using mouse xenograft models. A survey of 14 non-small cell lung cancer (NSCLC) and 6 colon xenografts showed a striking relationship between ixazomib activity and KRAS genotype; tumors with wild-type (WT) KRAS were more sensitive to ixazomib than tumors harboring KRAS activating mutations. To confirm the association between KRAS genotype and ixazomib sensitivity, we used SW48 isogenic colon cancer cell lines. Either KRAS-G13D or KRAS-G12V mutations were introduced into KRAS-WT SW48 cells to generate cells that stably express activated KRAS. SW48 KRAS WT tumors, but neither SW48-KRAS-G13D tumors nor SW48-KRAS-G12V tumors, were sensitive to ixazomib in vivo. Since activated KRAS is known to be associated with metabolic reprogramming, we compared metabolite profiling of SW48-WT and SW48-KRAS-G13D tumors treated with or without ixazomib. Prior to treatment there were significant metabolic differences between SW48 WT and SW48-KRAS-G13D tumors, reflecting higher oxidative stress and glucose utilization in the KRAS-G13D tumors. Ixazomib treatment resulted in significant metabolic regulation, and some of these changes were specific to KRAS WT tumors. Depletion of free amino acid pools and activation of GCN2-eIF2α-pathways were observed both in tumor types. However, changes in lipid beta oxidation were observed in only the KRAS WT tumors. The non-clinical data presented here show a correlation between KRAS genotype and ixazomib sensitivity in NSCLC and colon xenografts and provide new evidence of regulation of key metabolic pathways by proteasome inhibition.
Conflict of interest statement
Figures
Similar articles
-
KRAS-mutation status dependent effect of zoledronic acid in human non-small cell cancer preclinical models.Oncotarget. 2016 Nov 29;7(48):79503-79514. doi: 10.18632/oncotarget.12806. Oncotarget. 2016. PMID: 27780929 Free PMC article.
-
KRAS exon 2 mutations influence activity of regorafenib in an SW48-based disease model of colorectal cancer.Future Oncol. 2015;11(13):1919-29. doi: 10.2217/fon.15.97. Future Oncol. 2015. PMID: 26161928
-
Higher metastatic efficiency of KRas G12V than KRas G13D in a colorectal cancer model.FASEB J. 2015 Feb;29(2):464-76. doi: 10.1096/fj.14-262303. Epub 2014 Oct 30. FASEB J. 2015. PMID: 25359494
-
The investigational proteasome inhibitor ixazomib for the treatment of multiple myeloma.Future Oncol. 2015;11(8):1153-68. doi: 10.2217/fon.15.9. Future Oncol. 2015. PMID: 25832873 Review.
-
Ixazomib in the management of relapsed multiple myeloma.Future Oncol. 2018 Aug;14(20):2013-2020. doi: 10.2217/fon-2017-0710. Epub 2018 Feb 22. Future Oncol. 2018. PMID: 29469592 Review.
Cited by
-
Complete pathological response of hormone receptor positive invasive breast cancer in a patient with multiple myeloma treated with ixazomib.Tumori. 2023 Dec;109(6):NP14-NP20. doi: 10.1177/03008916231176586. Epub 2023 Jun 2. Tumori. 2023. PMID: 37265183 Free PMC article.
-
Mutant KRAS promotes liver metastasis of colorectal cancer, in part, by upregulating the MEK-Sp1-DNMT1-miR-137-YB-1-IGF-IR signaling pathway.Oncogene. 2018 Jun;37(25):3440-3455. doi: 10.1038/s41388-018-0222-3. Epub 2018 Mar 21. Oncogene. 2018. PMID: 29559746
-
Positioning of proteasome inhibitors in therapy of solid malignancies.Cancer Chemother Pharmacol. 2018 Feb;81(2):227-243. doi: 10.1007/s00280-017-3489-0. Epub 2017 Nov 28. Cancer Chemother Pharmacol. 2018. PMID: 29184971 Free PMC article. Review.
-
Expression of HIF-1α and P-gp in non-small cell lung cancer and the relationship with HPV infection.Oncol Lett. 2016 Aug;12(2):1455-1459. doi: 10.3892/ol.2016.4751. Epub 2016 Jun 17. Oncol Lett. 2016. PMID: 27446452 Free PMC article.
-
Drug repositioning for esophageal squamous cell carcinoma.Front Genet. 2022 Sep 28;13:991842. doi: 10.3389/fgene.2022.991842. eCollection 2022. Front Genet. 2022. PMID: 36246638 Free PMC article.
References
-
- Adams J. Proteasome inhibitors as new anticancer drugs. Curr Opin Oncol. 2002;14(6):628–34. - PubMed
-
- Ciechanover A. The ubiquitin-proteasome proteolytic pathway. Cell. 1994;79(1):13–21. - PubMed
-
- Adams J. Potential for proteasome inhibition in the treatment of cancer. Drug Discov Today. 2003;8(7):307–15. - PubMed
Publication types
MeSH terms
Substances
LinkOut - more resources
Full Text Sources
Other Literature Sources
Medical
Molecular Biology Databases
Miscellaneous
