. 2015 Dec 28:4:e12362.
doi: 10.7554/eLife.12362.

Observation of long-range tertiary interactions during ligand binding by the TPP riboswitch aptamer

Affiliations

Observation of long-range tertiary interactions during ligand binding by the TPP riboswitch aptamer

Van K Duesterberg et al. Elife. .

Abstract

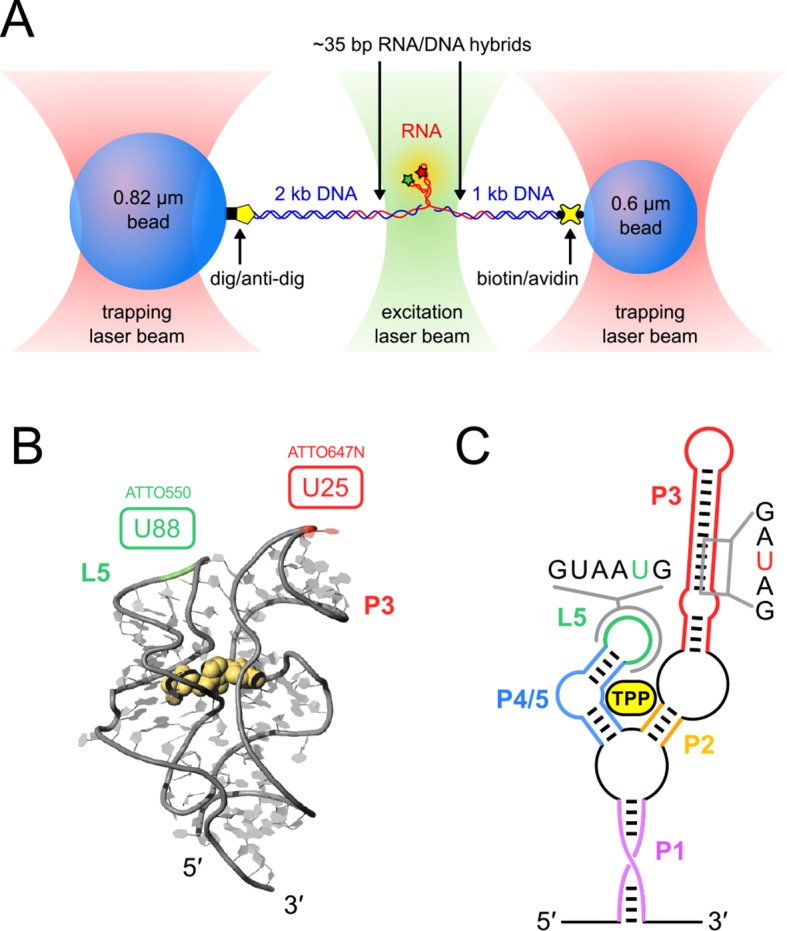
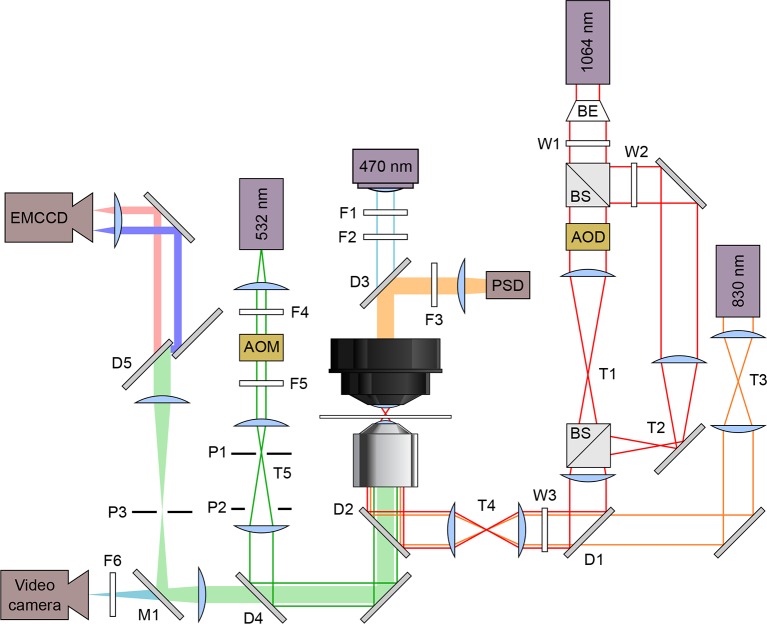
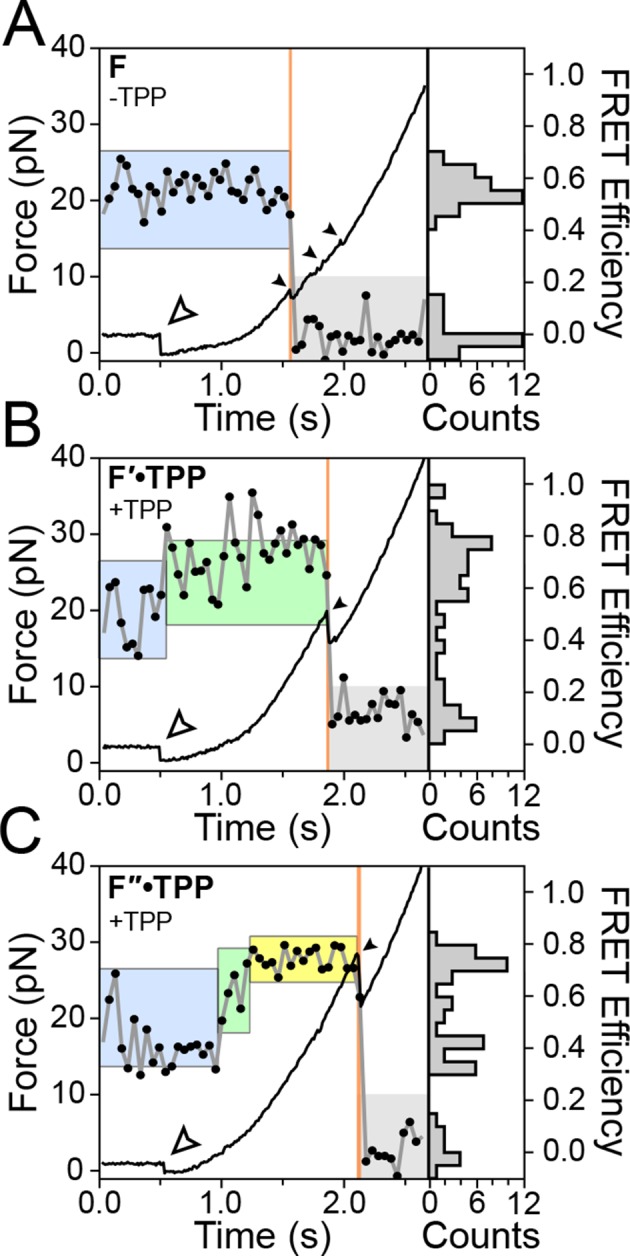
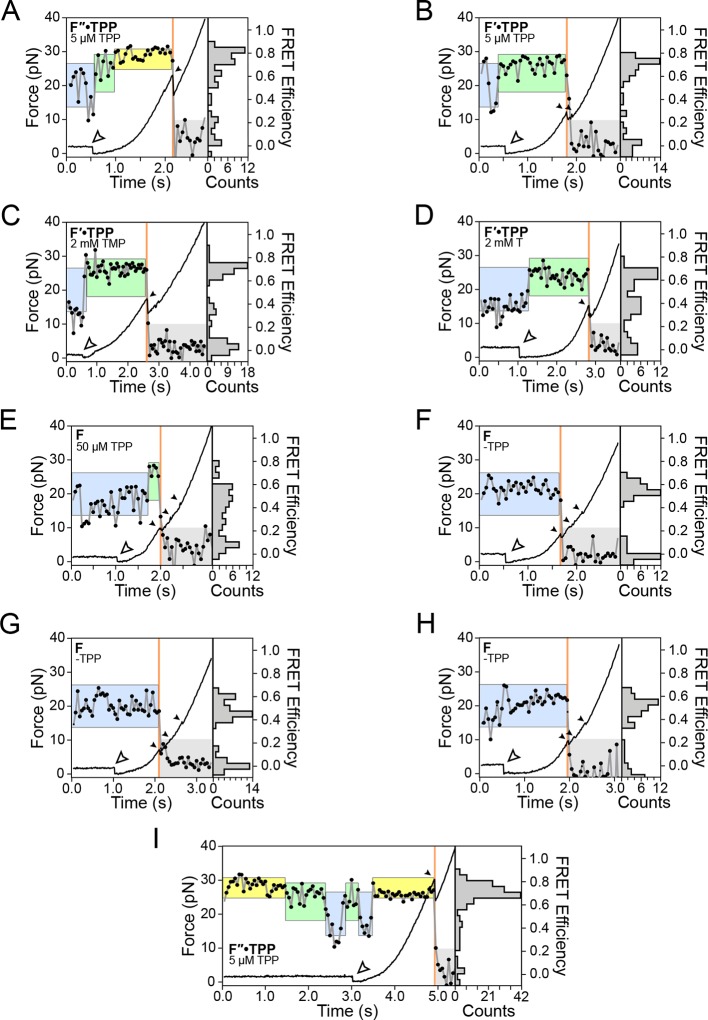
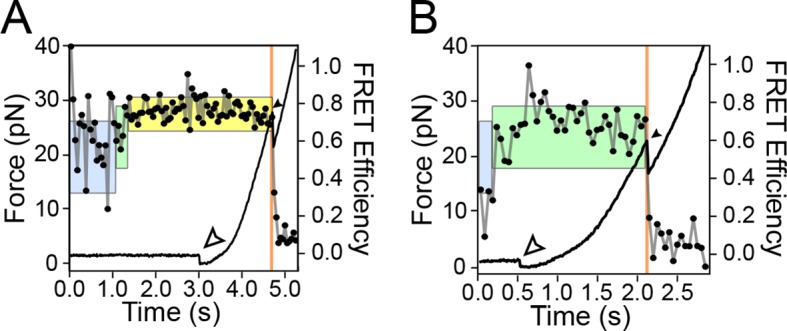
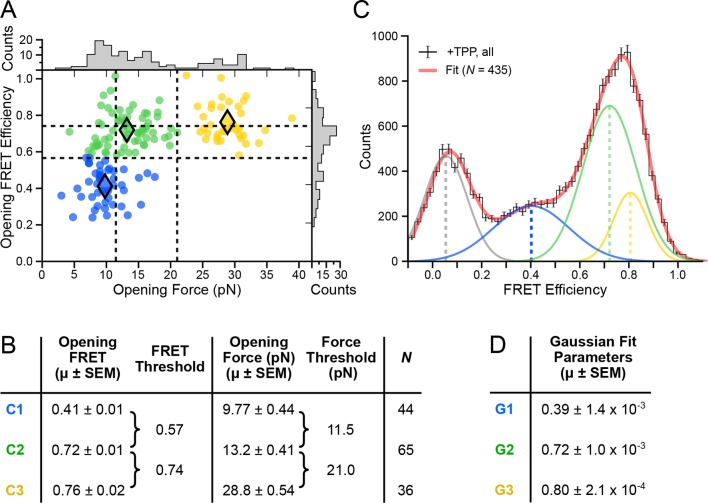
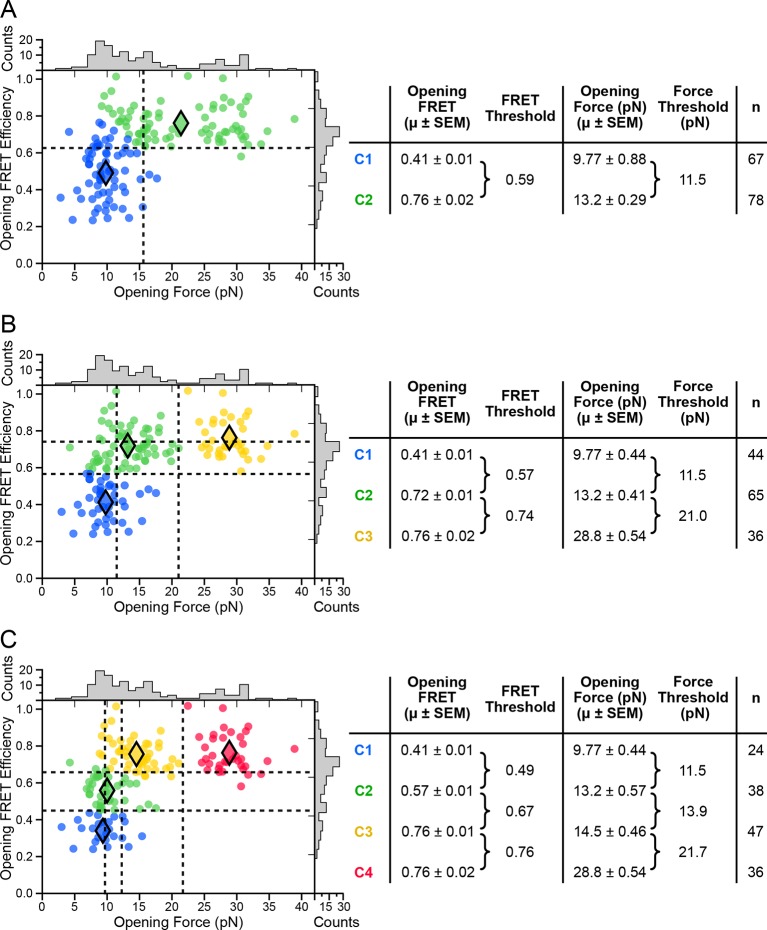
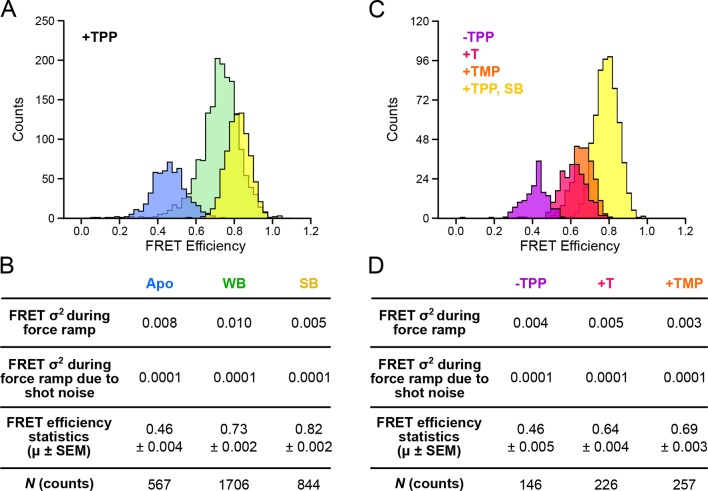
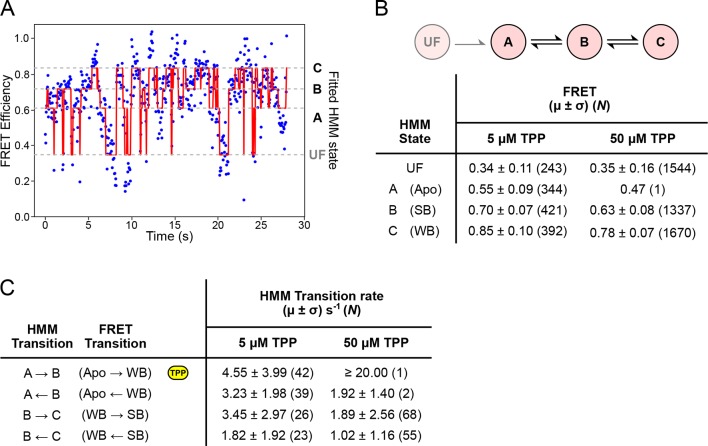
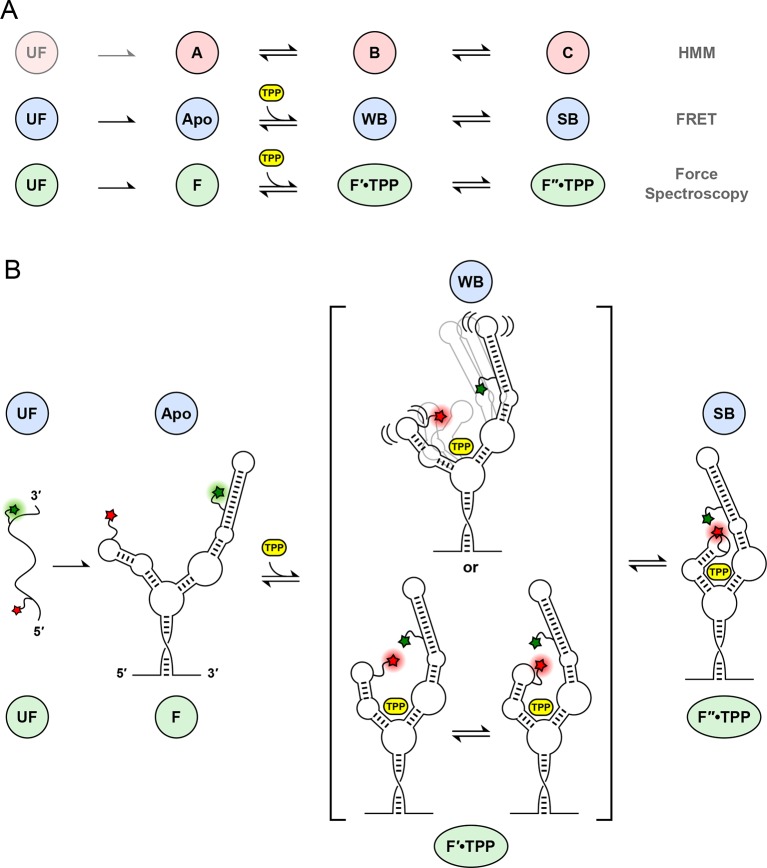
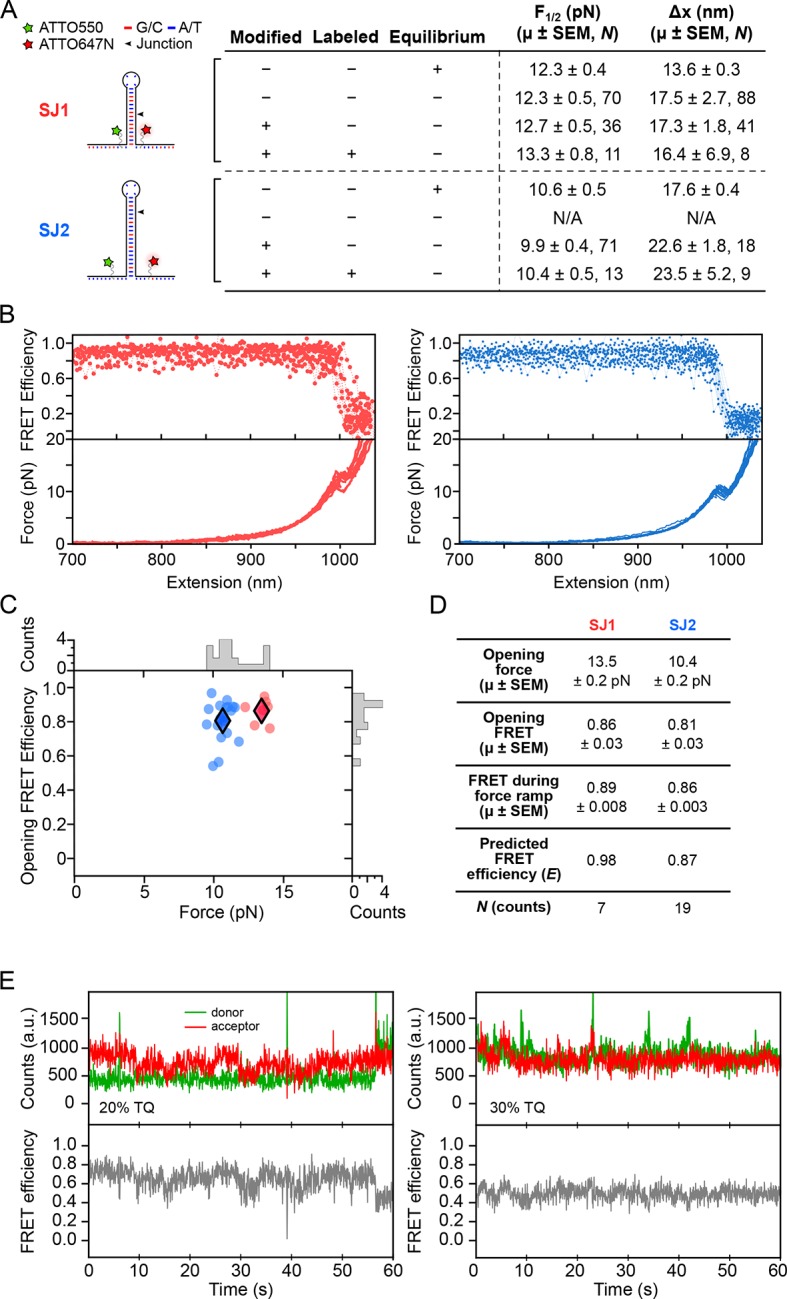
The thiamine pyrophosphate (TPP) riboswitch is a cis-regulatory element in mRNA that modifies gene expression in response to TPP concentration. Its specificity is dependent upon conformational changes that take place within its aptamer domain. Here, the role of tertiary interactions in ligand binding was studied at the single-molecule level by combined force spectroscopy and Förster resonance energy transfer (smFRET), using an optical trap equipped for simultaneous smFRET. The 'Force-FRET' approach directly probes secondary and tertiary structural changes during folding, including events associated with binding. Concurrent transitions observed in smFRET signals and RNA extension revealed differences in helix-arm orientation between two previously-identified ligand-binding states that had been undetectable by spectroscopy alone. Our results show that the weaker binding state is able to bind to TPP, but is unable to form a tertiary docking interaction that completes the binding process. Long-range tertiary interactions stabilize global riboswitch structure and confer increased ligand specificity.

Keywords: A. thaliana; TPP; biophysics; optical trap; riboswitch; single molecule biophysics; smFRET; structural biology.


Conflict of interest statement

The authors declare that no competing interests exist.

Figures

Figure 1.
Figure 1.. Single-molecule assay, crystal structure and schematic of the TPP aptamer.
(A) Experimental geometry of the dumbbell optical-trapping assay with simultaneous FRET monitoring, with key components labeled (not to scale). (B) Crystal structure of the truncated TPP riboswitch aptamer with a shortened P3 stem (PDB entry 3D2G). Dye-labeling sites for ATTO550 and ATTO647N are indicated, at nucleotides G88 (green) and U25 (red), respectively. (C) Secondary structure of the TPP riboswitch, with structural components indicated in color. Sequences surrounding the amino-modified uracil bases in the sensor helix arms (5-N-U and 5-LC-N-U; Integrated DNA Technologies, Coralville, IA) are shown, with the modified bases colored (P3, red; L5, green). DOI: http://dx.doi.org/10.7554/eLife.12362.003
Figure 2.
Figure 2.. Schematic optical layout of the dual-beam optical trap and FRET.
Solid lines indicate lasers and light sources: 830 nm detection laser (orange), 1,064 nm trapping laser (red), 532 nm excitation laser (green), and 470 nm illuminating LED (blue). Filled bars are emissions received by these detectors: position sensitive detector (PSD), electron multiplying charge coupled device (EMCCD) camera, and a video camera. Lasers are maneuvered and modified in intensity using acousto-optic deflectors (AOD) and acousto-optic modulators (AOM), respectively. The dual beam trapping laser is expanded using a beam expander (BE) and split with a beam splitter. The excitation laser emission goes through a dichroic mirror (D5, T640LP; Chroma, Brattleboro, VT) to split the acceptor and donor emissions. Filters (F), Wollaston prisms (W), pinholes (P), dichroic mirrors (D), mirrors (M), and telescopes (T) are labeled. DOI: http://dx.doi.org/10.7554/eLife.12362.004
Figure 3.
Figure 3.. Representative FEC and FRET traces.
Representative traces of unfolding for the aptamer conformations (A) F, (B) F′•TPP, and (C) F″•TPP. Simultaneous force-extension curves (FECs; black lines) and FRET trajectories (black circles, gray lines) are parametrized by time. Colored boxes indicate the APO (blue), WB (green), and SB (yellow) FRET states. Open arrowheads mark the end of the refolding period and the start of the force ramp. Small, filled arrowheads mark the location of opening transitions. DOI: http://dx.doi.org/10.7554/eLife.12362.005
Figure 3—figure supplement 1.
Figure 3—figure supplement 1.. Representative traces of various secondary state conformations and TPP concentrations.
Force curves (black lines) and FRET trajectories (black circles, gray lines) are shown parametrized by time for the following aptamer conformations: (A) F″•TPP in the presence of 5 μM TPP, (B) F′•TPP in the presence of 5 μM TPP, (C) F′•TPP in the presence of 2 mM TMP, (D) F′•TPP in the presence of 2 mM T, (E) F in the presence of 50 μM TPP, (F-H) in the absence of TPP (panel (E) is the same as Figure 3, panel A), (I) F″•TPP in the presence of 5 μM TPP. Here, we observe loss and rebinding of ligand. DOI: http://dx.doi.org/10.7554/eLife.12362.006
Figure 3—figure supplement 2.
Figure 3—figure supplement 2.. FRET changes occur throughout the refolding period and the force ramp, up until the first rip.
Representative traces show FRET signatures indicative of a particular helix arm configuration at the end of a refolding period that is maintained throughout the force ramp. Colored boxes, lines, open and filled arrowheads are as described in Figure 3. (A) The aptamer transitions from an unbound configuration to a weakly bound configuration, and then to a strongly bound configuration, which is held up until the catastrophic rip. (B) The aptamer transitions from an unbound configuration to a weakly bound configuration prior to the end of the refolding period, and remains in the weakly bound configuration until the catastrophic rip. DOI: http://dx.doi.org/10.7554/eLife.12362.007
Figure 4.
Figure 4.. Clustering analysis of opening FRET values, and global analysis of full-length FRET traces.
(A) k-means clustering for opening FRET and opening force values. Filled diamonds mark the mean opening force and opening FRET values for each of the k = 3 populations; dashed vertical and horizontal lines indicate the thresholds for force and FRET states, respectively. (B) Table summarizing opening force and FRET centroids, and thresholds for the clusters C1, C2 and C3. (C) Global fit (red) of all data (black histogram, with error bars) to a sum of four Gaussians. Individual Gaussian fits are shown as colored lines, with the mean values indicated (vertical dashed lines). (D) Table of fit parameters for G1, G2 and G3 (N = 435). DOI: http://dx.doi.org/10.7554/eLife.12362.008
Figure 4—figure supplement 1.
Figure 4—figure supplement 1.. k-means cluster analysis of opening force and FRET.
k-means clustering results and summary tables shown for (A) k = 2, (B) k = 3, and (C) k = 4. DOI: http://dx.doi.org/10.7554/eLife.12362.009
Figure 5.
Figure 5.. Distributions of segmented FRET data in the presence and absence of TPP and its analogs.
(A) Segmented FRET data in the presence of saturating TPP (2 mM). After segmenting, FRET records were categorized into APO (blue), WB (green), and SB (yellow) FRET states. (B) Table summarizing FRET efficiency statistics. (C) FRET data from aptamers in the absence of TPP (purple), and in the presence of saturating (2 mM) T (pink) and TMP (orange), displayed together with data for the SB state in the presence of TPP (yellow) for comparison. (D) Table summarizing FRET efficiency statistics for the TPP, T, and TMP conditions indicated. DOI: http://dx.doi.org/10.7554/eLife.12362.010
Figure 6.
Figure 6.. HMM modeling of refolding FRET trajectories.
(A) Four-state HMM fit to a 30-second portion of concatenated refolding FRET trajectories in the presence of 5 µM TPP. (B) Top: Reaction diagram for the four-state, sequential HMM model, with states UF and A (donor-fluorescing), and B and C (acceptor-fluorescing). Bottom: table summarizing FRET values obtained 5 µM and 50 µM TPP concentrations for each state. (C) Table summarizing directional rates for transitions between HMM states A, B, and C. The yellow icon indicates the TPP-dependent transition rate. DOI: http://dx.doi.org/10.7554/eLife.12362.011
Figure 7.
Figure 7.. Correspondences among single-molecule state identifications, and model of aptamer binding to TPP.
(A) Cartoon summarizing the correspondence between analysis and data collection methodologies. The corresponding states and reaction schemes obtained from HMM analysis (top line; pink circles), helix-arm configuration states obtained from FRET signals (middle line; blue circles), and secondary structural states inferred from force spectroscopy (lower line; green ellipses) are shown. (B) Model for ligand binding and associated conformational changes. Colored labels indicate states based on aptamer secondary structure (green circles and ellipses; derived from force data) and sensor-helix arm configuration (blue circles; derived from FRET data). Prior to TPP binding, the sensor arms are apart. Subsequent to TPP binding, the arms remain mobile but begin to move closer together in the weakly-bound, liganded state. This mobility may reflect a type of conformational heterogeneity that is either dynamic (top), with flexible arms, or static (bottom), with rapid interconversions between transient states (square brackets; see text). The system subsequently transitions, on a timescale of around a second, to a strongly bound state, with the sensor arms fully docked and largely immobilized. DOI: http://dx.doi.org/10.7554/eLife.12362.012
Figure 8.
Figure 8.. Dye characterization using DNA hairpins.
(A) Opening distances (F1/2) and forces (Δx) of DNA hairpins SJ1 and SJ2 were measured at non-equilibrium and compared to previous measurements at equilibrium. (B) FRET trajectories and FECs are shown. (C) k-means clustering for SJ1 and SJ2 FRET trajectories. Cluster means are indicated with filled diamonds. (D) Table summarizing opening force and FRET statistics, force ramp FRET statistics, plus predicted FRET efficiency. (E) Donor and acceptor traces (top) in the presence of 20 and 30% TQ (left and right, respectively). DOI: http://dx.doi.org/10.7554/eLife.12362.013

Comment in

  • The light side of the force.
    Basu A, Ha T. Basu A, et al. Elife. 2016 Feb 23;5:e14274. doi: 10.7554/eLife.14274. Elife. 2016. PMID: 26902718 Free PMC article.

References

    1. Akiyama BM, Stone MD. Assembly of complex RNAs by splinted ligation. Methods Enzymol. 2009;469:27–46. doi: 10.1016/S0076-6879(09)69002-9. - DOI - PubMed
    1. Anthony PC, Perez CF, Garcia-Garcia C, Block SM. Folding energy landscape of the thiamine pyrophosphate riboswitch aptamer. Proceedings of the National Academy of Sciences of the United States of America. 2012;109:1485–1489. doi: 10.1073/pnas.1115045109. - DOI - PMC - PubMed
    1. Beauchamp KA, Bowman GR, Lane TJ, Maibaum L, Haque IS, Pande VS. MSMBuilder2: modeling conformational dynamics on the picosecond to millisecond scale. Journal of Chemical Theory and Computation. 2011;7:3412–3419. doi: 10.1021/ct200463m. - DOI - PMC - PubMed
    1. Blakely BL, Dumelin CE, Trappmann B, McGregor LM, Choi CK, Anthony PC, Duesterberg VK, Baker BM, Block SM, Liu DR, Chen CS. A DNA-based molecular probe for optically reporting cellular traction forces. Nature Methods. 2014;11:1229–1232. doi: 10.1038/nmeth.3145. - DOI - PMC - PubMed
    1. Candelli A, Wuite GJL, Peterman EJG. Combining optical trapping, fluorescence microscopy and micro-fluidics for single molecule studies of DNA–protein interactions. Physical Chemistry Chemical Physics. 2011;13:7263–7272. doi: 10.1039/c0cp02844d. - DOI - PubMed

MeSH terms