. 2015 Dec 28;10(12):e0145218.
doi: 10.1371/journal.pone.0145218. eCollection 2015.

R-Ras Regulates Murine T Cell Migration and Intercellular Adhesion Molecule-1 Binding

Affiliations

R-Ras Regulates Murine T Cell Migration and Intercellular Adhesion Molecule-1 Binding

Xiaocai Yan et al. PLoS One. .

Abstract

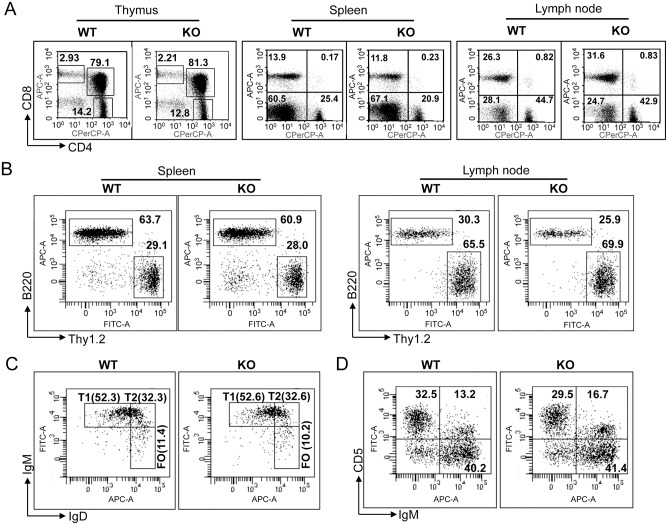
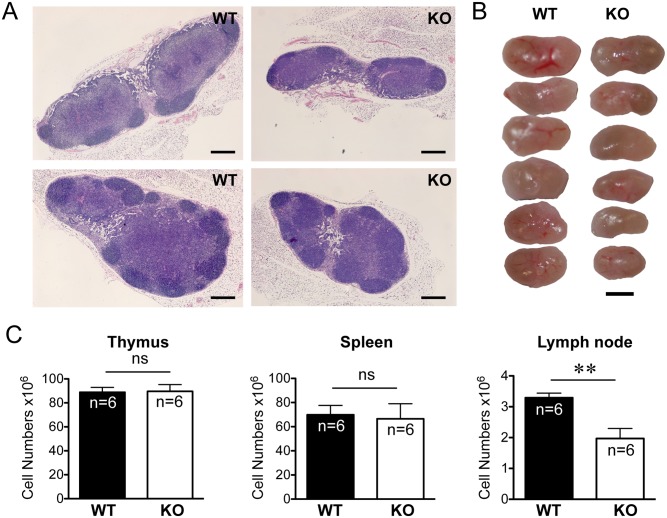
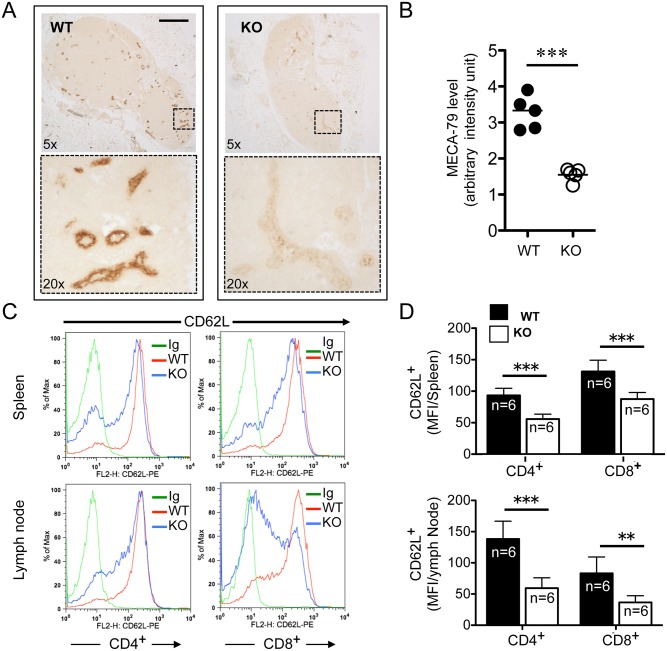
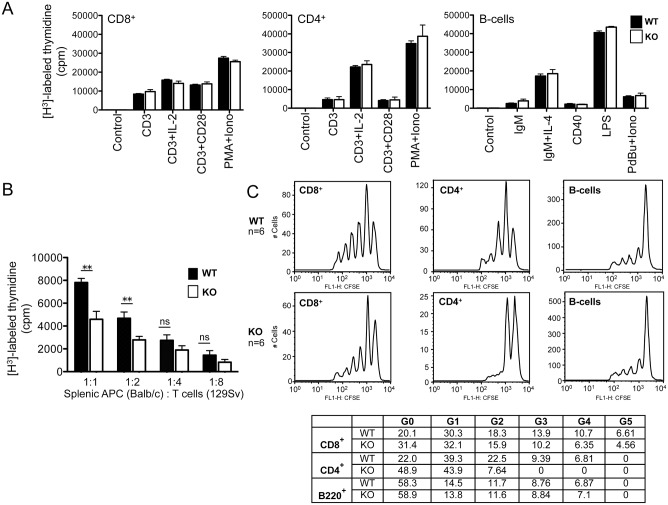
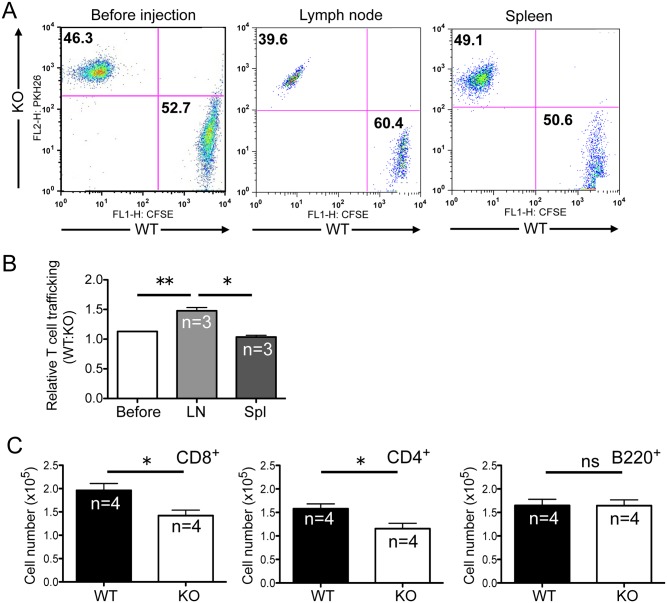
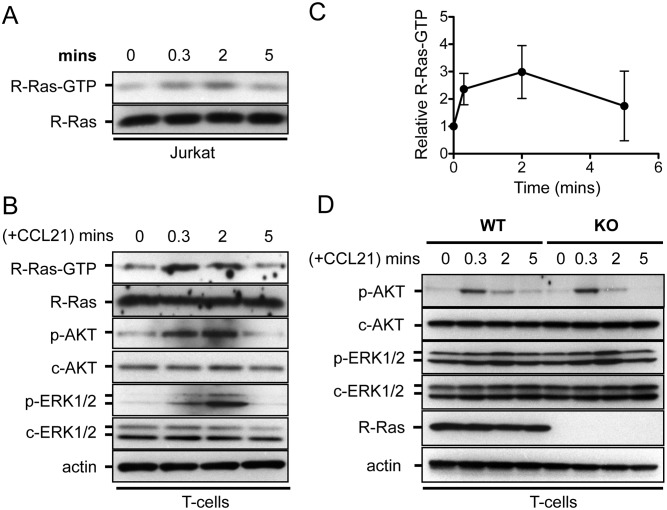
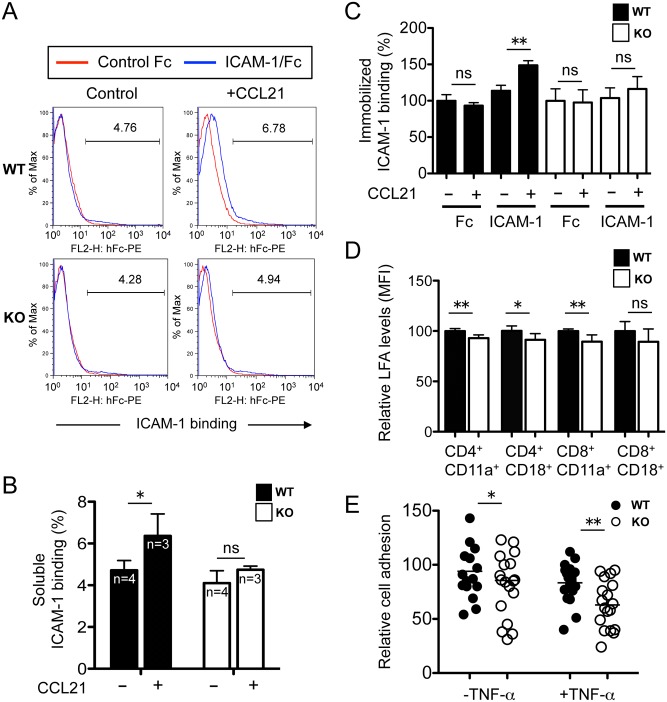
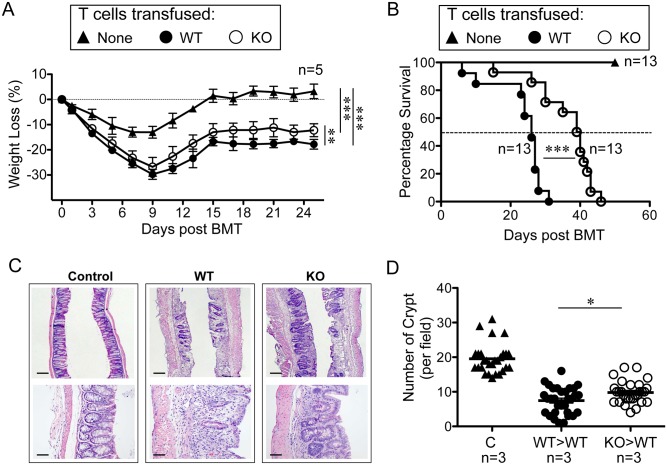
The trafficking of T-lymphocytes to peripheral draining lymph nodes is crucial for mounting an adaptive immune response. The role of chemokines in the activation of integrins via Ras-related small GTPases has been well established. R-Ras is a member of the Ras-subfamily of small guanosine-5'-triphosphate-binding proteins and its role in T cell trafficking has been investigated in R-Ras null mice (Rras-/-). An examination of the lymphoid organs of Rras-/- mice revealed a 40% reduction in the cellularity of the peripheral lymph nodes. Morphologically, the high endothelial venules of Rras-/- mice were more disorganized and less mature than those of wild-type mice. Furthermore, CD4+ and CD8+ T cells from Rras-/- mice had approximately 42% lower surface expression of L-selectin/CD62L. These aberrant peripheral lymph node phenotypes were associated with proliferative and trafficking defects in Rras-/- T cells. Furthermore, R-Ras could be activated by the chemokine, CCL21. Indeed, Rras-/- T cells had approximately 14.5% attenuation in binding to intercellular adhesion molecule 1 upon CCL21 stimulation. Finally, in a graft-versus host disease model, recipient mice that were transfused with Rras-/- T cells showed a significant reduction in disease severity when compared with mice transplanted with wild-type T cells. These findings implicate a role for R-Ras in T cell trafficking in the high endothelial venules during an effective immune response.


Conflict of interest statement

Competing Interests: The authors have declared that no competing interests exist.

Figures

Fig 1
Fig 1. Immune cells development and functions of Rras −/− mice.
Indicated lymphoid organs from Rras +/+ (wild-type; WT) and Rras −/− (knockout; KO) mice were analyzed by flow cytometry for subpopulations of (A) T cells, (B) T and B cells, (C) B220+ splenic T1, T2, and FO B cells, and (D) B220+ splenic B1 B cells.
Fig 2
Fig 2. Decreased peripheral lymph organ cellularity in Rras −/− mice.
(A) Hematoxylin and eosin staining of axillary lymph nodes. Bars, 200 μm. (B) Pictures of lymph nodes are shown. Bars, 400 μm. (C) Cell suspensions were prepared from the indicated organs (six in each group) and cellularity was determined by trypan blue exclusion. Data represent at least three independent experiments. Statistical analysis was performed using a two-tailed student’s t test. Bars, SE. ns, no significant difference. **p< 0.005.
Fig 3
Fig 3. Aberrant lymph nodes in Rras −/− mice.
(A) Immunohistochemical analysis of Rras +/+ (WT) and Rras −/− (KO) lymph nodes stained with anti-MECA-79 (brown). Magnified areas (boxed) are shown in lower panels. Bars, 200 μm. (B) Staining intensity was quantified from five lymph nodes. Bars, means. ***p<0.0001, t-test. (C) Surface expression of CD62L in CD4+ and CD8+ T cells from spleen and lymph nodes (LN) of Rras +/+ and Rras −/− mice was analyzed with flow cytometry. Isotype immunoglobulin (Ig) was used as a control. (D) The results from six mice per group were quantified and depicted. Bars, SD, two-tailed t-test. **p<0.005, ***p<0.0001.
Fig 4
Fig 4. Attenuated T cell proliferation in Rras −/− mice.
(A) T and B lymphocytes were stimulated with the indicated immune regulators and cell proliferation was measured by thymidine incorporation techniques. Results from triplicate measurements using two mice per group. Bars, SD. Abbreviations, IL-2, interleukin-2; PMA, phorbol myristate acetate; Iono, ionomycin; interleukin-4, IL-4; LPS, lipopolysaccharide; PdBU, phorbol 12, 13-dibutyrate. (B) Mixed lymphocyte reaction assays were carried out by co-mixing T cells from either Rras +/+ (solid bars) or Rras −/− (open bars) mice in 129Sv strain with T cell-depleted splenic antigen-presenting cells from WT Balb/c mice at the indicated ratios. T cell proliferation was assessed 4 days later with the [H3]-thymidine incorporation method. Results represent triplicate measurements from a single experiment that was reproduced twice. Bars, SD. ns, no significant difference. **p< 0.005. (C) In vivo proliferation of splenocytes was conducted by the dye dilution method. Sublethally irradiated naïve C57BL/6 mice were infused with 8 to 10 × 106 of CFSE labeled total splenocytes from either Rras +/+ (WT) or Rras −/− (KO) mice. After 14 days, spleens were collected for dye dilution assays followed by flow analysis. Representative data are shown with six per group. The relative cell numbers (%) in individual peaks are shown in the table.
Fig 5
Fig 5. Homing defects of Rras −/− T cells.
(A) Rras +/+ (WT) and Rras −/− (KO) naïve T cells were separately labeled with PKH26 and CFSE, respectively. Then, 5 × 10⁶ cells of each population were co-mixed and injected into WT mice. After 2 h, the uninjected cell mix (Before), lymph nodes (LN), and spleen (Spl) were analyzed with flow cytometry. (B) The relative ratios of Rras +/+ to Rras −/− T cells are depicted. Results are from a representative experiment and was reproduced twice. Bars, SD. Paired t-test. *p<0.05, **p<0.005. (C) CFSE-labeled T cells were injected into WT mice, and after 6 days, different lymphocyte subsets in PLNs were quantified by flow cytometry. Bars, SE. *p<0.05, ns, not significant.
Fig 6
Fig 6. CCL21 activates R-Ras GTP-loading.
(A) Jurkat cells and (B) splenic T cells were treated with CCL21 (0.5 μg/ml) for the indicated duration. The levels of GTP-bound active R-Ras were determined by pull-down assays using a RalGDS-RBD affinity probe. The activation states of AKT (p-AKT) and ERK1/2 (p-ERK1/2) are shown. (C) Results from splenic T cells were quantified from three independent experiments and show the fold-increase in R-Ras-GTP at each time point. Bars, SD. (D) T cells from Rras +/+ (WT) and Rras −/− (KO) mice were stimulated with CCL21 (0.5 μg/ml), and the levels of p-AKT and p-ERK1/2 are analyzed with Western blotting analysis. T cells were pooled from two mice per group.
Fig 7
Fig 7. Reduced ICAM-1 binding in Rras −/− T cells.
(A) Splenic T cells were treated with CCL21 (0.5 μg/ml) for 5 min, washed and incubated with ICAM-1/Fc (10 μg/ml) for 30 min. Bound Fc was detected by a PE-conjugated goat anti-human IgG followed by flow cytometry analysis. (B) Quantification of results is shown as the percentage of ICAM-1 binding. Bars, SD. *p<0.05, two-tailed t-test. ns, not significant. (C) Quantification of T cells binding to immobilized Fc and ICAM-1/Fc in 96-well plates in the presence or absence of CCL21 (1 μg/ml). Results are presented as ICAM-1 binding relative to untreated controls. Three mice were used per group. Bars, SD. Two-tailed t-test. **p<0.005, ns, not significant. (D) The relative surface expression of CD11a and CD18 on splenic T cells were quantified by FACS. Results are from six animals per group. Bars, SD. Two-tailed t-test. *p<0.05, **p<0.005, ns, not significant. (E) Cell adhesion assays were carried out in 2H-11 endothelial cells. CFSE-labeled T cells were added in triplicates to 2H-11 pretreated without or with TNF-α. Bound cells were quantified by counting the number of green cells from three randomly selected fields. Data are from two mice per group. Bars, mean values. Two-tailed t-test. *p<0.05, **p<0.005.
Fig 8
Fig 8. Attenuated Severity of GVHD induced by T cells from Rras −/− animals.
Balb/c mice were given 900 rad lethal dose irradiation and received 5 × 10⁶ of bone marrow cells from WT C57BL/6 mice. These animals were also transfused without (▲) or with splenocytes that were adjusted to include 1 × 10⁶ of T cells from either WT (●) or Rras −/− (○) C57BL/6 animals on the second day. Body weight changes (A) and animal survival (B) were monitored. Body weight loss data from a representative experiment is shown (A). Bars, SD. One-way ANOVA. **p<0.005, ***p<0.0001. Survival data are presented by combining two independent experiments with 13 mice per group. Statistical analysis was performed using two-way ANOVA (A) and Log-rank (Mantel-Cox) test (B). ***p<0.0001. (C) Hematoxylin and eosin staining of ileal intestines collected on day 21 after T cell transfusion. Upper panels (2.5× Bars, 200 μm); lower panels (20× Bars, 25 μm). (D) Images were analyzed for the number of crypts per field of view. Approximately 30 fields were analyzed from three mice per group. Bars, mean. Unpaired t-test. *p< 0.05.

Similar articles

Cited by

References

    1. Saez R, Chan AM, Miki T, Aaronson SA. Oncogenic activation of human R-ras by point mutations analogous to those of prototype H-ras oncogenes. Oncogene. 1994;9(10):2977–82. Epub 1994/10/01. . - PubMed
    1. Cox AD, Brtva TR, Lowe DG, Der CJ. R-Ras induces malignant, but not morphologic, transformation of NIH3T3 cells. Oncogene. 1994;9(11):3281–8. Epub 1994/11/01. . - PubMed
    1. Wurtzel JG, Kumar P, Goldfinger LE. Palmitoylation regulates vesicular trafficking of R-Ras to membrane ruffles and effects on ruffling and cell spreading. Small GTPases. 2012;3(3):139–53. Epub 2012/07/04. 21084 [pii] 10.4161/sgtp.21084 - DOI - PMC - PubMed
    1. Holly SP, Larson MK, Parise LV. The unique N-terminus of R-ras is required for Rac activation and precise regulation of cell migration. Mol Biol Cell. 2005;16(5):2458–69. Epub 2005/03/18. E03-12-0917 [pii] 10.1091/mbc.E03-12-0917 - DOI - PMC - PubMed
    1. Ada-Nguema AS, Xenias H, Hofman JM, Wiggins CH, Sheetz MP, Keely PJ. The small GTPase R-Ras regulates organization of actin and drives membrane protrusions through the activity of PLCepsilon. J Cell Sci. 2006;119(Pt 7):1307–19. Epub 2006/03/16. jcs.02835 [pii] 10.1242/jcs.02835 . - DOI - PubMed

Publication types

MeSH terms

LinkOut - more resources