. 2016 May;137(3):436-45.
doi: 10.1111/jnc.13507. Epub 2016 Mar 30.

miR-186 is decreased in aged brain and suppresses BACE1 expression

Affiliations

miR-186 is decreased in aged brain and suppresses BACE1 expression

Jaekwang Kim et al. J Neurochem. 2016 May.

Abstract

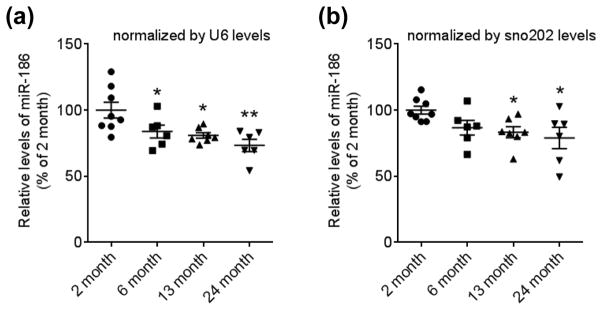
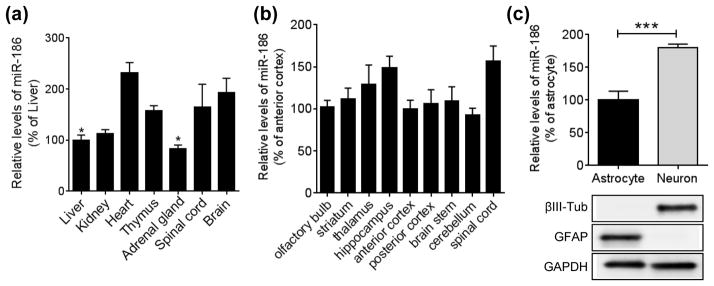
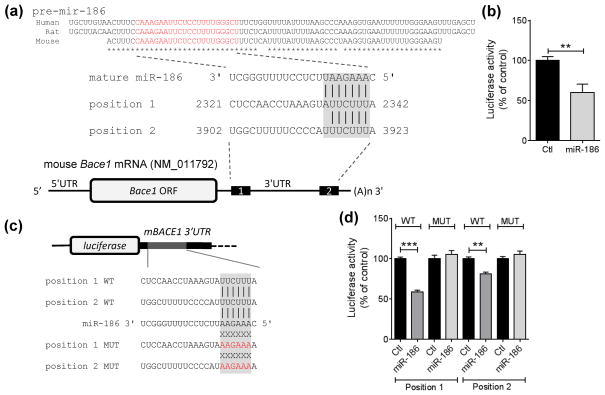
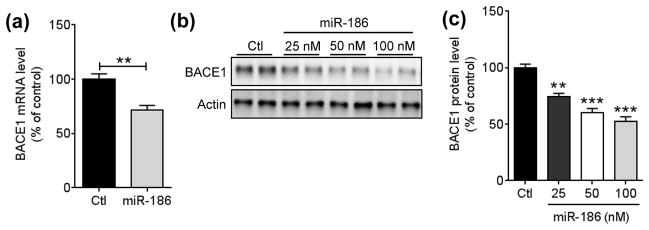
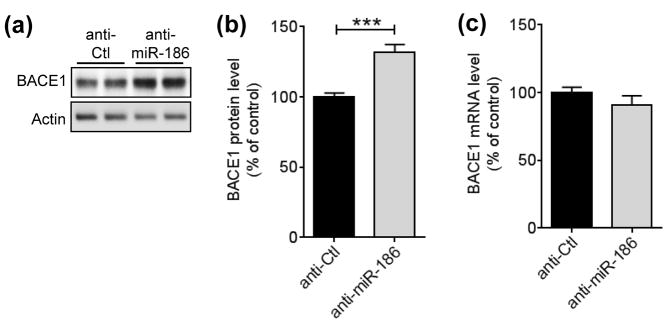
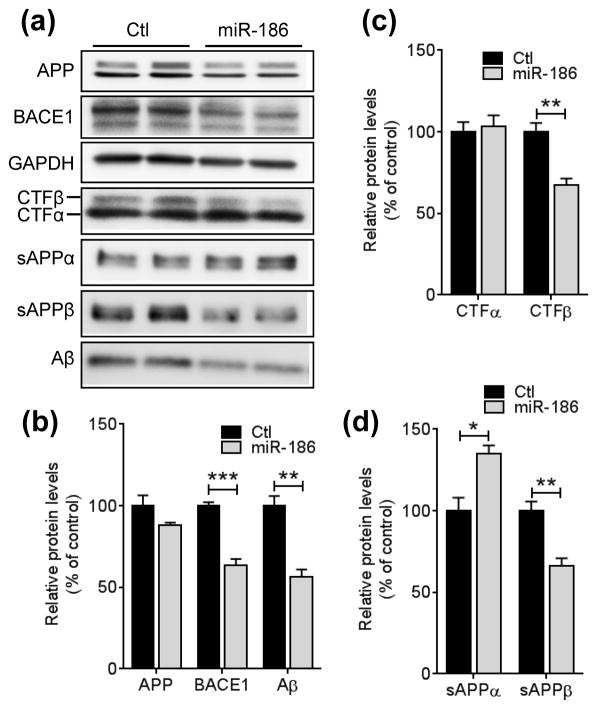
Accumulation of amyloid β (Aβ) in the brain is a key pathological hallmark of Alzheimer's disease (AD). Because aging is the most prominent risk factor for AD, understanding the molecular changes during aging is likely to provide critical insights into AD pathogenesis. However, studies on the role of miRNAs in aging and AD pathogenesis have only recently been initiated. Identifying miRNAs dysregulated by the aging process in the brain may lead to novel understanding of molecular mechanisms of AD pathogenesis. Here, we identified that miR-186 levels are gradually decreased in cortices of mouse brains during aging. In addition, we demonstrated that miR-186 suppresses β-site amyloid precursor protein-cleaving enzyme 1 (BACE1) expression by directly targeting the 3'UTR of Bace1 mRNA in neuronal cells. In contrast, inhibition of endogenous miR-186 significantly increased BACE1 levels in neuronal cells. Importantly, miR-186 over-expression significantly decreased Aβ level by suppressing BACE1 expression in cells expressing human pathogenic mutant amyloid precursor protein. Taken together, our data demonstrate that miR-186 is a potent negative regulator of BACE1 in neuronal cells and it may be one of the molecular links between brain aging and the increased risk for AD during aging. We identified that miR-186 levels are gradually decreased in mouse cortices during aging. Furthermore, we demonstrated that miR-186 is a novel negative regulator of beta-site amyloid precursor protein-cleaving enzyme 1 (BACE1) expression in neuronal cells. Therefore, we proposed that reduction in miR-186 levels during aging may lead to the up-regulation of BACE1 in the brain, thereby increasing a risk for Alzheimer's disease in aged individuals. Read the Editorial Highlight for this article on page 308.

Keywords: Alzheimer's disease; Aβ; BACE1; aging; miR-186; microRNA.


Conflict of interest statement

The authors have no conflict of interests.

Figures

FIGURE 1
FIGURE 1
miR-186 expression is decreased during aging in the mouse brain cortex. Mature miR-186 levels were analyzed by qRT-PCR in mouse cortex at different ages (n= 8 for 2 month, 6 for 6 month, 7 for 13 month, 6 for 24 month). Each level was represented as a percentage of 2 month old mice. Values are mean ± SEM (*, p<0.05; **, p<0.01; One-way ANOVA compared to 2 month with post hoc Holm-Sidak’s test).
FIGURE 2
FIGURE 2
miR-186 expression pattern in the brain. (a) Relative expression levels of miR-186 in different mouse tissues. Endogenous levels of miR-186 were analyzed by qRT-PCR in different mouse tissues of 3.5-month-old C57B6 mice (n = 3). Each level was normalized by corresponding U6 level and represented as a percentage of liver (*, p<0.05; One-way ANOVA compared to brain with post hoc Dunnett’s test). (b) Relative expression of miR-186 in the mouse brain (n = 3). Each level was normalized by corresponding U6 level and represented as a percentage of the anterior cortex (One-way ANOVA compared to anterior cortex with post hoc Dunnett’s test). (c) Relative expression levels of miR-186 in primary cells isolated from mice brains. miR-186 levels were analyzed in mouse primary neurons and astrocytes by qRT-PCR. The purity of primary culture cells was assessed by Western blotting of cell lysates with neuron-specific βIII-Tubulin and astrocyte-specific GFAP antibodies. Data are shown as a percentage of astrocytes (n = 6, ***, p<0.001, t-test). All Values are mean ± SEM.
FIGURE 3
FIGURE 3
miR-186 directly targets the 3′UTR of Bace1 mRNA. (a) Schematic diagram of target sites of miR-186 in Bace1 mRNA. The mature sequence of miR-186 is shown in red within pre-mir-186. miR-186 has 2 potential targeting sites in the mouse Bace1 3′UTR with complementary seed match indicated with gray box. Asterisk (*) indicates conserved nucleotides. (b) miR-186 directly targets the 3′UTR of Bace1 mRNA. (n = 7 per group). Luciferase reporter assays were performed with the reporter construct containing the full-length 3′ UTR of mBace1 mRNA downstream of Renilla luciferase. Mouse Neuro-2a neuronal cells were transfected with reporter construct with 75 nM negative control (Ctl) or miR-186. Renilla luciferase activity was normalized with the corresponding firefly luciferase activity. (c) Schematic diagram of luciferase constructs with miRNA recognition sites (MREs). The reporter constructs contain the partial 3′ UTRs (~ 40 nt) including the predicted sites of mouse Bace1 mRNA downstream of the firefly luciferase ORF (pmirGLO-mBace1 MRE WT). The mutated sequences in the seed match region are shown in red (pmirGLO-mBace1 MRE MUT). (d) miR-186 directly targets both MREs in the 3′UTR of Bace1 mRNA (n = 4). Mouse Neuro-2a neuronal cells were transfected with pmirGLO-mBace1 MRE-WT or MRE–MUT construct with 75 nM negative control (Ctl) or miR-186. Firefly luciferase activity was normalized with the corresponding Renilla luciferase activity. Data are shown as a percentage of control. Values are mean ± SEM (**, p<0.01; ***, p<0.001, t-test).
FIGURE 4
FIGURE 4
miR-186 decreases both mRNA and protein expression levels of endogenous BACE1 in neuronal cells. (a) Reduction of Bace1 mRNA by miR-186 in Neuro-2a cells. 48 h post-transfection with 75 nM of negative control or miR-186, Bace1 mRNA levels were measured by qRT-PCR and normalized by corresponding Gapdh levels (n = 6, **, p<0.01; t-test). (b, c) Dose-dependent decrease of endogenous BACE1 protein levels by miR-186 in Neuro2a cells. 48 h post-transfection with indicated amount of negative control or miR-186, BACE1 protein levels were monitored by Western blot. Representative Western blot images (b) and relative BACE1 protein levels (c) are shown. BACE1 protein levels were normalize by corresponding β-actin levels (n = 4). All data are shown as a percentage of control. Values are mean ± SEM (**, p<0.01; ***, p<0.001, One-way ANOVA compared to control with post hoc Dunnett’s test).
FIGURE 5
FIGURE 5
Inhibition of endogenous miR-186 increases BACE1 expression in neuronal cells. (a, b) Inhibition of miR-186 increases BACE1 protein levels in Neuro-2a cells. Neuro-2a cells were transfected with 50 nM of anti-miR-186 or anti-control (anti-Ctl). 72 h post-transfection, cell lysates were applied for Western blot. A representative western blot images (a) and relative BACE1 levels (b) are shown. BACE1 protein levels were quantified as a percentage of control after normalization by corresponding β-actin levels (n = 7). (c) Inhibition of miR-186 does not affect BACE1 mRNA levels in Neuro-2a cells. Neuro-2a cells were transfected with 50 nM of anti-miR-186 or anti-control (anti-Ctl). 72 h post-transfection, Bace1 mRNA levels were measured by qRT-PCR and normalized by corresponding Gapdh levels (n = 7). Data are shown as a percentage of control. Values are mean ± SEM (***, p<0.001, t-test).
FIGURE 6
FIGURE 6
miR-186 represses Aβ secretion by suppressing BACE1 expression. 7PA2 cells expressing Indiana mutant hAPP were transfected with 75 nM negative control or miR-186. 48 h post-transfection, cells were incubated in fresh medium for 6 h and then, cell and media were collected for Western blot analyses. Representative western blot images (a) and relative protein levels (b - d) are shown (n = 7). 82E1 anti-Aβ western blot detects total Aβ, including Aβ40 and Aβ42. Data are shown as a percentage of control. Values are mean ± SEM (*, p<0.05; **, p<0.01; ***, p<0.001, t-test).
FIGURE 7
FIGURE 7
miR-186 expression is not affected by either oxidative stress or inflammation. Neuro-2a cells were incubated 100 μM H2O2 (a) or 100 ng/ml LPS (b) for 24 h. miR-186 levels were measured by qRT-PCR and normalized by corresponding U6 levels (n = 4, t-test).

Comment in

References

    1. Ahmed RR, Holler CJ, Webb RL, Li F, Beckett TL, Murphy MP. BACE1 and BACE2 enzymatic activities in Alzheimer’s disease. J Neurochem. 2010;112:1045–1053. - PMC - PubMed
    1. Balaban RS, Nemoto S, Finkel T. Mitochondria, oxidants, and aging. Cell. 2005;120:483–495. - PubMed
    1. Bartel DP. MicroRNAs: target recognition and regulatory functions. Cell. 2009;136:215–233. - PMC - PubMed
    1. Belsky DW, Caspi A, Houts R, et al. Quantification of biological aging in young adults. Proc Natl Acad Sci U S A. 2015;112:E4104–4110. - PMC - PubMed
    1. Berezikov E, Thuemmler F, van Laake LW, et al. Diversity of microRNAs in human and chimpanzee brain. Nat Genet. 2006;38:1375–1377. - PubMed

Publication types

MeSH terms