. 2016 Jan 6;89(1):221-34.
doi: 10.1016/j.neuron.2015.11.028. Epub 2015 Dec 17.

Relationships between Pupil Diameter and Neuronal Activity in the Locus Coeruleus, Colliculi, and Cingulate Cortex

Affiliations

Relationships between Pupil Diameter and Neuronal Activity in the Locus Coeruleus, Colliculi, and Cingulate Cortex

Siddhartha Joshi et al. Neuron. .

Abstract

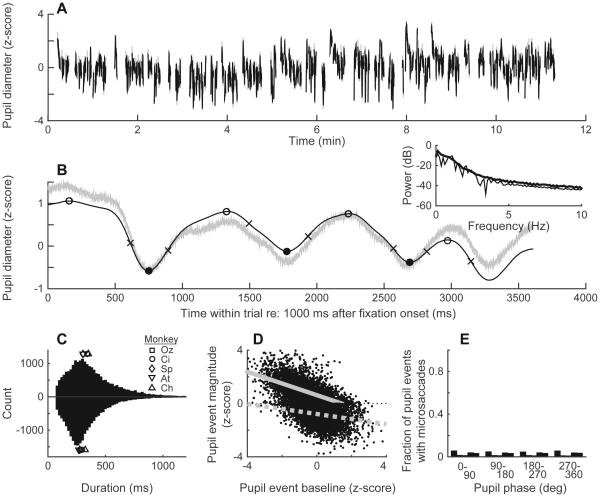
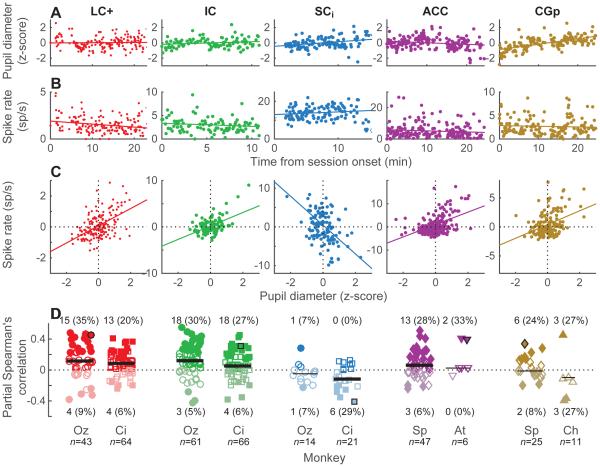
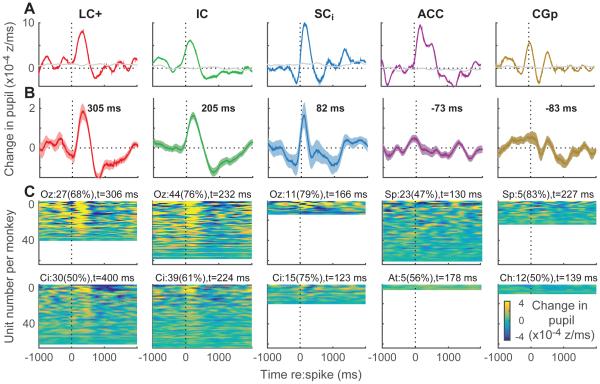
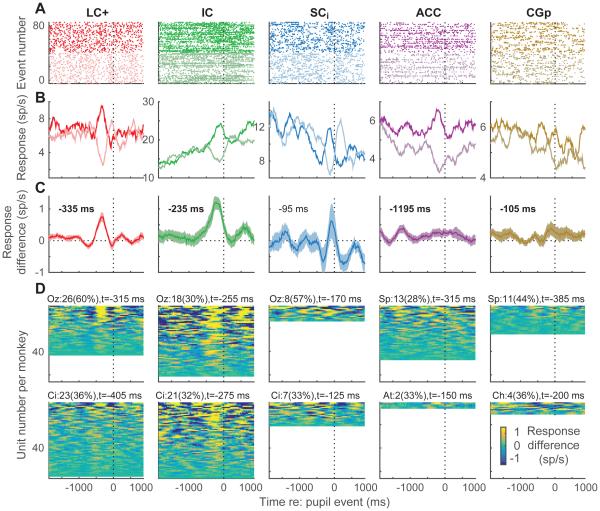
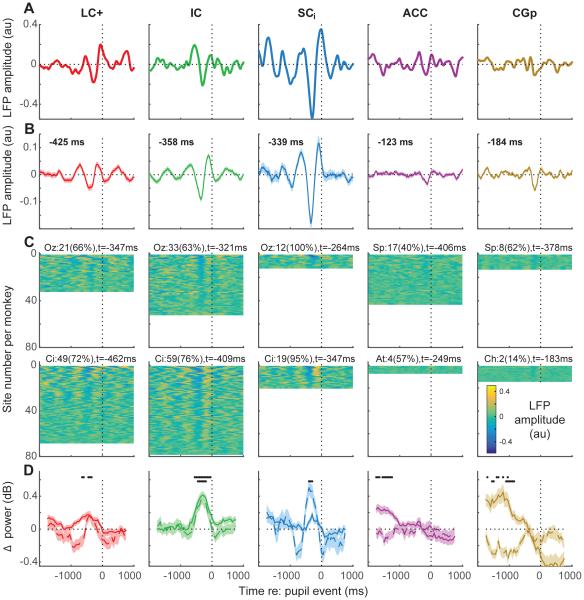
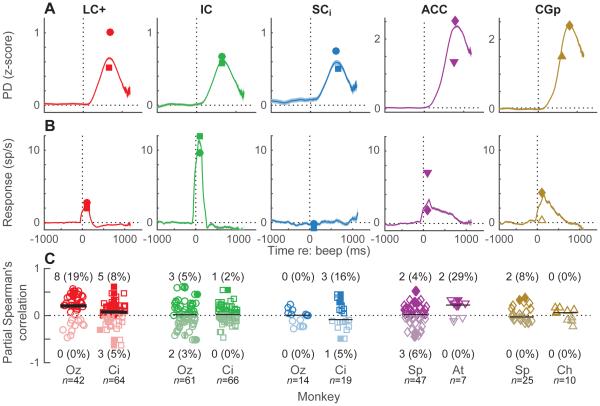
Changes in pupil diameter that reflect effort and other cognitive factors are often interpreted in terms of the activity of norepinephrine-containing neurons in the brainstem nucleus locus coeruleus (LC), but there is little direct evidence for such a relationship. Here, we show that LC activation reliably anticipates changes in pupil diameter that either fluctuate naturally or are driven by external events during near fixation, as in many psychophysical tasks. This relationship occurs on as fine a temporal and spatial scale as single spikes from single units. However, this relationship is not specific to the LC. Similar relationships, albeit with delayed timing and different reliabilities across sites, are evident in the inferior and superior colliculus and anterior and posterior cingulate cortex. Because these regions are interconnected with the LC, the results suggest that non-luminance-mediated changes in pupil diameter might reflect LC-mediated coordination of neuronal activity throughout some parts of the brain.


Figures

Figure 1
Figure 1
Recording site locations. (A) Approximately sagittal MRI section for monkey Ci showing estimated recording site locations in SCi, IC, and LC+, along with the approximate depth from the cortical surface along the electrode tract. (B) Schematic of a coronal section of the macaque brain showing structures typically encountered along our electrode tracts (adapted from (Paxinos et al., 2008), Plate 90, Interaural 0.3, bregma 21.60; see also (Kalwani et al., 2014), Fig. 3). (C) Approximately sagittal MRI section for monkey Sp showing estimated recording sites in ACC and CGp, along with the approximate depth from the cortical surface along the electrode tract. (D, E) Schematic of a coronal section of the macaque brain showing structures typically encountered along our electrode tracts to ACC (D; adapted from (Paxinos et al., 2008), Plate 16, Interaural 33.60, bregma 11.70) or CGp (E; adapted from (Paxinos et al., 2008), Plate 89, Interaural 0.75, bregma -21.15). Lightly shaded yellow regions in (A) and (C) correspond to the three-dimensional projections of the recording cylinder (Kalwani et al., 2009). Arrows in (B), (D), and (E) show approximate electrode tracts. CG: cingulate gyrus; CS: cingulate sulcus; DCIC: dorsal complex of the IC; InG: intermediate gray of the SC; me5: mesencephalic 5 tract; subCD: dorsal subcoeruleus; 4v: fourth ventricle; 4x: trochlear decussation; 9/32, 24c: ACC (dorsal); 32, 24a, 24b: ACC (ventral); 23a, 23b, 31: CGp.
Figure 2
Figure 2
Measuring pupil diameter. (A) Pupil diameter measured during one recording session (Monkey Oz). Only stable fixation epochs used for further analyses are shown; thus, data breaks represent unstable fixations and inter-trial intervals. (B) Single-trial raw (gray) and smoothed and standardized (black) pupil trace during stable fixation. Open and closed circles indicate local maxima and minima, respectively, which define pupil “events.” Crosses indicate the peak slope of the pupil signal between extrema. Inset shows pupil power spectrum (thin line is the example trial, thick line is trial mean for this session). (C) Distribution of pupil event durations for all monkeys and all sessions. Dilation times (intervals between each local minimum and the subsequent maximum) are shown above the x-axis, whereas constriction times (intervals between each local maximum and the subsequent minimum) are shown below it. Median values for each of the 5 monkeys are shown as different (overlapping) symbols, as indicated. (D) Per-cycle pupil event baseline versus fluctuation magnitude, measured for one representative monkey. Gray lines show linear regressions for dilations (solid) and constrictions (dashed). (E) Proportion of pupil events with microsaccades, plotted as a function of the phase of the pupil event in which it occurred (five bars per bin represent the five monkeys, ordered as in the legend in panel C). For all five monkeys, the distributions were uniform with respect to phase (Rayleigh test, p>0.05).
Figure 3
Figure 3
Trial-by-trial associations between mean pupil diameter and spike rate for each brain region, as indicated (columns). (A–C) Example sessions. Per-trial mean pupil diameter (A) and spike rate (B) are each plotted as a function of the time of the beginning of stable fixation in the given trial, with respect to the beginning of the session. Lines are linear fits. Panel C shows residuals to these fits. The line is a linear fit to the paired residuals, representing the partial correlation between pupil diameter and spike rate, accounting for linear drifts of each variable as a function of time within the session. (D) Distributions of Spearman’s partial correlations (ρ) between trial-by-trial pupil diameter and spike rate, accounting for time within the session, for each session from each monkey and each brain region, as indicated. Darker/lighter symbols indicate ρ>0/ρ<0. Filled symbols indicate H0: ρ=0, p<0.05. Counts (percentages) of significant positive/negative effects are shown for each monkey (per-monkey percentages for positive or negative effects were indistinguishable between LC+ and IC but were different for SCi, including fewer positive effects for both monkeys and more negative effects for monkey Ci; chi-squared test, p<0.05). Black symbols indicate the example sessions above. Scatter along the abscissa is arbitrary, for readability. Horizontal lines are medians; thick lines indicate H0: median=0, Wilcoxon rank-sum test p<0.05.
Figure 4
Figure 4
Spike-triggered changes in pupil diameter for each brain region, as indicated (columns). (A) Example units. Colored lines are mean values computed from all spikes recorded during stable fixation in the given session. Gray lines are values computed after shuffling pupil diameter relative to spiking activity on a trial-by-trial basis. (B) Mean±sem spike-triggered changes in pupil diameter computed from the mean, real– shuffled curves computed for each recorded unit from the two monkeys. The time of the maximum value is shown; bold indicates H0: the value at that time=0, p<0.05 bootstrapped from the mean±sem values computed per unit for the given time bin. (C) Mean spike-triggered changes in pupil diameter for all recorded single units, sorted by modulation depth per monkey (top rows show units with the biggest difference between the minimum and maximum values). Text indicates the count (percentage) of sites for each monkey with a reliable peak (defined as ≥75 consecutive bins with at least one bin between 100 ms before and 700 ms after the spike for which real–shuffled was significantly >0, Mann-Whitney p<0.05) and the median time of the reliable peaks. Per-monkey percentages were indistinguishable between LC+, IC, and SCi (chi-squared test, p≥0.05). All analyses used 250-ms time bins stepped in 10-ms intervals.
Figure 5
Figure 5
Spike PETHs aligned to pupil events for each brain region, as indicated (columns). (A, B) Example units. Light/dark lines show rasters (A, showing 40 randomly selected trials for each condition for presentation clarity) and PETHs (B) for large dilation/constriction events (upper/lower 25th percentile slopes; see Fig. 2B), aligned to the time of the event. (C) Mean±sem difference in dilation-versus constriction-aligned PETHs computed for each recorded unit from the two monkeys. The time of the maximum value is shown in each panel; bold indicates H0: the value at that time=0, p<0.05 bootstrapped from the mean±sem values computed per unit for the given time bin. (D) Mean difference in dilation-versus constriction-aligned PETHs computed for all recorded single units, sorted by modulation depth per monkey (top rows show units with the biggest difference between the maximum and minimum values). Text indicates the count (percentage) of sites for each monkey with a reliable peak (defined as ≥75 consecutive bins with at least one bin between 100 ms before and 700 ms after the spike for which real–shuffled was significantly >0, Mann-Whitney p<0.05) and the median time of the reliable peaks. Per-monkey percentages were indistinguishable between LC+, IC, and SCi (chi-squared test, p≥0.05) except for Oz, LC vs. IC. All analyses used 250-ms time bins stepped in 10-ms intervals.
Figure 6
Figure 6
Pupil-related differences in LFP time course and power spectrum for each brain region, as indicated (columns). (A) Differences in time-series LFPs aligned to large pupil events (dilate–constrict) for example recording sites. (B) Mean±sem differences in time-series LFPs aligned to large pupil events computed for each recorded site from the two monkeys. The time of the minimum value from the mean curve is shown; bold indicates H0: the value at that time=0, p<0.05 bootstrapped from the mean±sem values computed per site for the given time bin. (C) Mean differences in time-series LFPs aligned to large pupil events computed for all recording sites, sorted by modulation depth per monkey (top rows show units with the biggest difference between dilation- and constriction-linked values). Text indicates the count (percentage) of sites for each monkey with a reliable trough (defined as ≥75 consecutive bins with at least one bin in the 1000 ms preceding the pupil event with a value that was significantly <0, Wilcoxon rank-sum test p<0.05) and the median time of the reliable troughs. (D) Difference (dilate–constrict) in LFP power spectra aligned to pupil events for low (<30Hz, dashed line) and gamma (30–100Hz) frequency bands. Black dots indicate H0: binned value=0, Mann-Whitney p<0.05 corrected for multiple comparisons (upper row: gamma band; lower row: low-frequency band). All analyses used 500-ms time bins stepped in 50-ms intervals.
Figure 7
Figure 7
Responses to startling events for each brain region, as indicated (columns). (A) Transient pupil dilations evoked by unexpected auditory events (“beeps”). (B) Spiking responses to unexpected auditory events, measured in 200-ms time bins stepped in 10-ms intervals. In (A) and (B), lines/ribbons are mean/SEM across all beep trials from both monkeys. Symbols are maximum values per monkey. (C) Population summary. Spearman’s partial correlation, ρ, between spiking (spike rate 0–200 ms following beep onset minus baseline spike rate measured during fixation prior to beep onset) and pupil (maximum change in pupil diameter 0–800 ms following beep onset) responses, accounting for the effects of baseline pupil diameter on both variables. Darker/lighter symbols indicate ρ>0/ρ<0. Filled symbols indicate H0: ρ=0, p<0.05. Counts (percentages) of significant positive/negative effects are shown for each monkey (for monkey Oz, the percentages for positive effects were significantly different for LC vs. IC or SCi; chi-squared test, p<0.05). Scatter along the abscissa is arbitrary, for readability. Horizontal lines are medians; thick line indicates H0: median=0, Wilcoxon rank-sum test p<0.05.
Figure 8
Figure 8
Effects of electrical microstimulation in LC+, IC, and SCi (columns) on pupil diameter. (A) Pupil diameter aligned to the time of microstimulation onset. Lines and ribbons are mean±SEM across all microstimulation trials from all sessions. (B) Summary of microstimulation effects. Symbols and error bars are mean±SEM peak change in pupil diameter <800 ms following microstimulation onset from individual trials in a given session, plotted as a function of the time of the peak. Closed symbols indicate H0: peak change=0, Wilcoxon rank-sum test p<0.05.

Comment in

References

    1. Alnæs D, Sneve MH, Espeseth T, Endestad T, van de Pavert SH, Laeng B. Pupil size signals mental effort deployed during multiple object tracking and predicts brain activity in the dorsal attention network and the locus coeruleus. J Vis. 2014;14:1, 20. - PubMed
    1. Alpern M, Mason GL, Jardinco RE. Vergence and accommodation. V. Pupil size changes associated with changes in accommodative vergence. Am J Ophthalmol. 1961;52:762, 767. - PubMed
    1. Andreassi JL. Psychophysiology: Human behavior and physiological response. Lawrence Erlbaum Assoc.; Mahwah, NJ: 2000. Pupillary response and behavior; pp. 218–233.
    1. Aston-Jones G, Cohen JD. An integrative theory of locus coeruleus-norepinephrine function: adaptive gain and optimal performance. Annu Rev Neurosci. 2005;28:403, 450. - PubMed
    1. Aston-Jones G, Rajkowski J, Kubiak P, Alexinsky T. Locus coeruleus neurons in monkey are selectively activated by attended cues in a vigilance task. J Neurosci. 1994;14:4467, 4480. - PMC - PubMed

Publication types