. 2016 Jan 6;89(1):177-93.
doi: 10.1016/j.neuron.2015.11.032. Epub 2015 Dec 17.

Congenital Nystagmus Gene FRMD7 Is Necessary for Establishing a Neuronal Circuit Asymmetry for Direction Selectivity

Affiliations

Congenital Nystagmus Gene FRMD7 Is Necessary for Establishing a Neuronal Circuit Asymmetry for Direction Selectivity

Keisuke Yonehara et al. Neuron. .

Abstract

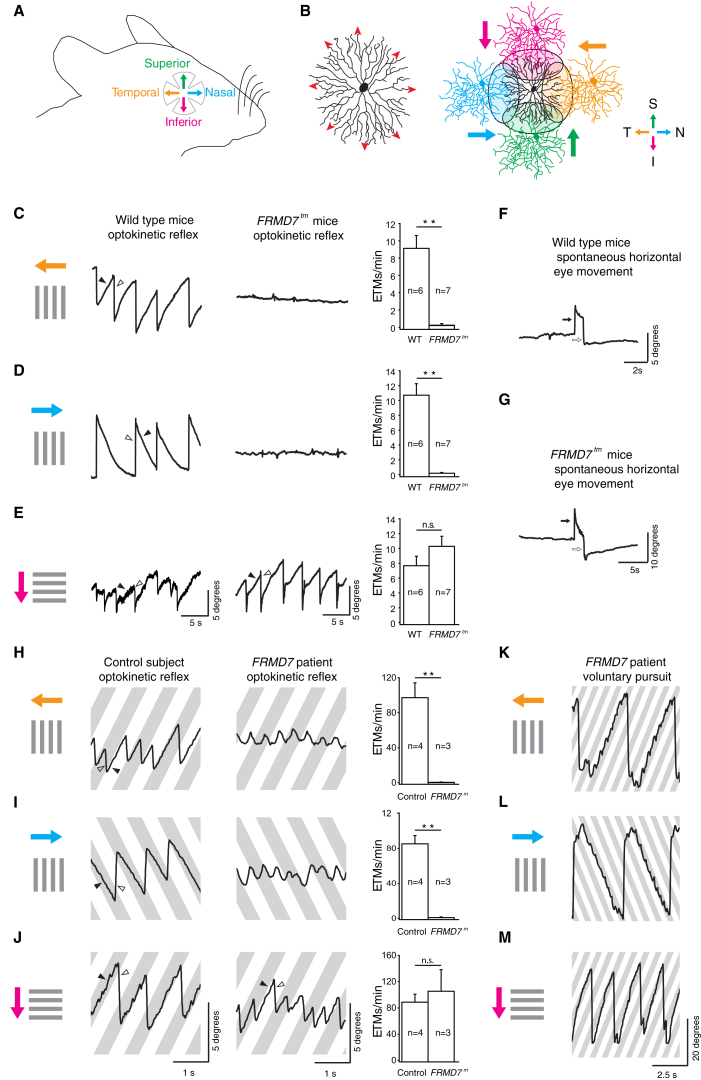
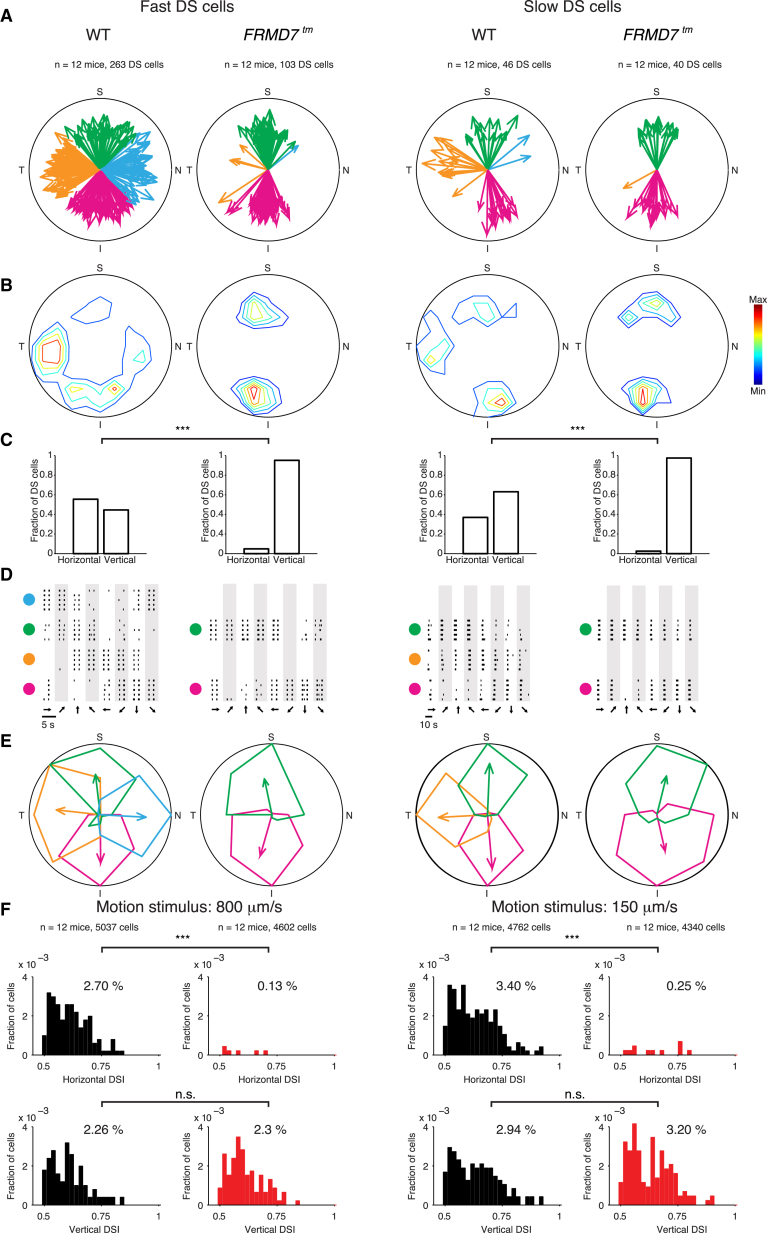
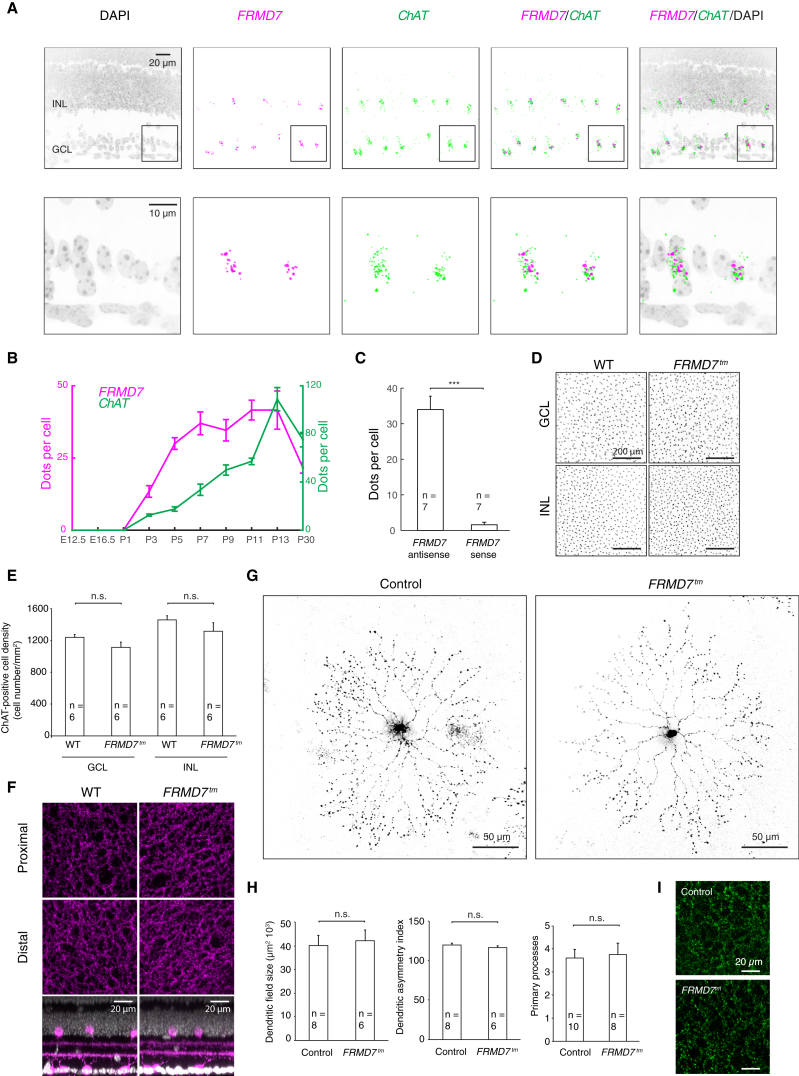
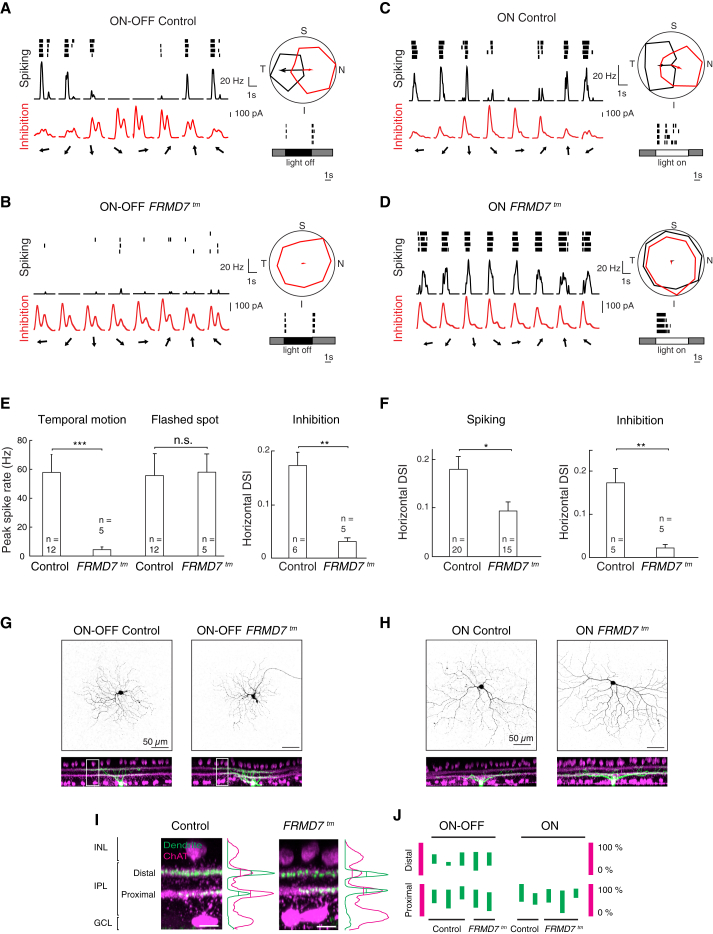
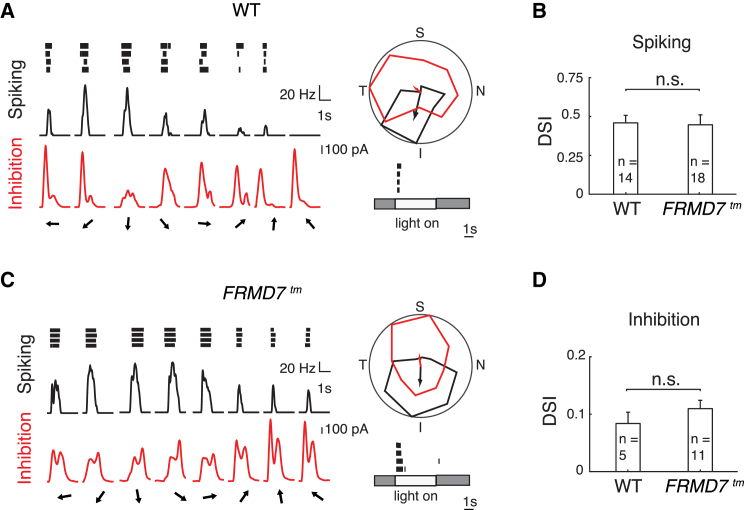
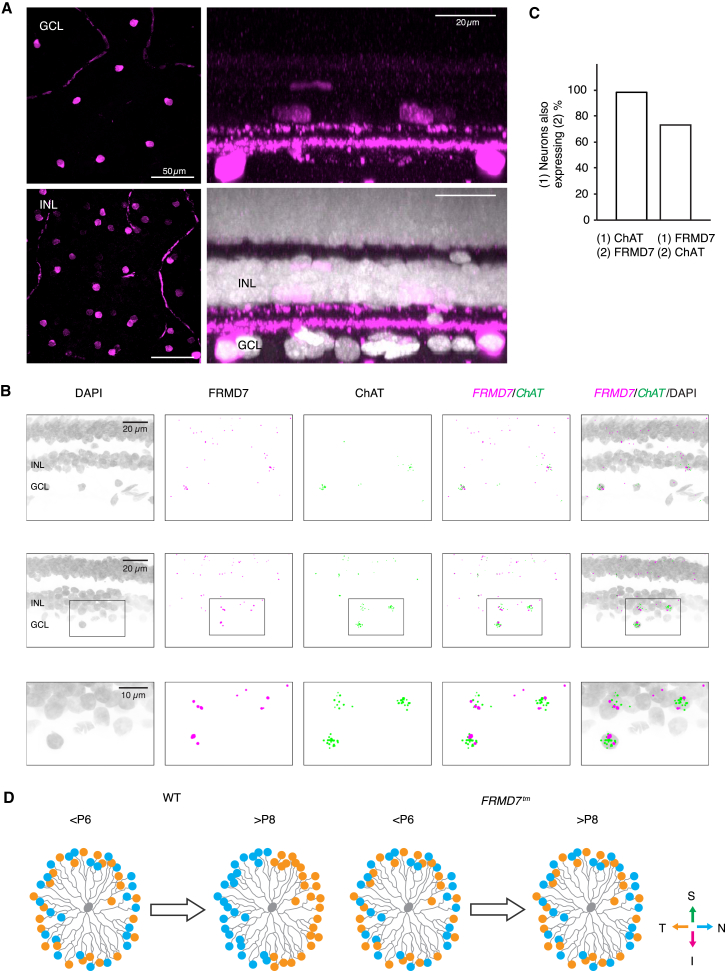
Neuronal circuit asymmetries are important components of brain circuits, but the molecular pathways leading to their establishment remain unknown. Here we found that the mutation of FRMD7, a gene that is defective in human congenital nystagmus, leads to the selective loss of the horizontal optokinetic reflex in mice, as it does in humans. This is accompanied by the selective loss of horizontal direction selectivity in retinal ganglion cells and the transition from asymmetric to symmetric inhibitory input to horizontal direction-selective ganglion cells. In wild-type retinas, we found FRMD7 specifically expressed in starburst amacrine cells, the interneuron type that provides asymmetric inhibition to direction-selective retinal ganglion cells. This work identifies FRMD7 as a key regulator in establishing a neuronal circuit asymmetry, and it suggests the involvement of a specific inhibitory neuron type in the pathophysiology of a neurological disease.


Figures

Figure 1
Figure 1
Horizontal Optokinetic Reflex Is Absent in FRMD7tm Mice and in Human Subjects with FRMD7 Mutation (A) Retinal cardinal axes are shown. (B) (Left) A schematic of a starburst cell showing the direction of centrifugal motion (red arrowheads) that evokes transmitter release. (Right) Spatial organization of synaptic connectivity between a starburst cell (center, black) and four types of DS cells, color coded according to their preferred directions (colored arrows), is shown. (C–E) Optokinetic reflex eye movements produced by wild-type (WT, left) and FRMD7tm (middle) mice in response to motion in the temporal (top), nasal (middle), and inferior (bottom) directions on the retina. Gray bars represent the motion stimulus and arrows colored according to the color code in (A) indicate the motion direction on the retina. The right column shows the quantification of optokinetic reflex eye-tracking movements per minute (ETMs, Supplemental Experimental Procedures) for WT and FRMD7tm mice in the three directions. Filled and open arrowheads indicate the slow phase and fast phase of eye movements, respectively. (F and G) Spontaneous eye movements in WT (F) and FRMD7tm (G) mice along horizontal axes. Open and filled arrows indicate eye movements to the left and right, respectively. (H–J) Optokinetic reflex in a control human subject (left) and a subject with FRMD7 mutation (middle) in response to motion in the temporal (top), nasal (middle), and inferior (bottom) directions on the retina. Gray bars represent the motion stimulus and arrows colored according to the color code in (A) indicate the motion direction on the retina. The right column shows the quantification of optokinetic reflex ETMs for control human subjects and for subjects with FRMD7 mutation in the three directions (Supplemental Experimental Procedures). Filled and open arrowheads indicate slow phase and fast phase of eye movements, respectively. (K–M) Voluntary pursuit movements in a human subject with FRMD7 mutation in response to the motion protocols as in (H)–(J). Data are shown as mean ± SEM; n refers to the number of animals in (C)–(E) and subjects in (H)–(J). See also Figures S1 and S2 and Movie S1.
Figure 2
Figure 2
Lack of Horizontal Direction Selectivity in the Retina of FRMD7tm Mice The figure shows data obtained with microelectrode arrays. In (A)–(E), the left two columns correspond to cells tuned to fast motion and the right two columns to cells tuned to slow motion (Supplemental Experimental Procedures). The radius of each circle corresponds to direction selectivity index (DSI) = 1. (A) Polar plots showing the preferred directions (direction of arrow) and DSI (length of an arrow) of individual DS cells (DSI > 0.5, each recorded DS cell is represented by an arrow) in WT and FRMD7tm retinas. The color code shows the different directions according to Figure 1A. (B) Contour plots showing the density of DS cells at different DSIs and preferred directions. Red indicates maximal density. (C) The proportions of horizontal (nasal and temporal) and vertical (superior and inferior) motion-preferring DS cells in WT and FRMD7tm retinas are shown. (D) Raster plots showing the spike responses (each black line is a spike) of example DS cells in WT and FRMD7tm retinas in response to motion in eight different directions, indicated by the arrows at the bottom of the plot. Responses to stimulus repetitions (n = 5) are shown in different rows. Large colored dots indicate the preferred directions of DS cells according to the color code in Figure 1A. (E) Polar plots of the normalized mean spike numbers of cells shown in (D). The preferred direction and DSI of each cell are shown by the direction and length of the corresponding (color-coded) arrow. (F) Distributions of the horizontal (top) and vertical (bottom) DSIs (Supplemental Experimental Procedures) of DS cells in WT (black) and FRMD7tm (red) retinas for fast (left) and slow (right) stimulus speeds are shown. See also Figures S3 and S4.
Figure 3
Figure 3
FRMD7 Is Specifically Expressed in Starburst Cells in the Mouse Retina (A) Confocal images of a mouse retinal section stained by double-label quantitative fluorescence in situ hybridization using antisense probes for mouse FRMD7 mRNA and mouse ChAT mRNA and DAPI. Bottom panels are magnifications of the insets in top panels. (B) Fluorescent dots per cell for FRMD7 mRNA (magenta) and ChAT mRNA (green) at different developmental stages are shown (see Figure S5A for images). (C) Quantification of hybridization signal for control sense probe is shown (see Figure S5B for images). (D) Confocal images show the inner nuclear layer (INL) and ganglion cell layer (GCL) of WT (left) and FRMD7tm (right) retinas stained with anti-ChAT antibody. (E) Quantification of the density of ChAT-positive cells from images, as given in (D), is shown. (F) Top view of confocal images of WT (left) and FRMD7tm (right) retinas stained with anti-ChAT antibody at the proximal (top) and distal (middle) ChAT-positive strata in the inner plexiform layer. Side view is shown at the bottom. (G) Confocal images show starburst cells sparsely labeled with GFP-expressing rabies virus in ChAT-Cre mice in control (left) and FRMD7tm (right) background. (H) Dendritic field size (left), dendritic asymmetry index (middle), and the number of primary processes (right) of GFP-labeled starburst cells quantified from images as shown in (G). Dendritic asymmetry index refers to the ratio of length of widest diameter to that of narrowest diameter of the dendritic arbor (%). (I) Confocal images of starburst cell processes at the proximal inner plexiform layer (IPL) sublayer labeled with synaptophysin-GFP-expressing AAV in ChAT-Cre mice in control (top) and FRMD7tm (bottom) background. Data are shown as mean ± SEM; n refers to the number of retinas in (E) and cells in (C) and (H). See also Figures S1 and S5.
Figure 4
Figure 4
Ganglion Cells in FRMD7tm Retinas with Genetic Identity of Horizontal Motion-Preferring DS Cells Lack Asymmetric Inhibitory Input (A–D) Examples of cell-attached and whole-cell voltage-clamp recordings of GFP-labeled on-off cells (A and B) and on cells (C and D) in Hoxd10-GFP (Control; A and C) and FRMD7tm;Hoxd10-GFP (FRMD7tm; B and D) retinas. (Left column) Spike raster plot (black, top), spike rate (black, middle), and inhibition (red, bottom) in response to motion stimulus are shown. Arrows indicate the direction of motion. (Right column top) Polar plot of normalized (to the maximum) spike number (black) and peak inhibition (red) during motion stimulation is shown. The vector sum of spiking (black) and inhibitory (red) responses are shown by arrows. The vector sum for spikes was only plotted if the cell responded to stimulation (Supplemental Experimental Procedures). (Right column bottom) Spike raster plot in response to a 300-μm flashed-spot stimulus centered onto the cell body is shown. Gray, white, and dark areas indicate the stimulus contrast. N, nasal; T, temporal; S, superior; I, inferior. (E) Quantification of spiking (left) and inhibitory (right) responses in on-off cells is shown. (F) Quantification of spiking (left) and inhibitory (right) responses in on cells. In (E) and (F), data points represent mean ± SEM; n refers to the number of recorded cells (Supplemental Experimental Procedures). (G and H) Confocal images of neurobiotin-filled, physiologically recorded on-off (G) and on (H) cells in top view (top) and side view (bottom). In side view, ChAT signals are shown (magenta) together with filled cells (green). (I) Magnification of insets in (G). Fluorescence intensity profile for filled dendrite (green) and ChAT (magenta) along retinal depth is shown at the right of the images. Vertical lines in the profiles indicate the full width at half maximum within the IPL. (J) Full width at half maximum of filled dendrites is shown as bars (green) relative to that of ChAT-positive proximal and distal strata (magenta). See also Figure S6.
Figure 5
Figure 5
Vertical Direction Selectivity and Asymmetric Inhibitory Input in MTN Back-Labeled Ganglion Cells in FRMD7tm Mice (A and C) Examples of cell-attached and whole-cell voltage-clamp recordings of MTN back-labeled ganglion cells in WT and FRMD7tm retinas. Spiking responses (black) and inhibitory currents (red) of vertically tuned on DS cells in WT (A) and FRMD7tm (C) retina are shown. (Left column) Spike raster plot (black, top), spike rate (black, middle), and inhibition (red, bottom) in response to motion stimulus are shown. Arrows indicate the direction of motion. (Right column top) Polar plot of normalized (to the maximum) spike number (black) and peak inhibition (red) during motion stimulation is shown. The vector sum of spiking (black) and inhibitory (red) responses are shown by arrows. (Right column bottom) Spike raster plot in response to a 300-μm flashed-spot stimulus centered on the cell body is shown. Gray and white areas indicate the stimulus contrast. (B and D) Bar graphs showing DSI of spiking (B) and inhibition (D) in MTN back-labeled ganglion cells in WT and FRMD7tm retinas. Data points represent mean ± SEM; n refers to the number of recorded cells. See also Figure S6.
Figure 6
Figure 6
Hoxd10-GFP-Labeled Retinal Ganglion Cell Axons Innervate Accessory Optic Nuclei in FRMD7tm Mice (A and B) Confocal images show DTN (top), NOT (middle), and MTN (bottom) innervated by GFP-labeled and cholera toxin subunit B-Alexa dye conjugate (CTB)-labeled retinal ganglion cell axons in control Hoxd10-GFP (A) and FRMD7tm;Hoxd10-GFP mice (B). (C) Schematic of central targets of Hox10-GFP-labeled retinal ganglion cell axons. Axons and targets are color coded according to their directional tuning. AOT-IF, inferior fasciculus of the accessory optic tract; AOT-SF, superior fasciculus of the accessory optic tract; MTNd, dorsal division of the MTN; MTNv, ventral division of the MTN; SC, superior colliculus; ON, optic nerve; OT, optic tract. Schematic adapted from Pak et al. (1987) and Dhande et al. (2013). See also Figure S7.
Figure 7
Figure 7
FRMD7 Is Symmetrically Localized within Starburst Amacrine Cell Processes (A and B) Confocal images show WT retinas stained with antibody for ChAT (green) and FRMD7 (magenta) at different developmental time points (P3, P5, and P7) in side view (A) and top view of z stack of labeled cells in GCL (B). (C) Quantification of the subcellular distribution of FRDM7 within starburst cells. (Left) The direction of FRMD7-labeled processes was defined by the angle of the vector, which points from the cell body center (green dot) to the exit point of the primary processes from cell body (cyan dots). (Right) Distribution of the direction of FRMD7-labeled processes is shown.
Figure 8
Figure 8
FRMD7 Is Expressed in ChAT-Labeled Cells in the Retina of Non-human Primates (A) Confocal images show whole-mount non-human primate retinas stained with antibody for ChAT (magenta) and DAPI (white) in top view (left) and side view (right). (B) Confocal images of retinal sections stained by double-label fluorescence in situ hybridization using antisense probes for FRMD7 mRNA and ChAT mRNA as well as DAPI in non-human primate retinas. Two example regions (top and middle) and magnification of inset in middle panels (bottom) are shown. (C) Relationship between FRMD7 mRNA-expressing and ChAT mRNA-expressing cells is shown. (D) Schematic of the development of horizontal asymmetric inhibitory outputs of a starburst cell (gray, center) in WT (left) and FRMD7tm mice (right) during the postnatal period before eye opening. Output inhibitory synapses are color coded according to the preferred directions (colored arrows) of the postsynaptic DS cell partner. Symmetric inhibitory connectivity established during the first postnatal week is reorganized into asymmetric inhibitory connectivity during the second postnatal week in WT mice (Wei et al., 2011, Yonehara et al., 2011), but not in FRMD7tm mice.

Similar articles

Cited by

References

    1. Borst A., Euler T. Seeing things in motion: models, circuits, and mechanisms. Neuron. 2011;71:974–994. - PubMed
    1. Borst A., Helmstaedter M. Common circuit design in fly and mammalian motion vision. Nat. Neurosci. 2015;18:1067–1076. - PubMed
    1. Briggman K.L., Helmstaedter M., Denk W. Wiring specificity in the direction-selectivity circuit of the retina. Nature. 2011;471:183–188. - PubMed
    1. Bryan A.S., Angelaki D.E. Optokinetic and vestibular responsiveness in the macaque rostral vestibular and fastigial nuclei. J. Neurophysiol. 2009;101:714–720. - PMC - PubMed
    1. Dhande O.S., Estevez M.E., Quattrochi L.E., El-Danaf R.N., Nguyen P.L., Berson D.M., Huberman A.D. Genetic dissection of retinal inputs to brainstem nuclei controlling image stabilization. J. Neurosci. 2013;33:17797–17813. - PMC - PubMed

Publication types

MeSH terms