

TBC1D14 regulates autophagy via the TRAPP complex and ATG9 traffic
- PMID: 26711178
- PMCID: PMC4741301
- DOI: 10.15252/embj.201592695
TBC1D14 regulates autophagy via the TRAPP complex and ATG9 traffic
Abstract
Macroautophagy requires membrane trafficking and remodelling to form the autophagosome and deliver its contents to lysosomes for degradation. We have previously identified the TBC domain-containing protein, TBC1D14, as a negative regulator of autophagy that controls delivery of membranes from RAB11-positive recycling endosomes to forming autophagosomes. In this study, we identify the TRAPP complex, a multi-subunit tethering complex and GEF for RAB1, as an interactor of TBC1D14. TBC1D14 binds to the TRAPP complex via an N-terminal 103 amino acid region, and overexpression of this region inhibits both autophagy and secretory traffic. TRAPPC8, the mammalian orthologue of a yeast autophagy-specific TRAPP subunit, forms part of a mammalian TRAPPIII-like complex and both this complex and TBC1D14 are needed for RAB1 activation. TRAPPC8 modulates autophagy and secretory trafficking and is required for TBC1D14 to bind TRAPPIII. Importantly, TBC1D14 and TRAPPIII regulate ATG9 trafficking independently of ULK1. We propose a model whereby TBC1D14 and TRAPPIII regulate a constitutive trafficking step from peripheral recycling endosomes to the early Golgi, maintaining the cycling pool of ATG9 required for initiation of autophagy.
Keywords: Autophagy; Membrane Trafficking; Rab proteins; TRAPP.
© 2015 The Authors. Published under the terms of the CC BY 4.0 license.
Figures
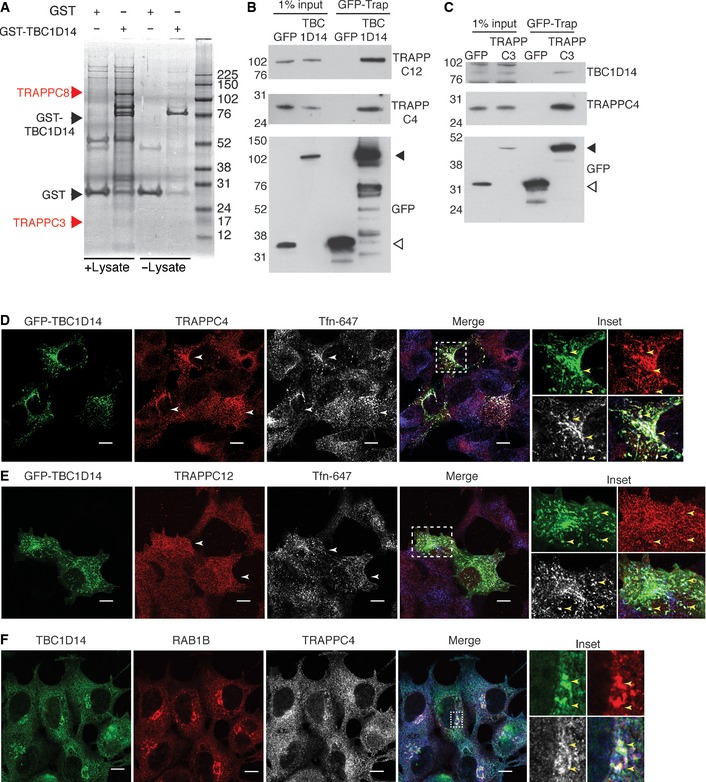
GST pulldown used to analyse TBC1D14 interactors. Recombinant GST or GST‐TBC1D14 was incubated with or without HEK293A lysate. Bound proteins were eluted from the beads using Laemmli sample buffer and subjected to SDS–PAGE, with visible bands being excised from the gel and analysed by mass spectrometry.
Lysates of HEK293A cells expressing either GFP or GFP‐TBC1D14 were subjected to immunoprecipitation (IP) with GFP‐Trap and then immunoblotted for GFP, TRAPPC12 and TRAPPC4. White arrowhead indicates GFP, black arrowhead indicates GFP‐TBC1D14.
Lysates of cells expressing GFP or GFP‐TRAPPC3 were subjected to IP with GFP‐Trap and then immunoblotted for TRAPPC4, GFP and TBC1D14. White arrowhead indicates GFP, black arrowhead indicates GFP‐TRAPPC3.
Cells expressing GFP‐TBC1D14, generating a tubulated endosomal compartment, were fed Alexa‐647‐labelled transferrin (white, blue in merge) for 15 min in full medium, fixed, stained for endogenous TRAPPC4 (red) and analysed by confocal microscopy.
Cells treated as in (D) were stained for endogenous TRAPPC12 (red) and analysed by confocal microscopy.
Cells in complete medium were fixed, stained for endogenous TBC1D14 (green), RAB1B (red) and TRAPPC4 (white, blue in merge) and analysed by confocal microscopy. Inset shows protein localisation in juxtanuclear area.
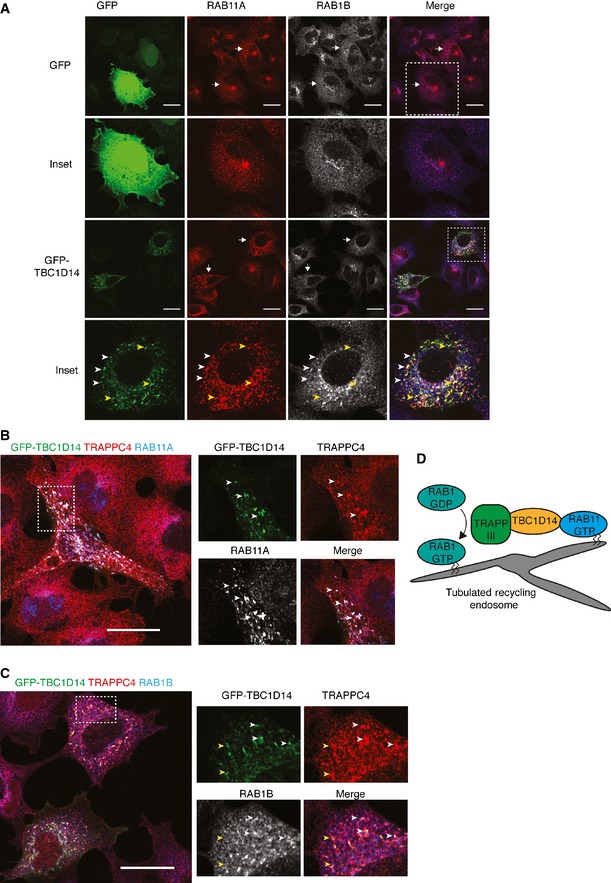
HEK293A cells transfected with GFP (upper panels) or GFP‐TBC1D14 (lower panels) (green) were labelled with anti‐RAB11A (red) and anti‐RAB1B (white, blue in merge) antibodies. White arrows depict transfected cells. Inset: GFP‐TBC1D14‐transfected cell showing triple co‐localisation between GFP‐TBC1D14, RAB11A and RAB1B (white arrow heads) and double co‐localisation between GFP‐TBC1D14 and RAB11A (yellow arrowheads).
Co‐localisation of GFP‐TBC1D14, TRAPPC4 (red) and RAB11A (white, blue in merge). White arrowheads indicate regions of triple co‐localisation.
Co‐localisation of GFP‐TBC1D14, TRAPPC4 (red) and RAB1B (white, blue in merge). White arrowheads indicate regions of triple co‐localisation and yellow arrowheads regions of double co‐localisation between GFP‐TBC1D14 and TRAPPC4.
Model for recruitment of RAB1 to tubulated RE. RAB11‐GTP recruits TBC1D14 to the ERC membrane, and TBC1D14 in turn recruits TRAPP. TRAPP acts as a GEF to recruit RAB1 aberrantly to ERC membranes.
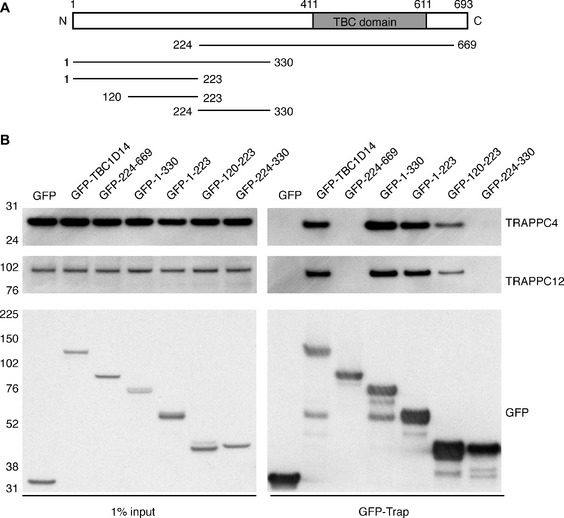
Schematic diagram of full‐length TBC1D14, indicating the C‐terminal TBC domain (shaded), and truncation mutants used in subsequent analyses.
HEK293A cell lysates (from approximately 8 × 10⁶ cells per construct) expressing the indicated GFP fusions were subjected to IP and immunoblotting for GFP, TRAPPC12 and TRAPPC4. Data are representative of 3 independent experiments.
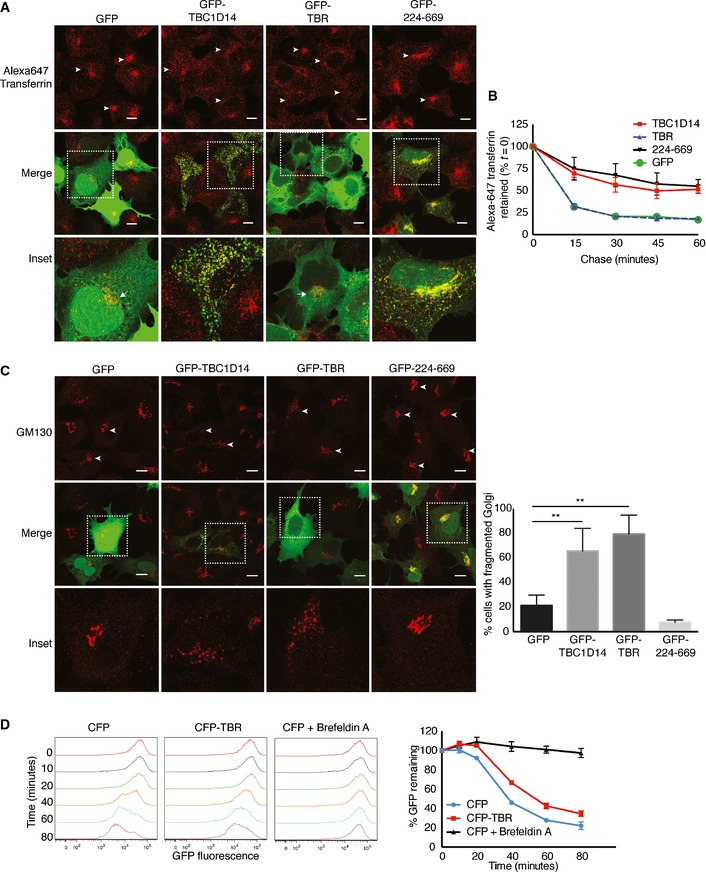
Cells expressing the indicated GFP fusions (green) were loaded with Alexa‐647 transferrin (red; white arrowheads indicate transfected cells) for 15 min, fixed and the morphology of the transferrin‐positive recycling endosomes analysed by confocal microscopy. Scale bars, 10 μm. Arrows in inset indicate the juxtanuclear ERC.
Cells transfected as in (A) were loaded with Alexa‐647 transferrin for 15 min and the fluorescent transferrin chased out for the indicated time periods. At the end of the time course, the cells were fixed and the transferrin content of GFP‐positive cells analysed by flow cytometry. Results are expressed as a percentage of Tfn fluorescence at t = 0 and are the mean of 3 independent experiments, ± s.e.m.
Cells transfected as in (A) were stained for the cis‐Golgi marker GM130. White arrowheads depict transfected cells. Scale bars, 10 μm. Bar chart is quantification of fragmented Golgi complex (> 100 cells per condition from three independent experiments, ± s.e.m. **P < 0.01, one‐way ANOVA with Sidak's post‐test).
HeLa C1 cells transfected with CFP or CFP‐TBR were treated with D/D solubiliser (Clontech) or D/D solubiliser plus 2.5 μg/ml Brefeldin A (BFA) for the indicated time periods, trypsinised, fixed and their GFP content analysed by flow cytometry. Results are expressed as percentage of GFP levels at t = 0, and the mean of 3 independent experiments ± s.e.m. is shown.
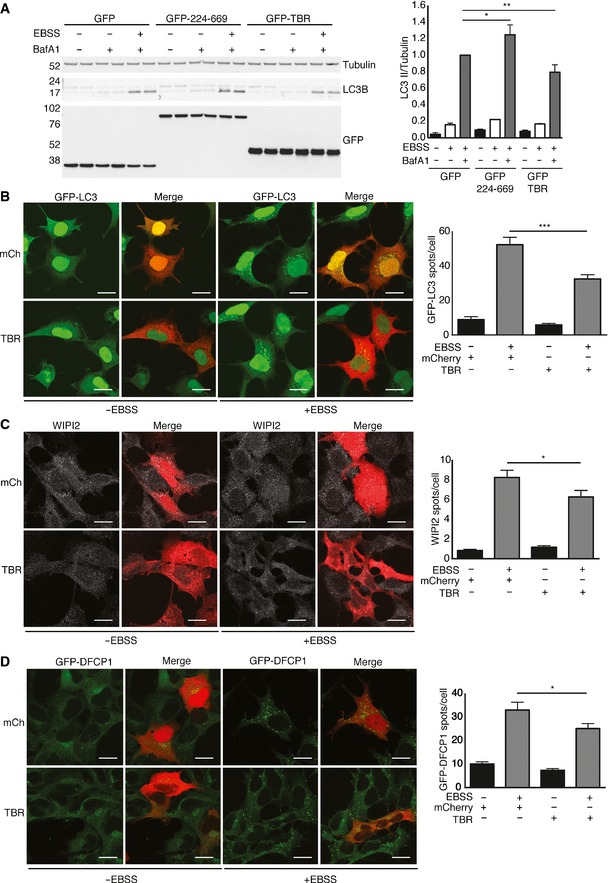
HEK293A cells expressing GFP, GFP‐TBC1D14 224–669 or GFP‐TBR were treated in duplicate with EBSS, EBSS plus 100 nM BafA1 or not for 2 h, lysed and subjected to immunoblotting for LC3B, tubulin and GFP. The amount of LC3B/tubulin for each condition from three independent experiments is shown on the bar graph, ± s.e.m. *P < 0.05, **P < 0.01, one‐way ANOVA with Sidak's multiple comparison test.
HEK293A GFP‐LC3B (2GL9) cells were transfected with mCherry or mCherry‐TBR, treated with EBSS for 2 h, fixed and analysed by confocal microscopy.
HEK293A cells were treated as in (B), fixed, stained for WIPI2 and analysed by confocal microscopy.
HEK293A cells stably expressing GFP‐DFCP1 were treated as in (B), fixed and analysed by confocal microscopy.
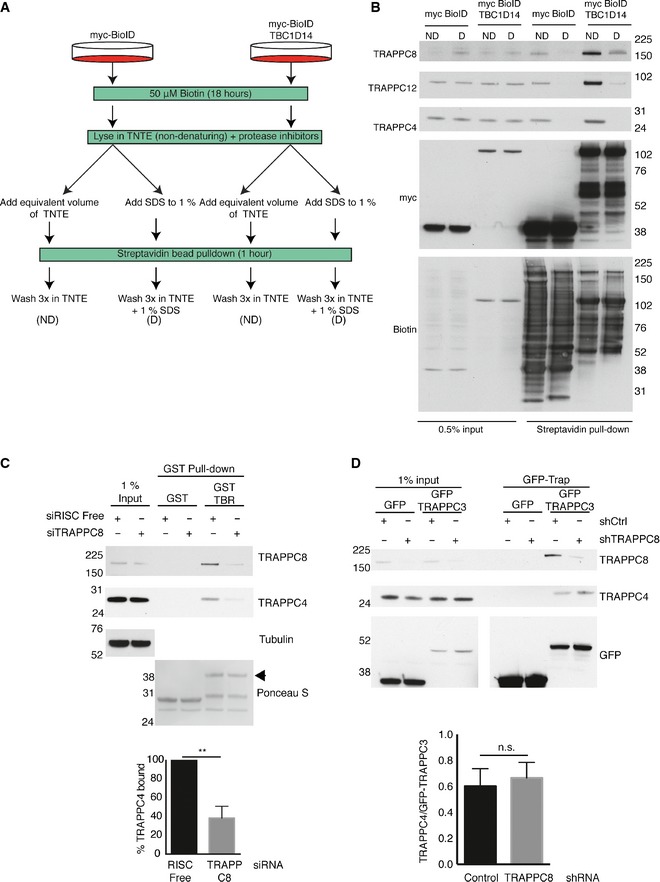
Overview of BioID technique used to determine TRAPP subunit most proximal to TBC1D14. D = denaturing conditions, ND = non‐denaturing conditions.
Samples prepared according to (A) (8 × 10⁷ HEK293A cells per transfection) were lysed in TNTE, split equally and denatured with 1% SDS (D) or not (ND) and subjected to 1‐h streptavidin resin pulldown at room temperature. The bound proteins were eluted in 2× Laemmli sample buffer plus 3 mM Biotin and immunoblotted for the indicated proteins.
siRNA‐transfected control cells (RISC free) or TRAPPC8 knockdown cells (TRAPPC8) were lysed in TNTE and used in pulldown assays with immobilised recombinant GST or GST‐TBR. Bound proteins were subjected to immunoblot analysis using TRAPPC8, TRAPPC4 and tubulin antibodies. Ponceau staining was used to verify loading of the GST fusion proteins (GST‐TBR indicated with arrowhead). The bar chart expresses the relative amount of TRAPPC4 isolated from siTRAPPC8 compared to siRISC‐free control cells from three independent experiments, and error bars are ± s.e.m. **P < 0.01, unpaired t‐test.
HEK293T cells stably depleted of TRAPPC8 (shC8) or not (shCtrl) were transfected with constructs encoding GFP or GFP‐TRAPPC3 and subjected to GFP‐Trap IP. Precipitated proteins were immunoblotted for GFP, TRAPPC4 and TRAPPC8. Bar chart: the amount of TRAPPC4 isolated was normalised to the amount of GFP‐TRAPPC3 precipitated from three independent experiments and plotted ± s.e.m., ns = non‐significant, unpaired t‐test.

Scatterplot of log10‐transformed iBAQ values for myc‐BioID versus myc‐BioID‐TBC1D14 non‐denaturing pulldowns analysed by mass spectrometry.
Scatterplot of log10‐transformed iBAQ values for myc‐BioID‐TBC1D14 denaturing versus myc‐BioID‐TBC1D14 non‐denaturing pulldowns analysed by mass spectrometry.
HEK293A cells (1 × 10 cm plate per condition) were lysed in 400 µl TNTE and subjected to immunoprecipitation with mouse anti‐TRAPPC12/TTC15 or mouse anti‐GFP bound to protein G‐Sepharose. The bound proteins were immunoblotted for TRAPPC8 and TRAPPC12.
TRAPPC8, TRAPPC12 and the core subunit TRAPPC4 co‐elute in a complex of approximately 600 kDa. Blots are representative of three independent experiments. Approximate elution profiles of molecular weight standards are indicated above the fractions.
TBC1D14 overexpression does not promote GTP binding to RAB1B. Bar chart is quantification of the percentage of RAB1B precipitated (normalised to GFP‐Golgin‐84) upon myc‐TBC1D14 overexpression compared to empty vector expression from three independent experiments. n.s. = not significant, unpaired t‐test.
Lysates of HEK293A cells expressing GFP‐Golgin‐84 and transfected with RISC‐free control siRNA or siRNA targeting TBC1D14, TRAPPC8 or RAB1B were subjected to GFP‐Trap IP as in (E) and immunoblotted for RAB1B, TBC1D14, TRAPPC8, TRAPPC4 and GFP. Bar chart is quantification of the percentage of RAB1B precipitated (normalised to GFP‐Golgin‐84) upon myc‐TBC1D14 overexpression compared to RISC‐free siRNA from three independent experiments. **P < 0.01, ***P < 0.001, one‐way ANOVA followed by Sidak's multiple comparison test.
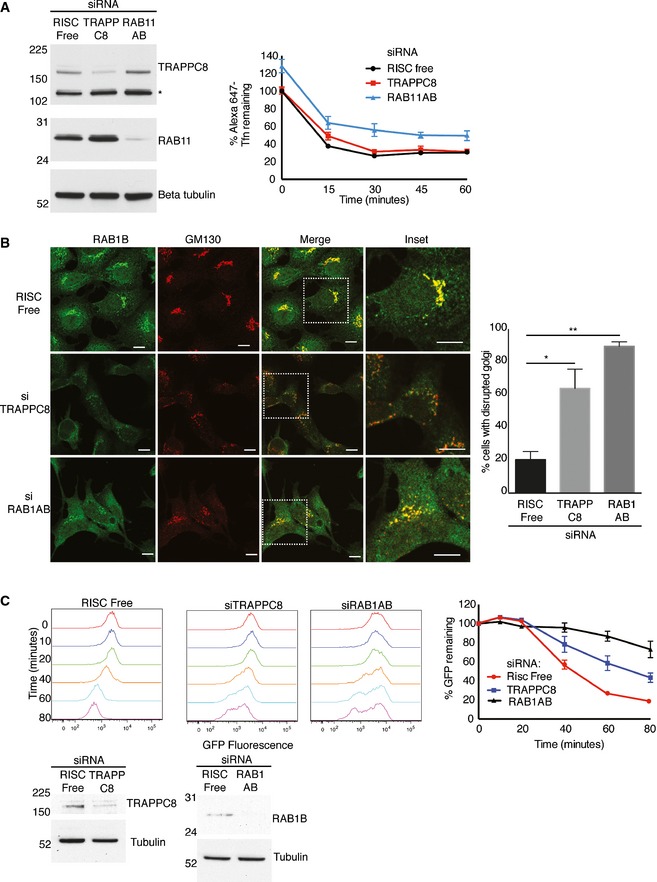
HEK293A cells transiently transfected with RISC‐free control siRNA or siRNA duplexes directed against TRAPPC8 and RAB11A and B (knockdown confirmed by immunoblot analysis) were fed with Alexa‐647 transferrin for 15 min in full medium, and the fluorescent transferrin chased out for the indicated time periods. At the end of the time course, cells were trypsinised, fixed and the Alexa‐647 fluorescence analysed by flow cytometry. Results are plotted as percentage of transferrin fluorescence at t = 0 for the RISC‐free control cells, expressed as the mean of three independent experiments ± s.e.m.
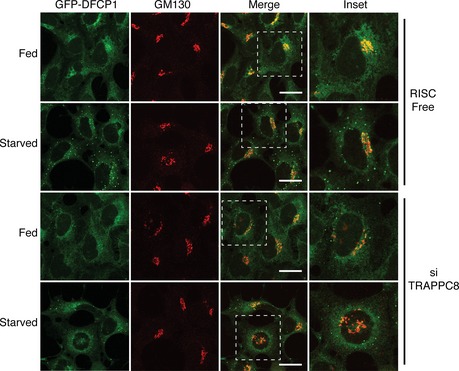
Cells transiently transfected with RISC‐free control siRNA, or siRNA duplexes directed against TRAPPC8 or RAB1A and B were stained for the cis‐Golgi markers GM130 or RAB1B and analysed by confocal microscopy. Scale bars, 20 μm in main panels, 10 μm in inset panels. Bar graph: > 100 cells per siRNA were scored for fragmented or normal juxtanuclear Golgi stacks from three independent experiments. Error bars ± s.e.m., *P < 0.05, **P < 0.01, one‐way ANOVA with Sidak's multiple comparison test.
HeLa C1 cells transiently transfected with RISC‐free control siRNA or siRNA duplexes directed against TRAPPC8 or RAB1A and B (knockdown confirmed by immunoblot analysis) were treated with D/D solubiliser for the indicated time periods, trypsinised, fixed and their GFP content analysed by flow cytometry. The line graph shows the GFP fluorescence as a percentage of t = 0, ± s.e.m. from three independent experiments.
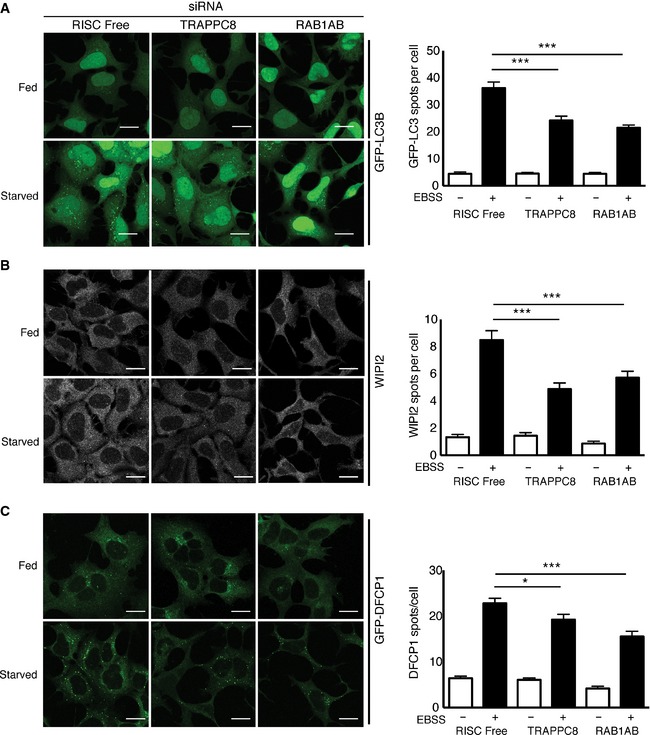
HEK293A cells stably expressing GFP‐LC3B (green) were transiently transfected with RISC‐free control siRNA or siRNA duplexes targeting TRAPPC8 or RAB1A and B then treated with EBSS (starved) or not (fed), fixed and analysed by confocal microscopy.
HEK293A cells were transiently transfected with RISC‐free control siRNA or siRNA duplexes targeting TRAPPC8 or RAB1A and B then treated with EBSS (starved) or not (fed), fixed, stained for WIPI2 (white) and analysed by confocal microscopy.
HEK293A cells stably expressing GFP‐DFCP1 (green) were transiently transfected with RISC‐free control siRNA or siRNA duplexes targeting TRAPPC8 or RAB1A and B then treated with EBSS (starved) or not (fed), fixed and analysed by confocal microscopy.
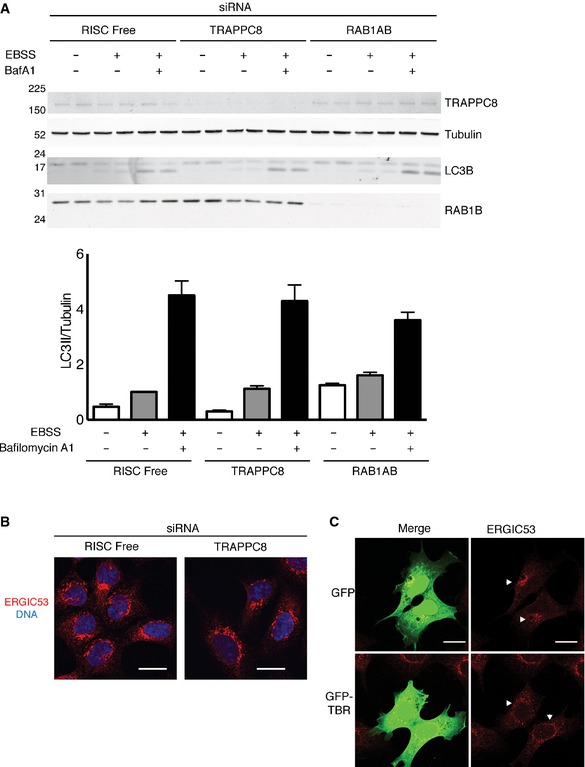
HEK293A cells transiently transfected with control RISC‐free control siRNA or siRNA duplexes directed against TRAPPC8 or RAB1AB were treated with EBSS, EBSS + 100 nM bafilomycin A1 or not for 2 h, lysed and subjected to immunoblotting for LC3B, tubulin, TRAPPC8 and RAB1B. The amount of LC3B/tubulin for each condition from three independent experiments is shown in the bar graph, ± s.e.m.
Cells depleted for TRAPPC8 or not (RISC free) were immunostained for ERGIC53 (red) and Hoechst (DNA; blue). Scale bars, 20 μm.
Cells expressing GFP or GFP‐TBR (green) were immunostained for ERGIC53 (red; arrowheads indicate transfected cells) and analysed by confocal microscopy. Scale bars, 20 μm.
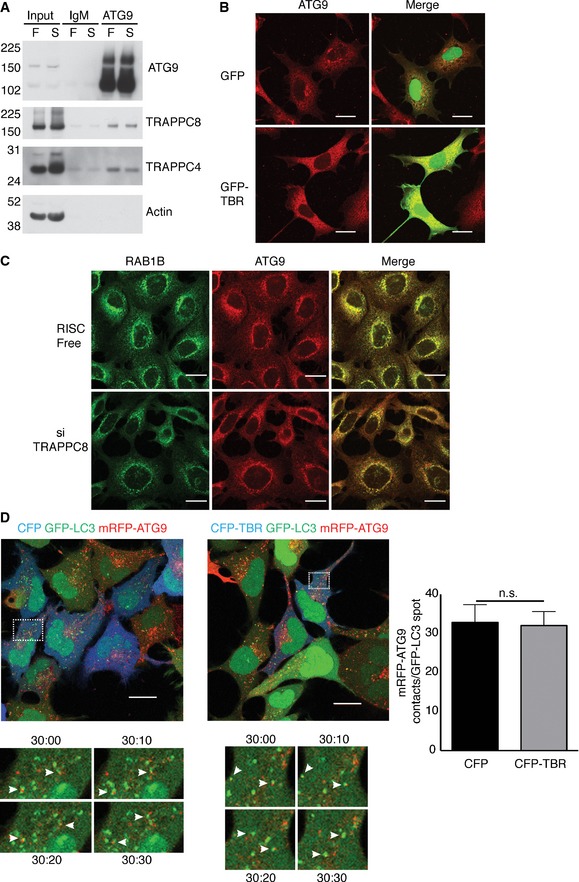
ATG9‐positive membranes were immunoisolated from approximately 2 × 10⁷ fed (F) or starved (S) HEK293A cells using a monoclonal hamster anti‐ATG9 (ATG9) or control hamster IgM and immunoblotted for ATG9 using a rabbit polyclonal antibody, TRAPPC8, TRAPPC4 and actin.
HEK293A cells transfected with GFP or GFP‐TBR (green) were stained for ATG9 using hamster anti‐ATG9 (red) and analysed by confocal microscopy. Scale bars, 20 μm.
HEK293A cells transiently transfected with RISC‐free siRNA or siRNA against TRAPPC8 were stained for RAB1B (green) and ATG9 using hamster anti‐ATG9 (red) and imaged using confocal microscopy. Scale bars, 20 μm.
Stills at t = 30 min from time lapse imaging of 9B9 cells (stably expressing GFP‐LC3 and mRFP‐ATG9) expressing either CFP or CFP‐TBR (blue). Scale bars, 20 μm. Inset panels show mRFP‐ATG9 and GFP‐LC3 contact events at the indicated time points; arrowheads indicate contact events. Bar chart shows number of times a GFP‐LC3 spot was within 1 μm of an mRFP‐ATG9 spot (a contact event), expressed as total mRFP‐ATG9 contacts per GFP‐LC3 spot ± s.e.m., n = 18 cells per condition pooled from 4 independent experiments.
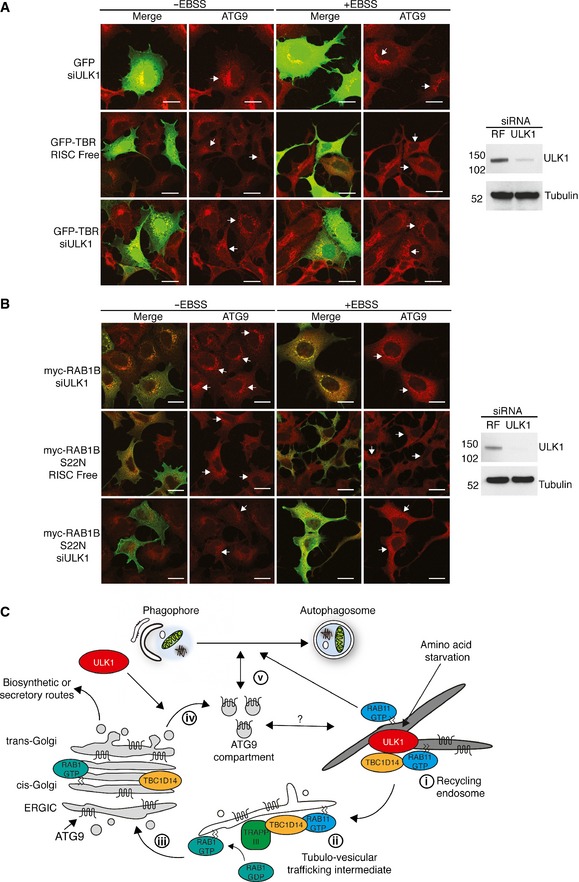
Cells depleted of ULK1 (siULK1) or not (RISC free) were transfected with GFP or GFP‐TBR (green), starved (EBSS) or not (−EBSS) and stained for ATG9 using hamster anti‐ATG9 (red). Arrows indicate transfected cells. Western blot indicates ULK1 knockdown. Scale bars, 20 μm.
Cells depleted of ULK1 (siULK1) or not (RISC free) were transfected with myc‐RAB1B or myc‐RAB1B (S22N) (green), starved (EBSS) or not (−EBSS) and stained for ATG9 using hamster anti‐ATG9 (red). Arrows indicate transfected cells. Western blot indicates ULK1 knockdown. Scale bars, 20 μm.
Model for the role of TBC1D14 and the TRAPP complex in mammalian autophagy and ATG9 traffic. Recycling endosomes harbour a population of TBC1D14 bound to RAB11, and a population of ATG9 molecules which may traffic to and from the ATG9 compartment. (i) Upon amino acid starvation, TBC1D14 and RAB11 induce a vesicle trafficking step from RAB11‐ to RAB1‐positive membranes at a tubulo‐vesicular transport intermediate (ii). This results in recycling of ATG9 to RAB1‐regulated Golgi compartments (iii) from where ATG9 can be trafficked to the ATG9 compartment in an ULK1‐dependent manner (iv). This maintains the ATG9 compartment under starvation, which can then both contribute to, and promote autophagosome formation from other membrane sources, including the RAB11‐positive recycling endosome (v).
References
-
- Barrowman J, Bhandari D, Reinisch K, Ferro‐Novick S (2010) TRAPP complexes in membrane traffic: convergence through a common Rab. Nat Rev Mol Cell Biol 11: 759–763 - PubMed
Publication types
MeSH terms
Substances
Grants and funding
LinkOut - more resources
Full Text Sources
Other Literature Sources
Molecular Biology Databases
