. 2016 Feb 16;36(5):765-80.
doi: 10.1128/MCB.00843-15. Epub 2015 Dec 28.

Requirement of Phosphoinositides Containing Stearic Acid To Control Cell Polarity

Affiliations

Requirement of Phosphoinositides Containing Stearic Acid To Control Cell Polarity

François Doignon et al. Mol Cell Biol. .

Abstract

Phosphoinositides (PIPs) are present in very small amounts but are essential for cell signaling, morphogenesis, and polarity. By mass spectrometry, we demonstrated that some PIPs with stearic acyl chains were strongly disturbed in a psi1Δ Saccharomyces cerevisiae yeast strain deficient in the specific incorporation of a stearoyl chain at the sn-1 position of phosphatidylinositol. The absence of PIPs containing stearic acid induced disturbances in intracellular trafficking, although the total amount of PIPs was not diminished. Changes in PIPs also induced alterations in the budding pattern and defects in actin cytoskeleton organization (cables and patches). Moreover, when the PSI1 gene was impaired, a high proportion of cells with bipolar cortical actin patches that occurred concomitantly with the bipolar localization of Cdc42p was specifically found among diploid cells. This bipolar cortical actin phenotype, never previously described, was also detected in a bud9Δ/bud9Δ strain. Very interestingly, overexpression of PSI1 reversed this phenotype.


Figures

FIG 1
FIG 1
Effect of PSI1 deficiency on the molecular fatty acid composition of PI (A), PIP (B), and PIP2 (C) and on the total PIP amount (D). (A to C) Cells were cultured in YPD medium at 30°C up to early log phase and harvested, and lipids were extracted and quantified by RP-LC-MS/MS. Closed bars, strain BY4742; open bars, psi1Δ mutant. Data are means from triplicate measurements. *, P < 0.05; **, P < 0.01; ***, P < 0.001. An unpaired, two-tailed t test was used for statistical analysis. (D) Determination of PIP and PIP2 amounts by [14C]acetate steady-state lipid labeling as described in Materials and Methods (n = 7 experiments for PIP quantification and n = 6 experiments for PIP2 quantification).
FIG 2
FIG 2
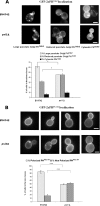
PI(4)P and PI(4,5)P2 biosensors reveal that the PIP distribution is affected by a lack of PI 18:0. Cells expressing GFP-2×PHOsh2 (A) or GFP-2×PHPLCδ1 (B) biosensors were cultured at 30°C to an OD600 of 0.5 in SC medium without uracil. Fluorescence localization was monitored, and cells were scored and placed into different categories for GFP-2×PHOsh2 or GFP-2×PHPLCδ1. *, P < 0.05; ***, P < 0.001. An unpaired, two-tailed t test was used for statistical analysis (n > 300 cells, three experiments). Bars, 5 μm.
FIG 3
FIG 3
The budding pattern of haploid and diploid cells is disturbed when PSI1 is deleted. Cells were grown in YPD at 30°C and harvested in mid-log phase, and bud scars were stained using calcofluor white. Haploid (A) and diploid (B) cells were scored and placed into different categories. Bars, 5 μm.
FIG 4
FIG 4
Polarization of the actin cytoskeleton is impaired in haploid and diploid strains from which the PSI1 gene was deleted. Cells were cultured in YPD at 30°C, harvested at an OD600 of 0.5, fixed, and stained with Alexa Fluor 568-phalloidin as described in Materials and Methods. (A, B) Haploid cells with a small or medium-size bud were observed by fluorescence microscopy and then were classified (A) and quantified (B) according to their polarization state. (C, D) Similar observations were established with diploid cells. Cells that had actin patches concentrated in the small bud and whose mother cell had less than four patches were classified as polarized cells. Cells that had actin patches concentrated in the small bud but whose mother cell had more than four patches were classified as partially depolarized cells. Cells whose mother cell had more actin patches than the small bud or whose mother cells had numbers of actin patches equivalent to the numbers in the small bud were classified as totally depolarized cells. Comparisons for each category between the WT and the psi1Δ mutant were done using unpaired, two-tailed t tests, which showed a P value of <0.05 (n > 300 cells, three experiments). Bars, 5 μm.
FIG 5
FIG 5
Bipolar organization of actin cortical patches and Cdc42p in diploid early-budding cells from which PSI1 was deleted. Diploid cells were cultured in YPD at 30°C, harvested at an OD600 of 0.5, and stained with Alexa Fluor 568-phalloidin before analysis by fluorescence microscopy. (A, B) Monopolarized or bipolarized actin cortical patches in diploid cells were visualized among cells with small buds (A) and scored (B). Diploid cells expressing GFP-Cdc42p were grown to mid-log phase in SC medium without uracil and methionine at 30°C and analyzed by fluorescence microscopy. (C, D) WT and psi1Δ/psi1Δ cells were analyzed (C) and scored (D). Comparisons for each category between the WT and psi1Δ mutant were done using unpaired, two-tailed t tests. *, P < 0.05; **, P < 0.01 (n > 300 cells, three experiments). Bars, 1 μm.
FIG 6
FIG 6
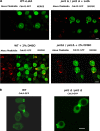
Bipolar actin structures are sensitive to latrunculin A, and the septin ring morphology is unmodified in psi1Δ/psi1Δ cells. (A) Diploid cells from which PSI1 was deleted and control cells were cultured in SC medium without uracil and methionine at 30°C and harvested at an OD600 of 0.5. One aliquot was incubated with 100 μM LatA in 2% dimethyl sulfoxide (DMSO) for 30 min, fixed, and stained with Alexa Fluor 568-phalloidin, and the other aliquot was incubated in the presence of 2% DMSO before staining. Red, actin patches; green, GFP-Cdc42p. (B) Diploid cells from which PSI1 was deleted and control cells were cultured in YPD at 30°C and harvested at mid-log phase, and then Cdc3-GFP septin localization was observed by fluorescence microscopy. Bars, 4 μm.
FIG 7
FIG 7
The Abp1 protein binds all actin patches in psi1Δ/psi1Δ cells. Diploid cells from which PSI1 was deleted and control cells were cultured in SC medium without uracil at 30°C, harvested at an OD600 of 0.5, fixed, and stained with Alexa Fluor 568-phalloidin. Red, actin patches; green, Abp1-3×GFP. Abp1p colocalized with bipolar actin patches in the psi1Δ/psi1Δ mutant. Arrows, monopolar and bipolar actin patches in the WT and mutants, respectively. Bar, 3 μm.
FIG 8
FIG 8
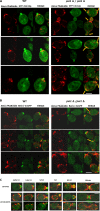
Colocalization of the bipolar actin patch with Cdc42p but not with the scaffold protein Bem1p in psi1Δ/psi1Δ mutants. (A) GFP-Cdc42p was detected at the two cellular poles in psi1Δ/psi1Δ mutants. Diploid cells from which PSI1 was deleted and control cells transformed with pRS416-ProMET-GFP-CDC42 were cultured in SC medium without uracil and methionine at 30°C to express GFP-Cdc42p, harvested at an OD600 of 0.5, fixed, and stained with Alexa Fluor 568-phalloidin. Red, actin patches; green, GFP-Cdc42p; arrows, bipolar actin patches and Cdc42p colocalization in the mutant. Bar, 4 μm. (B) The scaffold protein Bem1 was localized at only one cellular pole. Diploid cells from which PSI1 was deleted and WT cells expressing BEM1::BEM1-3×GFP (URA3) were cultured in SC medium without uracil at 30°C, harvested at an OD600 of 0.5, fixed, and stained with Alexa Fluor 568-phalloidin. Red, actin patches; green, Bem1-3×GFP; arrows, Bem1p in the bud of cells showing bipolar actin patches in the mutant. Bar, 3 μm. (C) The scaffold protein Bem1 was localized at only one cellular pole in polarized WT cells (top) and mutant cells (middle), whereas it was diffused throughout the cytosol of depolarized mutant cells (bottom). Diploid mutant and control cells expressing BEM1::BEM1-3×GFP were analyzed at each step of the cell cycle, as described at the top of each column. Bars, 4 μm.
FIG 9
FIG 9
Bipolar actin structures are displayed only in diploid virgin daughter cells budding at the distal pole in the psi1Δ/psi1Δ and bud9Δ/bud9Δ mutants, and PSI1 overexpression suppresses this phenotype. (A) Cells were grown to log phase in YPD at 30°C, labeled with concanavalin A-FITC (birth scars), fixed, and stained with Alexa Fluor 568-phalloidin (actin) and, finally, with calcofluor white (bud scars), as described in Materials and Methods. Arrows, some cells with bipolar actin patches. Bars, 4 μm. (B) Cells were grown to an OD600 of 0.15 in SC medium without uracil at 30°C, shifted to YPD, grown to an OD600 of 0.6 (the rate of plasmid loss was quantified to range from 1.4% up to 3.7% per generation), and then fixed and stained with Alexa Fluor 568-phalloidin. Diploid cells with bipolarized actin cortical patches were visualized and scored among cells with small buds. *, P < 0.05; **, P < 0.01. Unpaired, two-tailed t tests were used for statistical analysis (n > 750 cells, three experiments).
FIG 10
FIG 10
The molecular species of PI containing stearic acid are affected in the bud9Δ/bud9Δ mutant, and PSI1 overexpression can restore the bulk of these molecular species of PI. Cells were cultured in SC medium without uracil at 30°C to early log phase and harvested, and lipids were extracted and quantified by RP-LC-MS/MS. Data are means of triplicate measurements. *, P < 0.05; **, P < 0.01; ***, P < 0.001. Unpaired, two-tailed t tests were used for statistical analysis.
FIG 11
FIG 11
Defects in actin cable morphology for haploid and diploid strains deficient in PSI1. Cells were grown to log phase in YPD at 30°C, fixed, and stained with Alexa Fluor 568-phalloidin. Arrows, some of the bent cables in mutants with a PSI1 deletion. Bars, 5 μm.
FIG 12
FIG 12
The distribution of the GFP-Sec4p exocytosis marker is impaired in the psi1Δ strain. psi1Δ, bni1Δ, bnr1Δ, and WT strains producing GFP-Sec4p were cultured in SC medium without uracil and methionine at 30°C to a cell density consisting of an OD600 of 0.5. Cells were scored and placed into four categories: those with GFP-Sec4p at the whole bud, bud neck, and bud tip and those with delocalized GFP-Sec4p (n > 300 cells, three independent experiments). Bars, 5 μm.
FIG 13
FIG 13
A lack of PI 18:0 in the psi1Δ mutant leads to secretion defects. Cells expressing Bgl2p-HA under the control of the GAL promoter were cultured at 13°C in the presence of 0.1% glucose and then shifted to 2% galactose. At various times after the shift, the amounts of secreted and internal pools of Bgl2p-HA were analyzed by Western blotting. (A) Membranes were incubated with anti-HA antibody. (B) Quantification of Bgl2p-HA secretion at various times after the shift to 2% galactose. Unpaired, two-tailed t tests were used for statistical analysis. *, P < 0.05; **, P < 0.01 (three experiments).
FIG 14
FIG 14
Decrease in the percentage of cells with GFP-Cdc42p localized in the bud between WT and psi1Δ/psi1Δ cells. Diploid cells were cultured in SC medium without uracil and methionine at 30°C and harvested at an OD600 of 0.5 before confocal microscopy. The difference in the proportion of BY4743 and psi1Δ/psi1Δ cells in which GFP-Cdc42p accumulated in the bud was scored using an unpaired, two-tailed t test. ***, P < 0.001 (n > 300 cells, five experiments).

Similar articles

Cited by

References

    1. Fahy E, Subramaniam S, Murphy RC, Nishijima M, Raetz CR, Shimizu T, Spener F, van Meer G, Wakelam MJ, Dennis EA. 2009. Update of the LIPID MAPS comprehensive classification system for lipids. J Lipid Res 50(Suppl):S9–S14. doi:10.1194/jlr.R800095-JLR200. - DOI - PMC - PubMed
    1. Tuller G, Nemec T, Hrastnik C, Daum G. 1999. Lipid composition of subcellular membranes of an FY1679-derived haploid yeast wild-type strain grown on different carbon sources. Yeast 15:1555–1564. doi:10.1002/(SICI)1097-0061(199910)15:14<1555::AID-YEA479>3.0.CO;2-Z. - DOI - PubMed
    1. Audhya A, Foti M, Emr SD. 2000. Distinct roles for the yeast phosphatidylinositol 4-kinases, Stt4p and Pik1p, in secretion, cell growth, and organelle membrane dynamics. Mol Biol Cell 11:2673–2689. doi:10.1091/mbc.11.8.2673. - DOI - PMC - PubMed
    1. Munnik T, Nielsen E. 2011. Green light for polyphosphoinositide signals in plants. Curr Opin Plant Biol 14:489–497. doi:10.1016/j.pbi.2011.06.007. - DOI - PubMed
    1. McCrea HJ, De Camilli P. 2009. Mutations in phosphoinositide metabolizing enzymes and human disease. Physiology (Bethesda) 24:8–16. doi:10.1152/physiol.00035.2008. - DOI - PMC - PubMed

Publication types

MeSH terms