. 2015 Dec 28;36(6):923-40.
doi: 10.1128/MCB.01074-15.

A Switch in Akt Isoforms Is Required for Notch-Induced Snail1 Expression and Protection from Cell Death

Affiliations

A Switch in Akt Isoforms Is Required for Notch-Induced Snail1 Expression and Protection from Cell Death

Alex Frías et al. Mol Cell Biol. .

Abstract

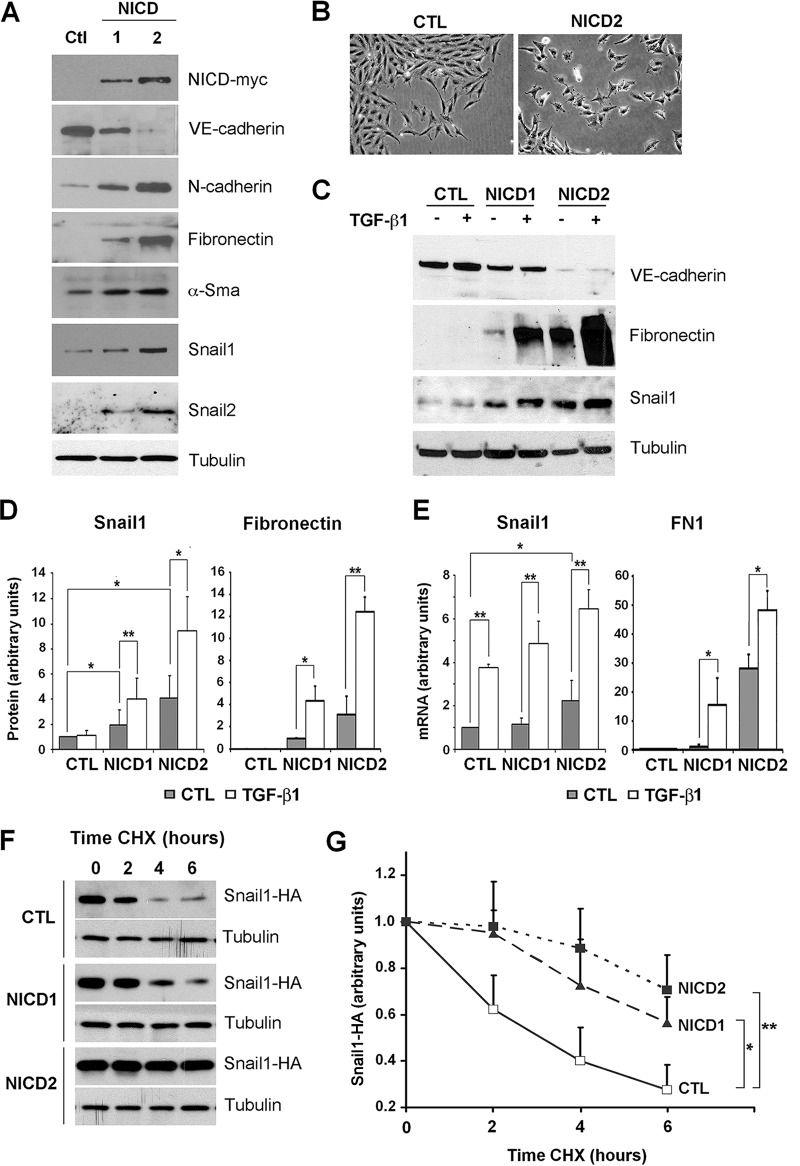
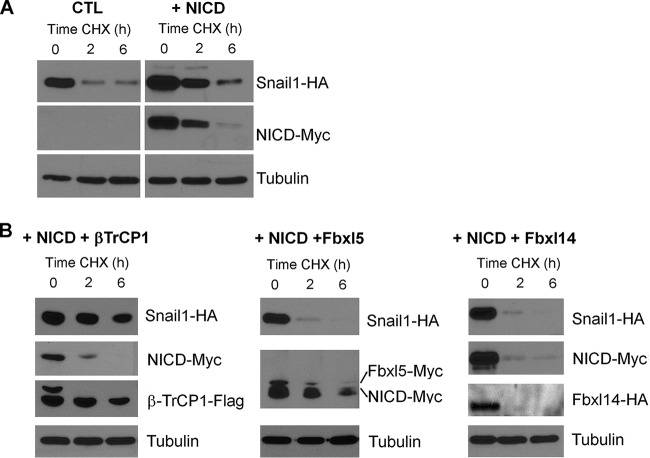
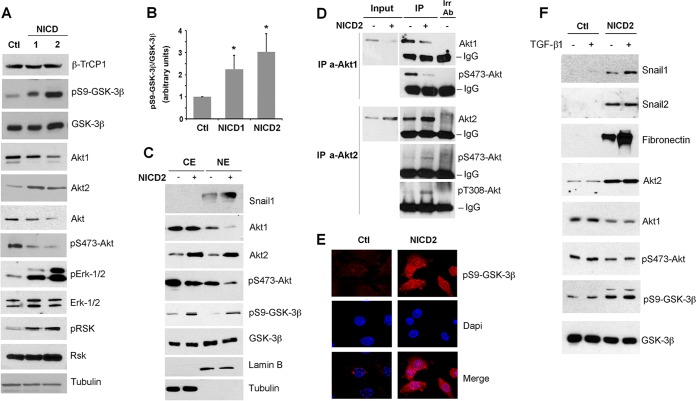
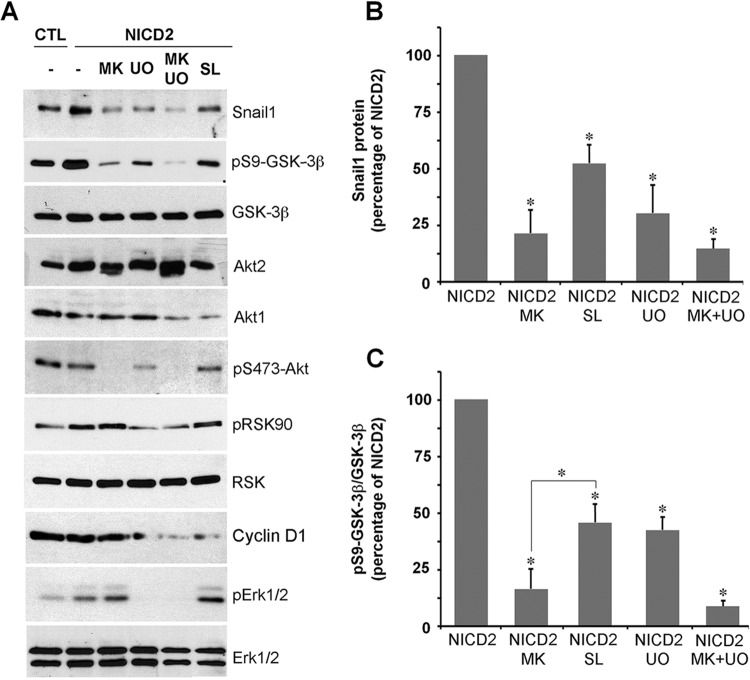
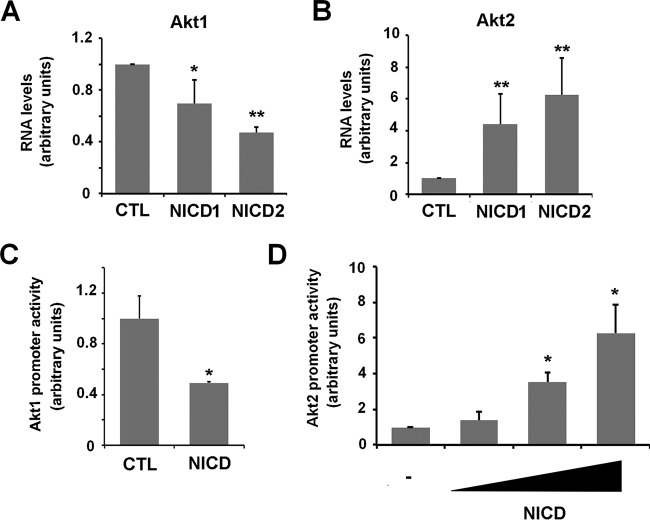
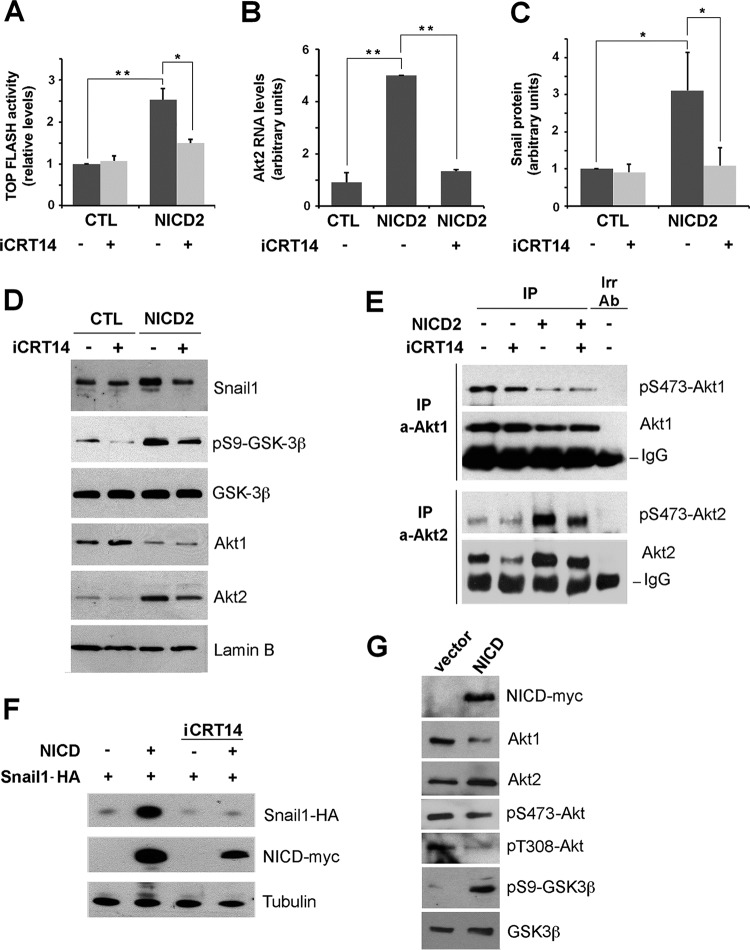
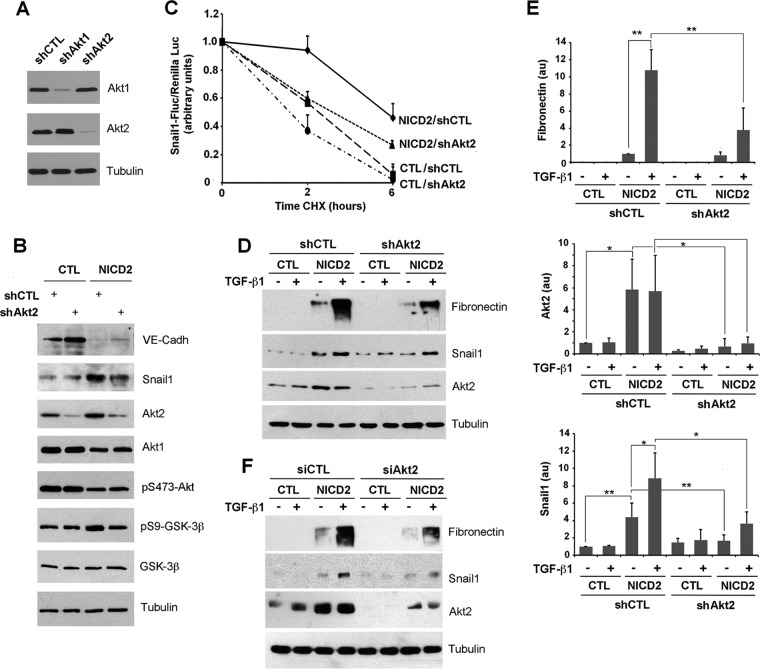
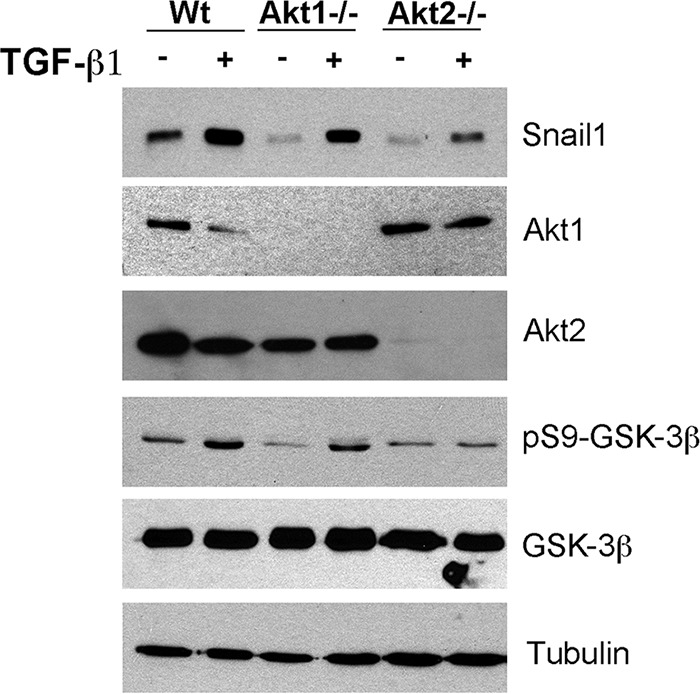
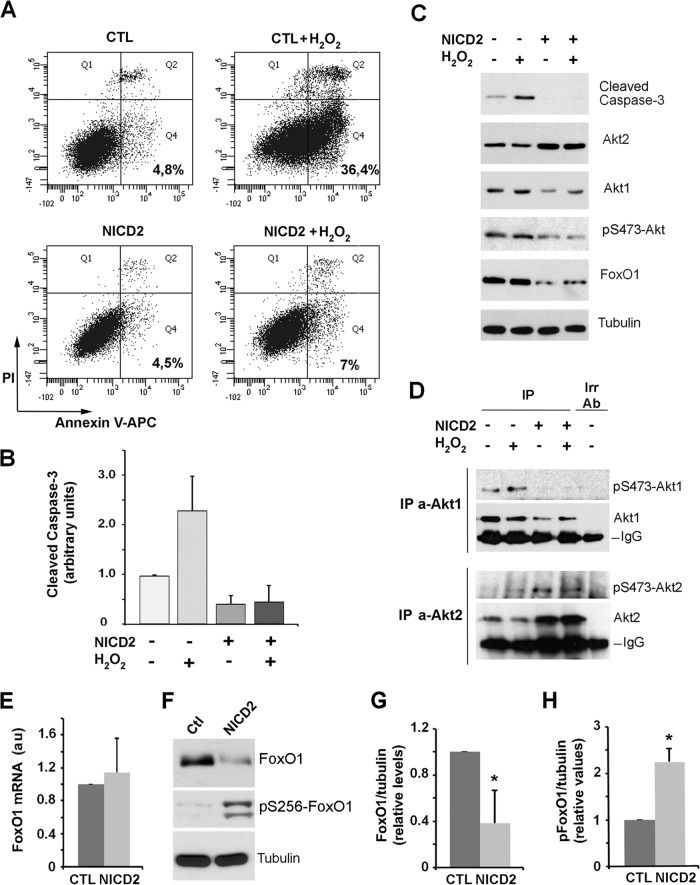
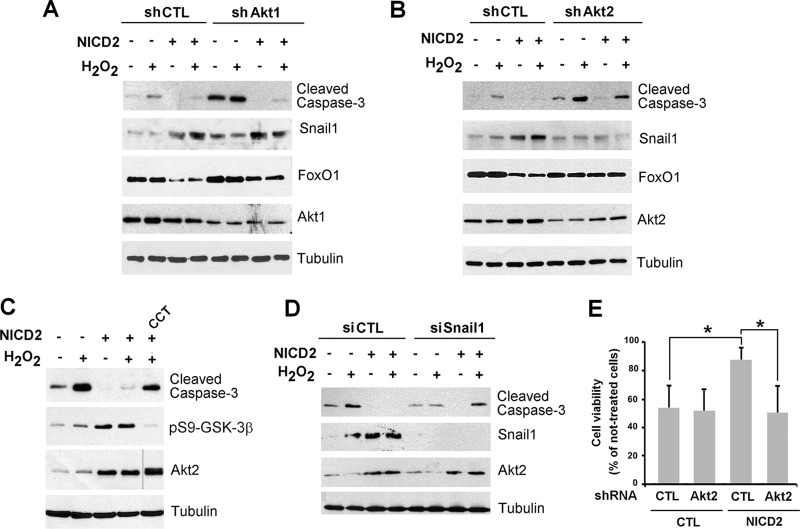
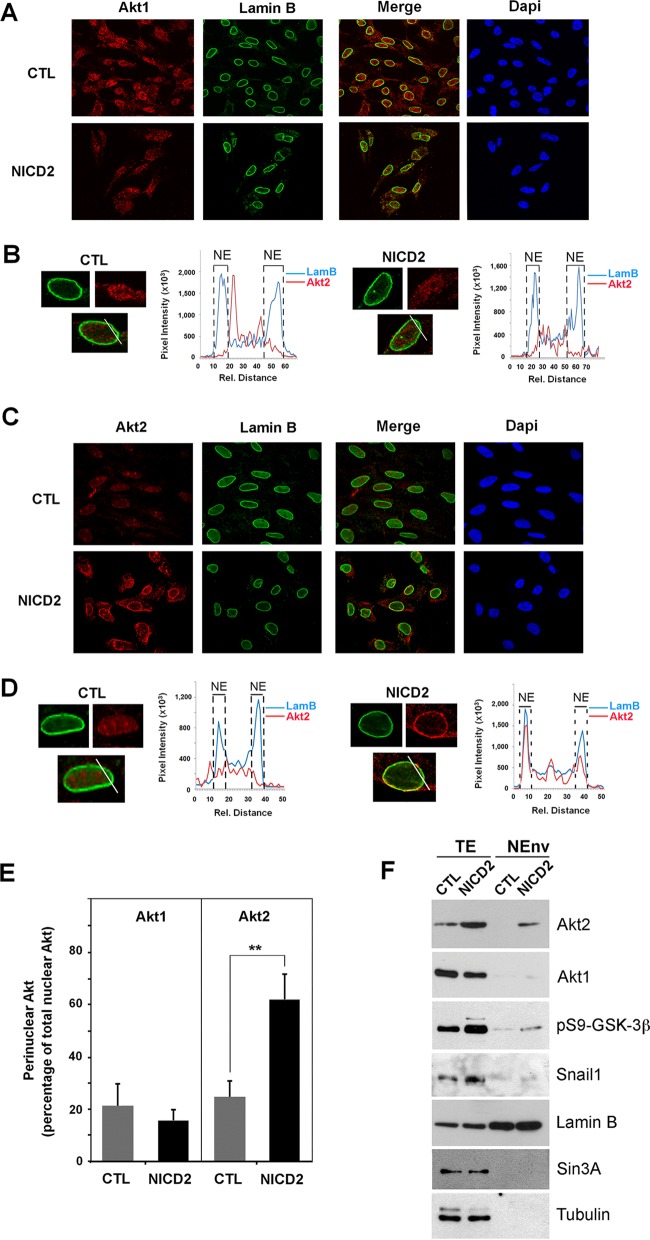
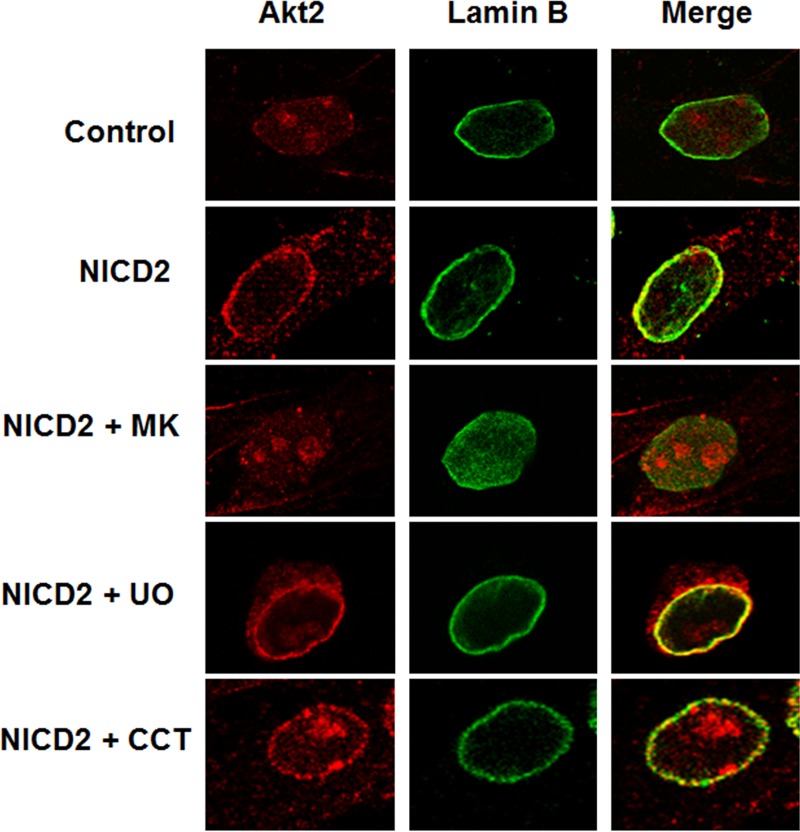
Notch activation in aortic endothelial cells (ECs) takes place at embryonic stages during cardiac valve formation and induces endothelial-to-mesenchymal transition (EndMT). Using aortic ECs, we show here that active Notch expression promotes EndMT, resulting in downregulation of vascular endothelial cadherin (VE-cadherin) and upregulation of mesenchymal genes such as those for fibronectin and Snail1/2. In these cells, transforming growth factor β1 exacerbates Notch effects by increasing Snail1 and fibronectin activation. When Notch-downstream pathways were analyzed, we detected an increase in glycogen synthase kinase 3β (GSK-3β) phosphorylation and inactivation that facilitates Snail1 nuclear retention and protein stabilization. However, the total activity of Akt was downregulated. The discrepancy between Akt activity and GSK-3β phosphorylation is explained by a Notch-induced switch in the Akt isoforms, whereby Akt1, the predominant isoform expressed in ECs, is decreased and Akt2 transcription is upregulated. Mechanistically, Akt2 induction requires the stimulation of the β-catenin/TCF4 transcriptional complex, which activates the Akt2 promoter. Active, phosphorylated Akt2 translocates to the nucleus in Notch-expressing cells, resulting in GSK-3β inactivation in this compartment. Akt2, but not Akt1, colocalizes in the nucleus with lamin B in the nuclear envelope. In addition to promoting GSK-3β inactivation, Notch downregulates Forkhead box O1 (FoxO1), another Akt2 nuclear substrate. Moreover, Notch protects ECs from oxidative stress-induced apoptosis through an Akt2- and Snail1-dependent mechanism.


Figures

FIG 1
FIG 1
Notch and TGF-β1 cooperate in EndMT and in the stimulation of Snail1 and fibronectin expression. (A) The indicated proteins were analyzed in PAE total extracts from control (CTL) or NICD-transfected (NICD1 and NICD2) cells by Western blotting. Tubulin was used as a loading control. (B) Representative micrographs of PAE-CTL and PAE-NICD2 cells. (C and D) VE-cadherin, Snail1, and fibronectin levels were determined by Western blotting in total extracts of the indicated cells treated with TGF-β1 (5 ng/ml) for 24 h. A representative result is shown in panel C, and the averages ± the standard deviations (SD; n = 3) of the quantification of Snail1 and fibronectin are shown in panel D. Densitometric values were normalized with respect to tubulin. (E) Snail1 and fibronectin (FN1) RNA in the indicated cells treated with TGF-β1 for 24 h was analyzed by RT-qPCR. Averages ± the SD (n = 4) are shown. In panels D and E, Snail1 values obtained in nontreated control cells or fibronectin values in nontreated NICD1 cells were used as a reference. (F) PAE cells were transfected with pcDNA3-Snail1-HA and, after 24 h, the cells were treated with 20 μg of CHX/ml for the indicated times and analyzed by Western blotting. (G) Snail1-HA degradation was quantified with ImageJ software, normalized with respect to tubulin, and represented with respect to the value at 0 h. The averages ± the SD (n = 4) are shown. (*, P < 0.05; **, P < 0.01).
FIG 2
FIG 2
Notch impairs Snail1 degradation by β-TrCP1. (A) Snail1-HA stability was checked in HEK 293T cells transfected with NICD-myc or with an empty vector (CTL). (B) Three known, tagged Snail1 ubiquitin ligases, namely, β-TrCP1-flag, Fbxl5-myc, and Fbxl14-HA, were also cotransfected. After 24 h, cells were treated with CHX for the indicated times, and cell extracts were analyzed by Western blotting.
FIG 3
FIG 3
Notch promotes a switch in Akt isoform expression, inactivates GSK-3β, and accumulates Snail1 in the nucleus. (A and C) The indicated proteins were analyzed by Western blotting in total (A) or cytosolic (lanes CE) and nuclear (lanes NE) extracts (C). Tubulin and lamin B were used as a control for cytosolic and nuclear compartments, respectively. (B) pS9-GSK-3β levels were quantified by densitometric analysis and normalized respect to total GSK-3β; the averages ± the SD (n = 4) are shown (*, P < 0.05). (D) Active levels of Akt1 and Akt2 were determined after immunoprecipitation (IP) of both isoforms, which were blotted against the respective phosphorylated proteins. Irr Ab, irrelevant control antibody; IgG, immunoglobulin band. (E) pS9-GSK-3β levels were analyzed by immunofluorescence in PAE-CTL and PAE-NICD2 cells (red); DAPI was used to identify nuclei. (F) PAE cells stably transfected with NICD-myc (NICD2) or empty vector (CTL) were treated with TGF-β1 for 24 h, and the indicated proteins were analyzed by Western blotting.
FIG 4
FIG 4
Akt and Erk/RSK collaborate in GSK-3β inactivation. (A to C) Total extracts of CTL or NICD2 were analyzed by Western blotting. Where indicated, cells were treated with MK-2206 (MK), UO126 (UO), or SL0101 (SL) (all at 10 μM) for 24 h. (B and C) Densitometric quantification of Snail1 normalized to tubulin (B) and pS9-GSK-3β normalized to total GSK-3β (C). Expression was related to maximal expression in NICD2 cells treated with vehicle (−) (averages ± the SD; n = 3); (*, P < 0.05).
FIG 5
FIG 5
Notch inversely modulates Akt1 and Akt2 RNA and promoter activities. (A and B) Akt1 and Akt2 mRNA were analyzed by RT-qPCR in CTL and Notch-expressing cells. The averages ± the SD (n = 4) are shown. (C and D) PAE-CTL cells were transiently transfected with NICD and Akt1 or Akt2 promoters for 24 h. Firefly luciferase was measured and normalized with respect to thymidine kinase (TK)-Renilla. (**, P < 0.01; *, P < 0.05).
FIG 6
FIG 6
Notch upregulates Akt2 and GSK-3β phosphorylation by stimulating β-catenin/TCF4 transcriptional activity. (A) Firefly luciferase activity of TOP-FLASH was measured in PAE-CTL and PAE-NICD2 cells after 48 h of plasmid transfection; where indicated, iCRT14 (25 μM) was added to the cell medium for the last 24 h. (B to D) mRNA levels of Akt2 (n = 3) (B), total Snail1 protein from densitometric quantification of independent blots (n = 4) (C), or the indicated nuclear proteins (D) were analyzed as above at 24 h (B) or 72 h (C and D) after iCRT14 addition. (E) Active levels of Akt1 and Akt2 were determined as described for Fig. 3D after treatment with iCRT14 for 72 h. (F) HEK 293T cells were transiently transfected with pcDNA3-Snail1-HA and pcDNA3-NICD-myc; after 24 h, the cells were treated with iCRT14 for an additional 24 h. Exogenous Snail1-HA or NICD-myc were analyzed by Western blotting. (G) HEK 293T cells were transfected with NICD-myc or an empty vector as control (vector), and cell extracts were analyzed by Western blotting with the indicated antibodies. The averages ± the SD respect to CTL untreated cells are shown in panels A to C (**, P < 0.01; *, P < 0.05).
FIG 7
FIG 7
Akt2 is required for the Notch induction of Snail1 protein stability. (A) After selecting the most appropriate shRNA for each isoform, Akt1 and Akt2 were downregulated transducing the corresponding lentiviral shRNA and selected with puromycin. Akt1 and Akt2 were determined by Western blotting; tubulin was used as a loading control. (B to E) CTL and NICD2 cells were infected with shRNA corresponding to Akt2 or a scrambled control, and the indicated proteins were analyzed by Western blotting. (C) The indicated cells were transfected with a fusion protein of Snail1 and firefly luciferase. The luciferase activity was measured and normalized against Renilla luciferase at different time points after CHX supplementation. Data are represented with respect to the value at time zero; the averages ± the SD (n = 3) are shown. In panel D, cells stably infected with shCtl and shAkt2 were treated with 5 ng of TGF-β/ml for 24 h. (E) The levels of protein shown in panel D were quantified as indicated above (n = 3). **, P < 0.01; *, P < 0.05; au, arbitrary units. (F) The experiment was carried out as for panel D, but using transfection with siRNA corresponding to Akt2 or a scrambled control.
FIG 8
FIG 8
Akt2 deletion prevents GSK-3β inactivation and Snail1 induction by TGF-β1 in MEFs. MEFs, either wild-type (WT) or knocked out for Akt1 (Akt1–/–) or for Akt2 (Akt2–/–), were treated for 1 h with TGF-β1. The indicated proteins were analyzed by Western blotting.
FIG 9
FIG 9
Notch expression in PAE cells protects from apoptosis. (A) FACS analysis by annexin V-APC and propidium iodide (PI) staining at 16 h after adding 200 μM hydrogen peroxide (H2O2) to CTL and NICD2 cells. PI/annexin V+ cells (Q4) were considered early apoptotic. Representative results from one of the three experiments (which all gave similar results) are shown. (B and C) Total protein extracts of indicated cells, treated where indicated with H2O2 for 24 h, were analyzed by Western blotting. A representative experiment is shown (C), as well as the quantification of cleaved caspase-3 (B), using the averages ± the SD (n = 4). (D) Active levels of Akt1 and Akt2 were analyzed as described for Fig. 3D. (E and F) Changes in FoxO1 were determined in control (Ctl) and NICD2-expressing cells by RT-qPCR (E) or by Western blotting (F). Phosphorylated FoxO1 (pS256-FoxO1) was also determined (F). (G and H) The quantification of three different Western blot analyses. *, P < 0.05 compared to CTL.
FIG 10
FIG 10
Akt2-induced Snail1 stability is essential for apoptosis prevention by Notch in endothelial cells. (A, B, D, and E) Akt1 and Akt2 were downregulated using specific shRNAs targeting each kinase and Snail1 with a specific siRNA in both CTL and NICD2 PAE cells. Cells were treated with H2O2 for 24 h, and the indicated proteins were analyzed by Western blotting. Tubulin was used as a loading control. (C) Control or NICD2 PAE cells were treated with H2O2 for 24 h, when indicated, and Akt2 was inhibited by treatment with CCT128930 (CCT; 10 μM). (E) After 32 h of H2O2 treatment, the cell viability was quantified as indicated in Materials and Methods and is represented with respect to the value in nontreated cells. Averages ± the SD (n = 3) are shown. (*, P < 0.05).
FIG 11
FIG 11
Akt2 but not Akt1 is localized in the nuclear envelope in endothelial cells stimulated by Notch expression. (A to D) Nuclear immunofluorescence in PAE-CTL and PAE-NICD2 cells previously treated with CSK buffer to eliminate cytosolic proteins. Akt1, Akt2, lamin B, and DAPI staining was analyzed using a confocal microscope. Representative graphs of the colocalization of Akt1 (A and B) or Akt2 (C and D) with lamin B in both PAE-CTL and PAE-NICD2 cells are presented. (B and D) Each graph shows a line profile indicating areas of colocalization of Akt1 (B) or Akt2 (D) and lamin B in both PAE-CTL (left) and PAE-NICD2 (right) cells. Each line profile represents the intensity of the signal versus the pixel distance. The maximal lamin B staining is represented by a dashed line indicated by “NE” and corresponds to the nuclear envelope. (E) Quantification of the different immunofluorescence of Akt1 and Akt2 in the perinuclear compartment was performed as described in Materials and Methods. (F) Nuclear envelope proteins (NEnv) were isolated and analyzed by Western blotting. Total extracts (TE) were used as an input. Lamin B was used as a nuclear membrane marker; Sin3A and tubulin, present in the nucleoplasm and cytosol, respectively, were used to verify the absence of contamination in the nuclear lamina fraction.
FIG 12
FIG 12
Nuclear Akt2 staining induced by Notch is blocked by inhibition of Akt phosphorylation. Akt2 and lamin B were analyzed by immunofluorescence as done in Fig. 11 in control PAE cells and Notch cells (NICD2) that had been treated with MK-2206 (MK), UO126 (UO), or CCT128930 (CCT) (all at 10 μM) for 24 h. Merge images indicate colocalization.

Similar articles

Cited by

References

    1. Lim J, Thiery JP. 2012. Epithelial-mesenchymal transitions: insights from development. Development 139:3471–3486. doi:10.1242/dev.071209. - DOI - PubMed
    1. Camenisch TD, Molin DG, Person A, Runyan RB, Gittenberger-de Groot AC, McDonald JA, Klewer SE. 2002. Temporal and distinct TGFβ ligand requirements during mouse and avian endocardial cushion morphogenesis. Dev Biol 248:170–181. doi:10.1006/dbio.2002.0731. - DOI - PubMed
    1. Medici D, Kalluri R. 2012. Endothelial-mesenchymal transition and its contribution to the emergence of stem cell phenotype. Semin Cancer Biol 22:379–384. doi:10.1016/j.semcancer.2012.04.004. - DOI - PMC - PubMed
    1. Yu W, Liu Z, An S, Zhao J, Xiao L, Gou Y, Lin Y, Wang J. 2014. The endothelial-mesenchymal transition (EndMT) and tissue regeneration. Curr Stem Cell Res Ther 9:196–204. doi:10.2174/1574888X09666140213154144. - DOI - PubMed
    1. Potenta S, Zeisberg E, Kalluri R. 2008. The role of endothelial-to-mesenchymal transition in cancer progression. Br J Cancer 99:1375–1379. doi:10.1038/sj.bjc.6604662. - DOI - PMC - PubMed

Publication types

MeSH terms

LinkOut - more resources