. 2015 Dec 29;13(12):2715-27.
doi: 10.1016/j.celrep.2015.12.003. Epub 2015 Dec 17.

MLL-Rearranged Acute Lymphoblastic Leukemias Activate BCL-2 through H3K79 Methylation and Are Sensitive to the BCL-2-Specific Antagonist ABT-199

Affiliations

MLL-Rearranged Acute Lymphoblastic Leukemias Activate BCL-2 through H3K79 Methylation and Are Sensitive to the BCL-2-Specific Antagonist ABT-199

Juliana M Benito et al. Cell Rep. .

Abstract

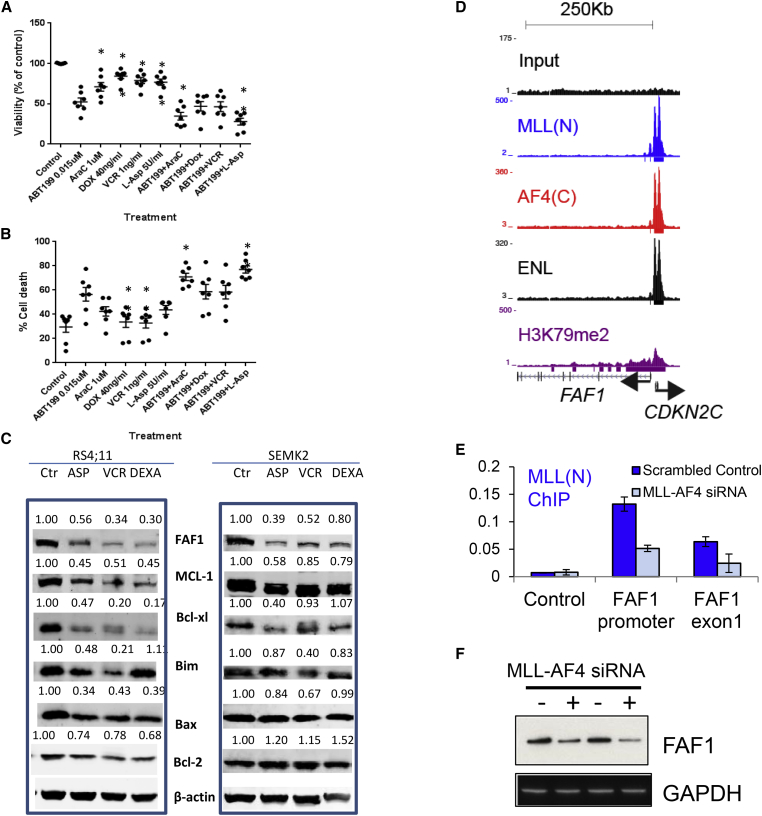
Targeted therapies designed to exploit specific molecular pathways in aggressive cancers are an exciting area of current research. Mixed Lineage Leukemia (MLL) mutations such as the t(4;11) translocation cause aggressive leukemias that are refractory to conventional treatment. The t(4;11) translocation produces an MLL/AF4 fusion protein that activates key target genes through both epigenetic and transcriptional elongation mechanisms. In this study, we show that t(4;11) patient cells express high levels of BCL-2 and are highly sensitive to treatment with the BCL-2-specific BH3 mimetic ABT-199. We demonstrate that MLL/AF4 specifically upregulates the BCL-2 gene but not other BCL-2 family members via DOT1L-mediated H3K79me2/3. We use this information to show that a t(4;11) cell line is sensitive to a combination of ABT-199 and DOT1L inhibitors. In addition, ABT-199 synergizes with standard induction-type therapy in a xenotransplant model, advocating for the introduction of ABT-199 into therapeutic regimens for MLL-rearranged leukemias.

Keywords: DOT1L; H3K79 methylation; MLL/AF4; apoptosis pathways; bcl-2 family members; leukemias.


Figures

None
Graphical abstract
Figure 1
Figure 1
RPPA Profiling of BCL-2 Proteins in ALL, Showing Heatmaps of Differentially Expressed Proteins Based on Cytogenetics Black bars indicate 8q24 leukemia samples and their expression patterns are shown in the blue dashed line box. Yellow bars indicate t(4;11)-positive samples, and their expression patterns are shown in the red dashed line box. See also Figure S1.
Figure 2
Figure 2
MLL-AF4 Binds to the BCL-2 Gene and Keeps It Active (A) Schematic of MLL/AF4 direct interactions and mutually exclusive complexes (dotted arrows). Gene activation could occur (1) by promoting H3K79 methylation, (2) by inhibiting CBX8 activity, or (3) AF4/AFF4 direct recruitment of P-TEFb (ie. Cyclin T1 and CDK9) and serine 2 phosphorylation of RNA polymerase II. (B) ChIP-seq and ATAC-seq peaks in SEM cells across the BCL-2 locus. PCR primers (1–6) used in subsequent experiments are shown as yellow arrowheads. P, promoter; E, enhancer. (C) BCL-2 is ranked 8,381 out of 8,647 genes (top 5%) marked with H3K79me2 in SEM cells. (D) Real-time PCR for different targets in SEM cells treated with either a control (black bars) or an MLL-AF4-specific siRNA (gray bars). Signal was normalized to control treated cells and is the average of five independent knockdown experiments. Error bars indicate SD. p < 0.02. (E) Western blots for the indicated proteins in SEM cells treated with either a control (−) or MLL-AF4 specific (+) siRNA. (F–H) ChIP experiments (the average of three to five independent knockdowns) for MLL(N), AF4(C), ENL, AF9, AFF4, or CDK9 in SEM cells treated with either control (dark colored bars) or MLL-AF4 siRNAs (light colored bars). PCR primers are as indicated in (A). A9 = a primer set in the well-known MLL/AF4 target gene HOXA9, used as a positive control for ChIP. Error bars indicate SEM. See also Figure S2.
Figure 3
Figure 3
MLL-AF4 Keeps BCL-2 Active by Promoting H3K79me2/3 (A–C) ChIP experiments (average of four independent knockdowns) for H3K79me2, H3K79me3, H3K27Ac, or H3K4me3 in SEM cells treated with either control (dark bars) or MLL-AF4 siRNAs (light bars). PCR primers are as in Figure 1. Error bars indicate SEM. rel, relative; neg, negative. (D) SEM cells treated with 2 μM or 5 μM EPZ5676 for 7 days were subjected to real-time RT-PCR with the primers/probe sets indicated. Error bars indicate SD of four PCR replicates. (E) Western blots of SEM cells treated with 2 or 5 μM EPZ5676 for 7 days. (F) H3K79me3 ChIP at the BCL-2 and HOXA9 loci in 5 μM EPZ5676-treated SEM cells. (G) A proposed model where MLL/AF4 stabilizes ENL protein levels and creates a local concentration of ENL that allows for dynamic exchange between an MLL-AF4:ENL complex and a DOT1L:ENL complex, potentially increasing H3K79me3 levels at the locus. (H) SEM cells were co-treated with 1 μM of DOT1L inhibitors SGC0946 or EPZ5676 and increasing concentrations of ABT-199 (50 nM, 100 nM, and 150 nM) for 4 days (SGC0946) or 7 days (EPZ5676). Error bars indicate SEM. See also Figure S3.
Figure 4
Figure 4
MLL/AF4 Does Not Directly Activate Other BCL-2 Family Genes (A) ChIP-seq and ATAC-seq peaks in SEM cells at the loci indicated. BCL-2 tracks are also shown for comparison purposes. PCR primers (1–15) used in subsequent experiments shown by yellow arrowheads. (B) ChIP experiments (average of three to five independent knockdowns) in SEM cells treated with either control (dark colored bars) or MLL-AF4 siRNAs (light colored bars). PCR primers are as in (A). BCL-2 and HOXA9 (A9) data are from Figure 2 and included for comparison purposes. Error bars indicate SEM. (C) The same H3K79me2 ranking graph as in Figure 2C, with BCL-2 family genes added for comparison purposes. (D) Real-time PCR of samples from Figure 2D for BCL-2 family genes. MLL-AF4, MLL, and BCL-2 expression data are from Figure 2D and included for comparison purposes. Error bars indicate SD. p < 0.02. (E) Western blots for the indicated proteins in SEM cells treated with either a control (−) or MLL-AF4-specific (+) siRNA. Results shown are from three different biological replicates.
Figure 5
Figure 5
BH3 Profiling Reveals BCL-2 Dependence in Primary ALL (A) BiFC analysis of interactions of anti-apoptotic proteins with BIM. Results are expressed as the fold change induced by ABT-199/ABT-737 in Venus/RFP (red fluorescent protein) ratio and are the mean ± SEM of three to six independent experiments. p < 0.05; ∗∗p < 0.01. (B) Levels of cytochrome c release from mitochondria of ALL cells exposed to the indicated BH3 peptides were correlated with cell viability IC50 values for ABT-199. (C) Cytochrome c release induced by BAD versus HRK peptides. The pink area represents probable BCL-2 dependence, and the blue area represents BCL-XL dependence. (D) IC50 values for ABT-199 and ABT-737 in ALL cell lines. MLL-rearranged ALL cell lines are shown in green (RS4;11) or red (SEMK2). ALL cell line cells were treated with ABT-737 or ABT-199 for 48 hr, and the IC50 values calculated on the basis of viable (i.e., Annexin V-/PI-) cell numbers determined by flow cytometry. (E) Sensitivity to ABT-199 correlates with endogenous BCL-2 protein levels but not with BCL-XL levels in ALL cell lines. Spearman correlations were calculated based on protein expression levels relative to an internal control (β-actin) and then normalized to levels in NALM-6 cells. (F) Primary ALL cells (n = 19) were treated with ABT-737 or ABT-199 for 24 hr, and the IC50 values were calculated as described earlier. MLLx, MLL-rearranged xenograft samples. See also Figure S4.
Figure 6
Figure 6
ABT-199 in Combination with Chemotherapy Exhibits Cytotoxic Activity against Primary ALL Cells (A and B) ALL primary samples (n = 6) and one sample from a patient with t(4;11) biphenotypic leukemia were treated with each single reagent or in combination with ABT-199 at the following concentrations: ABT-199, 0.015 μM; AraC, 1 μM; DOX, 40 ng/ml; VCR, 1 ng/ml; and L-ASP, 5 U/ml. At 24 hr, viability (A) and cell death (B) were determined by Annexin V and 7-AAD staining. Each dot represents one sample. Error bars indicate SEM. p < 0.05. (C) Western blot analysis of RS4;11 or SEMK2 cells left untreated (Ctr) or treated for 48 or 24 hr, respectively, with: L-ASP (ASP), 2 U or 5 U (RS4;11 or SEMK2, respectively); VCR, 5 ng/ml; or DEXA, 1 μM. Representative blot of one of the three experiments that yielded similar results is shown. (D–F) MLL/AF4 binds to the FAF1 gene (D), and MLL/AF4 siRNA treatment reduces MLL-AF4 binding to FAF1 (E) and reduces FAF1 protein levels (western blot, F). Error bars in (E) represent SEM for three independent knockdown experiments. See also Figure S5 and Table S3.
Figure 7
Figure 7
ABT-199 Attenuates Tumor Growth of MLLr Pre-B ALL and Interacts Synergistically with Induction-type Chemotherapy to Eradicate Patient-Derived ALL Cells In Vivo (A) NSG mice were injected intravenously with ICN3 xenograft cells generated from a pediatric patient with relapsed MLL-rearranged pre-B-ALL. At day 45 post-injection, mice were randomized into two treatment groups (n = 6 per arm): Vehicle only; ABT-199 at 100 mg/kg/day. Leukemia burden expressed as percent human CD19+ cells is shown in peripheral blood (PB) on days 4 and 10 after treatment initiation and in BM and spleen on day 10. p < 0.05; ∗∗p < 0.01. (B) BH3 profiling of primary derived xenografts #542 and #682. Cytochrome c release in response to various concentrations of BH3 peptides and ABT-199. (C and D) Leukemia cells from two patients with t(4;11) ALL (#542 and #682) were injected into NRG mice via tail vein. On day 24 post-engraftment, mice were randomly divided into cohorts to receive VXL (VCR, DEXA, and L-ASP), ABT-199 alone, VXL+ABT-199 combination; or vehicle controls (n = 6 per arm). (C) Percentage of circulating ALL cells on day 42 post-engraftment in case #542. (D) Time course changes in percentages of circulating ALL cells in case #682. Leukemia progression was evaluated by determining the percentage of circulating human CD45-positive cells across different treatment groups. Error bars indicate SD. See also Figure S6.

References

    1. Alford S.E., Kothari A., Loeff F.C., Eichhorn J.M., Sakurikar N., Goselink H.M., Saylors R.L., Jedema I., Falkenburg J.H., Chambers T.C. BH3 inhibitor sensitivity and Bcl-2 dependence in primary acute lymphoblastic leukemia cells. Cancer Res. 2015;75:1366–1375. - PMC - PubMed
    1. Andersson A.K., Ma J., Wang J., Chen X., Gedman A.L., Dang J., Nakitandwe J., Holmfeldt L., Parker M., Easton J., St. Jude Children’s Research Hospital–Washington University Pediatric Cancer Genome Project The landscape of somatic mutations in infant MLL-rearranged acute lymphoblastic leukemias. Nat. Genet. 2015;47:330–337. - PMC - PubMed
    1. Beldjord K., Chevret S., Asnafi V., Huguet F., Boulland M.L., Leguay T., Thomas X., Cayuela J.M., Grardel N., Chalandon Y., Group for Research on Adult Acute Lymphoblastic Leukemia (GRAALL) Oncogenetics and minimal residual disease are independent outcome predictors in adult patients with acute lymphoblastic leukemia. Blood. 2014;123:3739–3749. - PubMed
    1. Biswas D., Milne T.A., Basrur V., Kim J., Elenitoba-Johnson K.S., Allis C.D., Roeder R.G. Function of leukemogenic mixed lineage leukemia 1 (MLL) fusion proteins through distinct partner protein complexes. Proc. Natl. Acad. Sci. USA. 2011;108:15751–15756. - PMC - PubMed
    1. Bursen A., Schwabe K., Rüster B., Henschler R., Ruthardt M., Dingermann T., Marschalek R. The AF4.MLL fusion protein is capable of inducing ALL in mice without requirement of MLL.AF4. Blood. 2010;115:3570–3579. - PubMed

Publication types

MeSH terms