. 2015 Dec 29;13(12):2768-80.
doi: 10.1016/j.celrep.2015.12.002. Epub 2015 Dec 17.

Bidirectional Control of Synaptic GABAAR Clustering by Glutamate and Calcium

Affiliations

Bidirectional Control of Synaptic GABAAR Clustering by Glutamate and Calcium

Hiroko Bannai et al. Cell Rep. .

Abstract

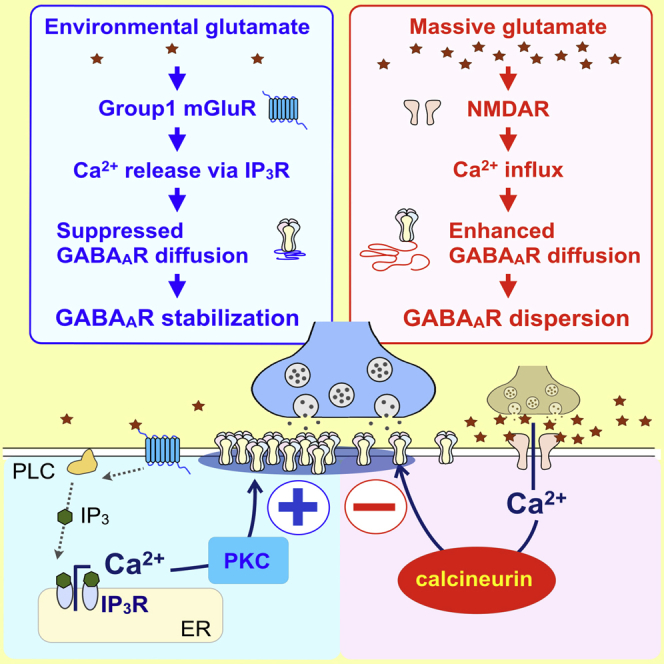
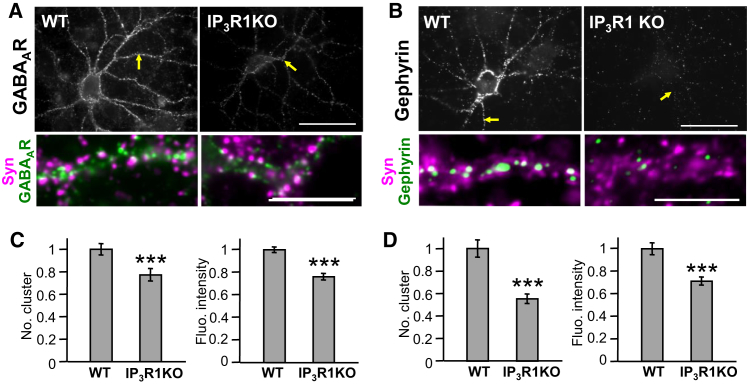
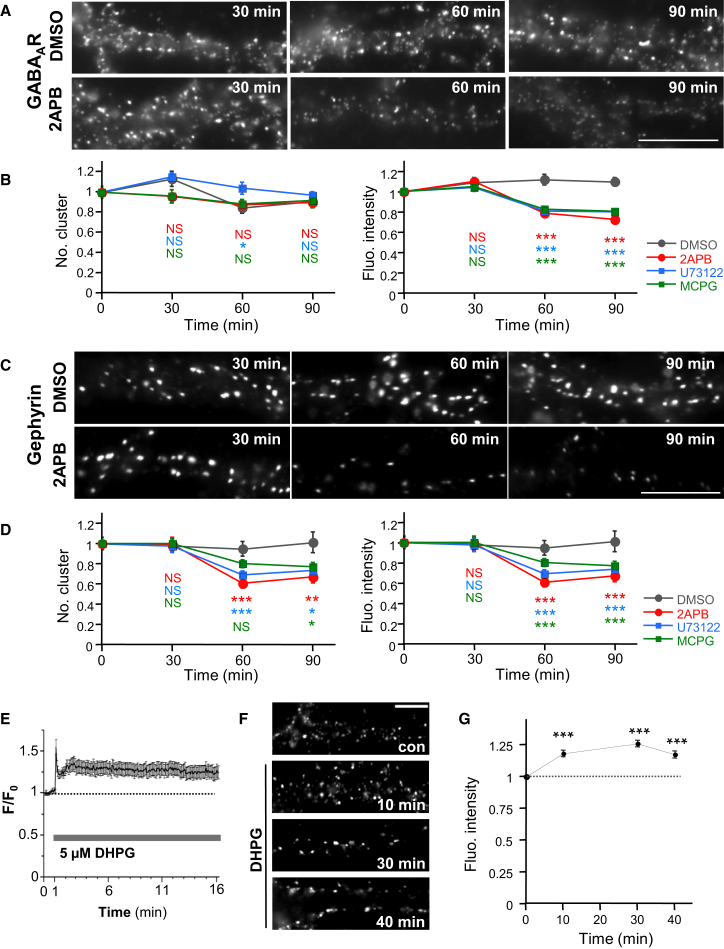
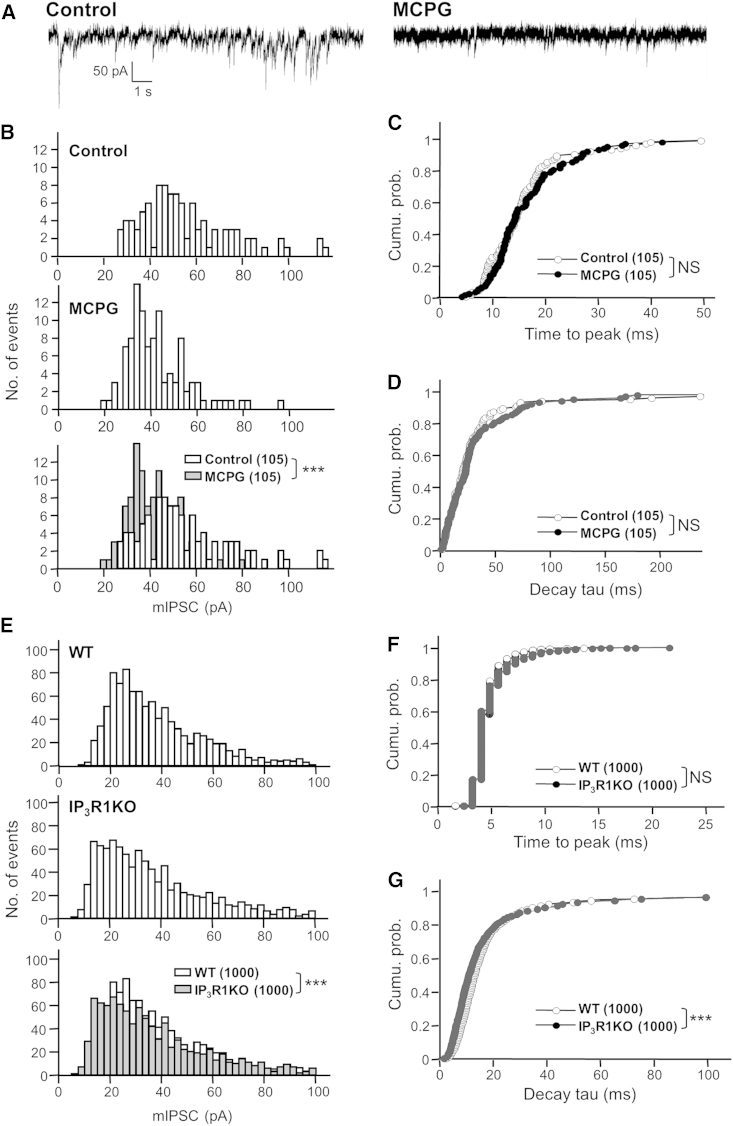
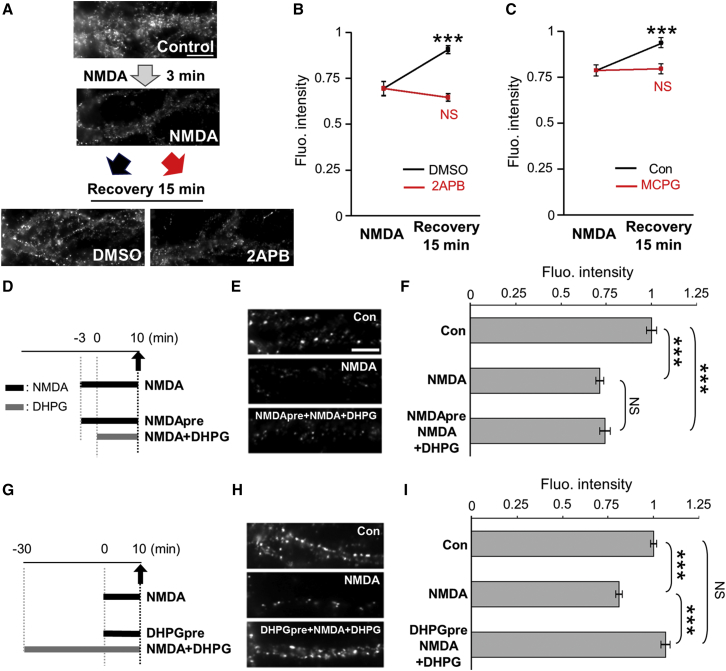
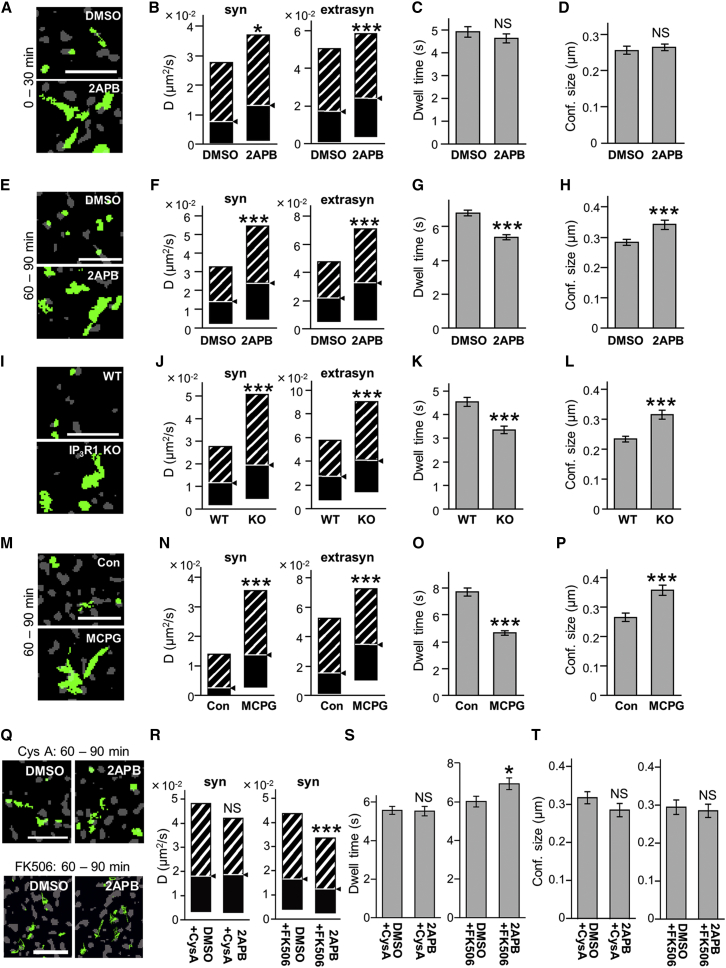
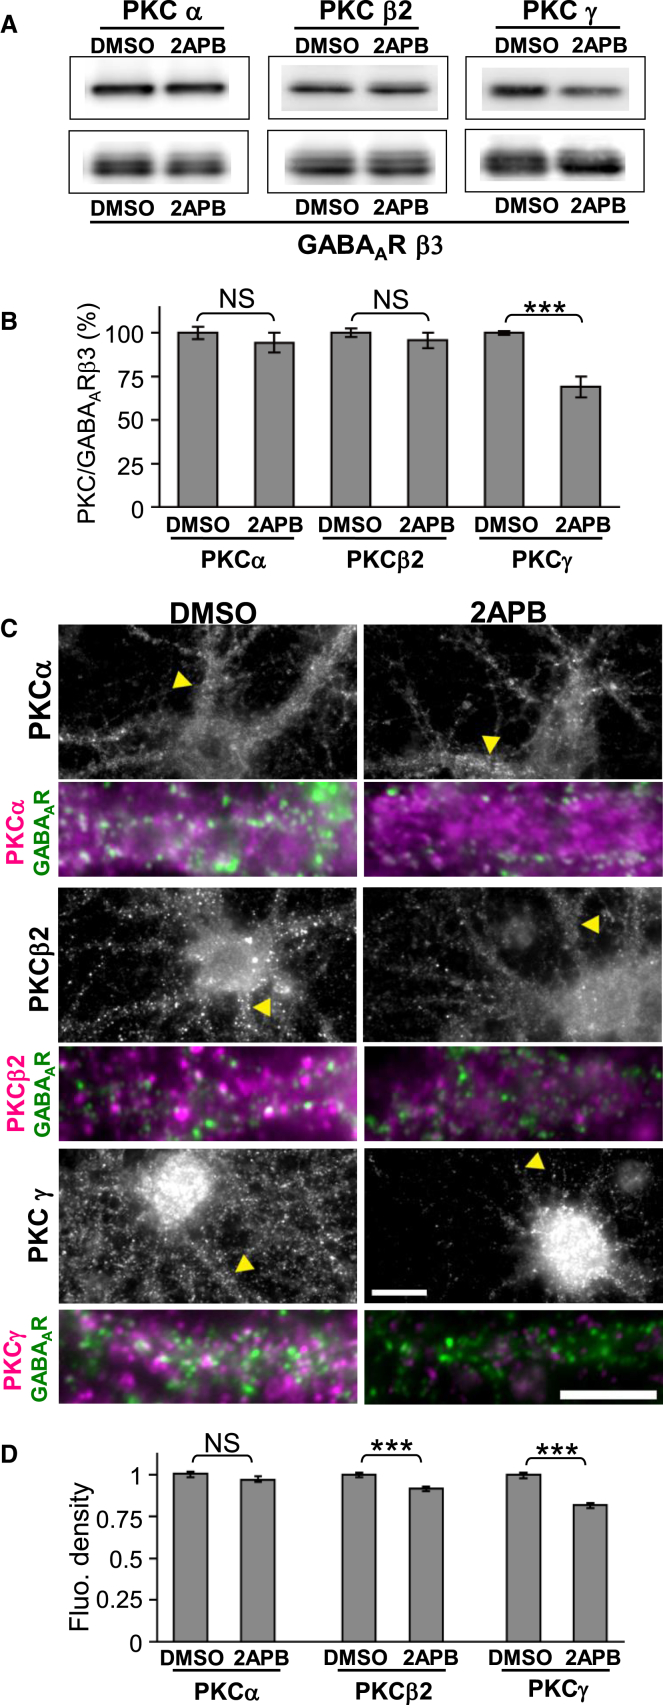
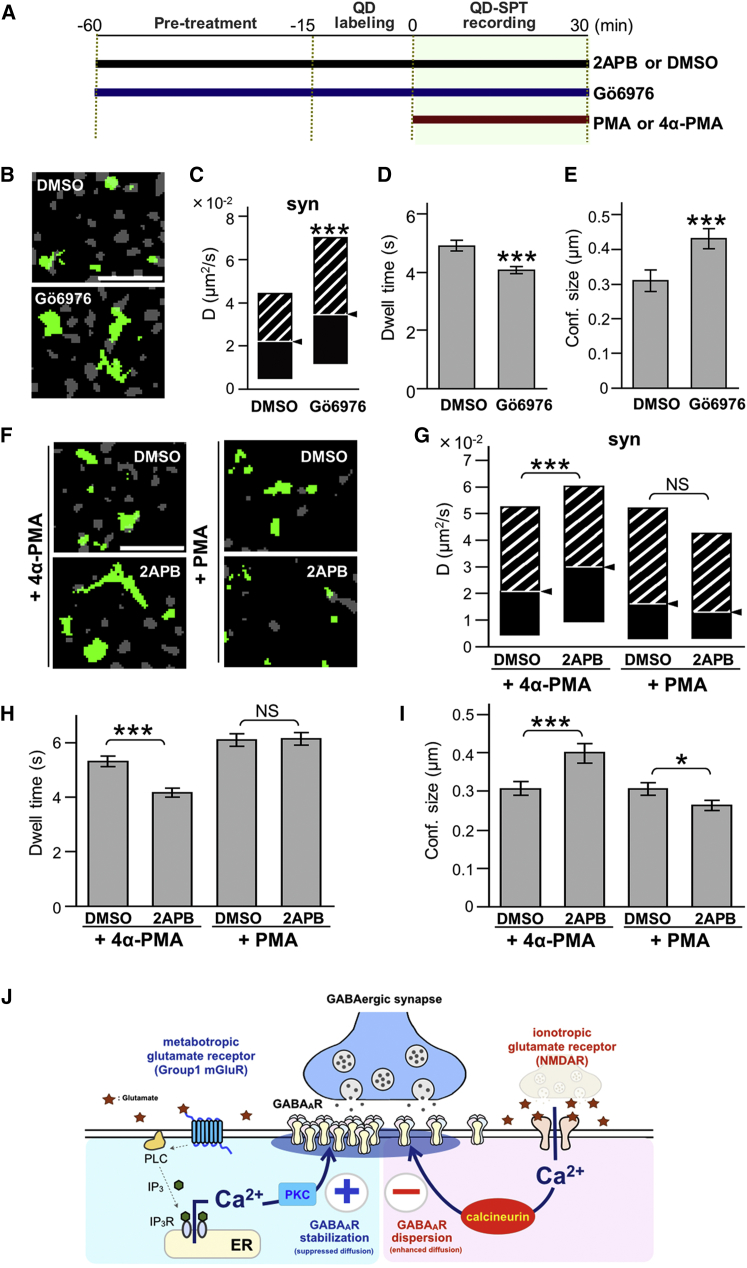
GABAergic synaptic transmission regulates brain function by establishing the appropriate excitation-inhibition (E/I) balance in neural circuits. The structure and function of GABAergic synapses are sensitive to destabilization by impinging neurotransmitters. However, signaling mechanisms that promote the restorative homeostatic stabilization of GABAergic synapses remain unknown. Here, by quantum dot single-particle tracking, we characterize a signaling pathway that promotes the stability of GABAA receptor (GABAAR) postsynaptic organization. Slow metabotropic glutamate receptor signaling activates IP3 receptor-dependent calcium release and protein kinase C to promote GABAAR clustering and GABAergic transmission. This GABAAR stabilization pathway counteracts the rapid cluster dispersion caused by glutamate-driven NMDA receptor-dependent calcium influx and calcineurin dephosphorylation, including in conditions of pathological glutamate toxicity. These findings show that glutamate activates distinct receptors and spatiotemporal patterns of calcium signaling for opposing control of GABAergic synapses.


Figures

None
Graphical abstract
Figure 1
Figure 1
Gene KO of IP3R1 Conducts to the Dispersal of GABAAR and Gephyrin Clusters (A and B) Hippocampal neurons from 15–18 DIV wild-type (WT) or IP3R1 knockout (IP3R1KO) mice stained for GABAAR γ2 subunit (A) and gephyrin (B). Arrows in upper panels indicate the dendrites enlarged in lower panels. Color code in lower panels is as follows: green, GABAAR or gephyrin clusters; magenta, synapsin punctae; and white, GABAAR or gephyrin clusters facing synapsin-labeled boutons. Note the decrease in GABAAR and gephyrin immunoreactivities in IP3R1KO neurons as compared to WT neurons. Scale bars, 50 and 10 μm in upper and lower panels, respectively. (C and D) Number of synaptic clusters per dendrite length (left) and fluorescent intensities (right) of synaptic GABAAR (C) and gephyrin (D) clusters. Values represent mean ± SEM and were normalized to their respective control values (C, n = 36 cells for WT, n = 38 for IP3R1KO; D, n = 37 for WT, n = 38 for IP3R1KO; ∗∗∗p < 0.005, Welch’s t-test).
Figure 2
Figure 2
mGluR/IICR-Signaling Cascade Promotes Clustering of GABAAR and Gephyrin (A–D) Effect of pharmacological blockade of IICR on GABAAR (A and B) and gephyrin (C and D) clustering in 21–27 DIV hippocampal neurons. (A and C) Representative examples show GABAAR (A) or gephyrin (C) immunoreactivity after 100 μM 2APB or 0.1% DMSO treatment for 30, 60, and 90 min. (B and D) The number of cluster per dendrite length (left) and fluorescence intensities (right) of synaptic GABAAR (B) or gephyrin (D) clusters in cells exposed to DMSO (gray), 2APB (red), U73122 (blue), or MCPG (green) are shown. Plots show mean values ± SEM in function of time. Data were normalized to their respective control values. (E) Time course of DHPG-induced intracellular Ca2+ elevation as reported by measurement of Fluo-4 F/F0 ratio (means ± SEM; n = 41). (F and G) Representative images (F) and quantifications (G) of the fluorescence intensity of synaptic GABAAR clusters showing that DHPG increases GABAAR clustering. Values (mean ± SEM) were normalized to their respective control values (n ≥ 30 cells per condition; ∗∗∗p < 0.005, p < 0.05, t-test). Scale bars, 10 μm. See also Figures S1–S5.
Figure 3
Figure 3
Lower Efficacy of GABA Synapses after Reduced IICR Activity (A) Examples show GABAergic mIPSC traces recorded in cultured hippocampal neurons in the absence (left) or presence (right) of mGluR inhibitor MCPG. (B) Distribution of mIPSC amplitudes in the absence (white, top and bottom) or presence (gray, middle and bottom) of MCPG. Note that the distribution of mIPSC amplitudes is shifted toward lower values in MCPG-treated neurons. (C and D) Cumulative distributions of time to peak (C) and decay time constant (D) of mIPSCs in the absence (open) or presence of MCPG (close). The first 15 events were collected from seven neurons per condition. (E) Distributions of mIPSC amplitudes recorded in pyramidal neurons from P14–P16 WT (white, top and bottom) or IP3R1KO mice (gray, middle and bottom) hippocampal slices. The overlay emphasizes the reduction in mIPSC amplitudes in IP3R1KO. (F and G) Distributions of time to peak (F) and decay time constant (G) of mIPSCs of WT (white circle) and IP3R1KO (black circle). The first 250 events were collected from four neurons per condition (∗∗∗p < 0.005; ns, not significant; Mann-Whitney U-test).
Figure 4
Figure 4
mGluR/IICR Contribute to the Positive Control of GABAAR Clustering through Separate Non-overlapping Mechanisms with Ca2+ Influx (A–C) Inhibition of IICR prevents re-clustering of GABAAR at synapses after NMDA washout. (A) Examples show GABAAR γ2 immunoreactivities after 3-min exposure to NMDA (top) or after 15 min of NMDA washout in the presence of DMSO (middle) or 2APB (bottom). Scale bar, 10 μm. (B and C) Quantification of the fluorescence intensity of GABAARγ2 before (NMDA) and after washout (Recovery), in the presence or absence of 2APB (B) or MCPG (C), is shown. Values (mean ± SEM) were normalized to their respective control values (n = 30 cells/condition; ∗∗∗p < 0.005, t-test). (D–I) Pre-activation of IICR prevents NMDA-mediated dispersion of GABAAR. Neurons pre-incubated to NMDA (D–F) or DHPG (G–I) were then exposed to NMDA in the presence of DHPG. Images (E and H) and quantifications of synaptic cluster fluorescence intensities (F and I) reveal that DHPG restored GABAAR clustering only when neurons were pre-treated with DHPG. Scale bars, 10 μm. Values (mean ± SEM) were normalized to their respective control values (n = 30–60 cells per condition; ∗∗∗p < 0.005, Tukey’s range test in ANOVA).
Figure 5
Figure 5
Reduced IICR Activity Increases the Lateral Diffusion of GABAAR γ2 Subunits in the Presence of Calcineurin Activity QD-SPT tracking of GABAAR γ2 subunits in hippocampal neurons. (A, E, I, M, and Q) Examples show QD trajectories (green), reconstructed from recording sequences (15.2 s for I and 38.4 s for others), overlaid with FM4-64 signals (gray) in order to identify synapses. Scale bars, 5 μm. (B, F, J, N, and R) Quantifications of median diffusion coefficients are shown (median D ± 25%–75% Interquartile Range [IQR]). (C, G, K, O, and S) The mean (±SEM) synaptic dwell time is shown. (D, H, L, P, and T) Size of confinement domains is shown (mean ± SEM). (A–H) Tracking of QD-bound GABAAR γ2 subunits in neurons exposed to IP3R blocker 2APB for 0–30 (A–D) or 60–90 (E–H) min. Note that exploration and diffusion coefficient of GABAAR increased after 2APB application (A, B, E, and F). In contrast, the mean synaptic dwell time (C and G) and size of confinement domains (D and H) decreased and increased, respectively, only after 60 min, but not before 30 min of drug treatment. (I–L) Increased diffusion and reduced synaptic confinement in IP3R1KO neurons (KO) compared with WT, analyzed at 15–18 DIV. (M–P) The blockade of group I mGluRs also led to an increase in diffusion of GABAAR. (Q–T) Neurons were exposed to 2APB in the absence or presence of the calcineurin inhibitor Cyclosporin A (CysA) and FK506. Both CysA and FK506 prevented the 2APB-dependent increase in GABAAR diffusion. NS, p > 0.05; p < 0.05, ∗∗p < 0.01, ∗∗∗p < 0.005; Mann-Whitney U-test (B, F, J, N, and R) and Welch’s t-test for others. Numbers of QDs analyzed are shown in Table S1. See also Figures S5 and S6.
Figure 6
Figure 6
IICR Activity Regulates the Expression Level and Clustering of Ca2+-Dependent PKC (A) Protein expression levels of α, β2, and γ PKC subtypes and GABAAR β3 subunit after 60-min exposure of neurons to DMSO or 2APB are shown. (B) Quantification of the PKC/GABAAR β3 subunit protein level ratio showing the PKCγ/GABAAR β3 ratio significantly decreased after 2APB exposure for 60 min. Values (mean ± SEM) were normalized to the respective DMSO control condition (n = 6; ∗∗∗p < 0.005, t-test). (C) Co-staining of GABAAR γ2 subunit and α, β2, or γ PKC subtypes after 60 min of DMSO or 2APB treatment. Arrowheads in upper panels indicate the dendrites enlarged in lower panels. Color codes in lower panels are as follows: green, GABAAR; magenta, α, β2, or γ PKC; and white, GABAAR and PKC colocalized clusters. Scale bars, 10 μm. Note that 2APB decreased the PKC β2 and γ, but not α, isoform immunoreactivities. (D) PKC fluorescence intensity per pixel below GABAAR punctae. Values (mean ± SEM) were normalized to the respective DMSO control condition (n = 30 cells for PKCα and PKCβ2; n = 40 for PKCγ; ∗∗∗p < 0.005, t-test).
Figure 7
Figure 7
Constraint of GABAAR Lateral Diffusion Requires Ca2+-Dependent PKC Activity (A) A diagram showing the time course of the experiment. Drugs were applied as indicated by horizontal bars. (B–E) Blockade of Ca2+-dependent PKC by Gö6976 (60–90 min) enhances GABAAR surface exploration (B, green), diffusion coefficients (C, median D values ± IQR), synaptic escape (D, mean dwell time ± SEM), and size of confinement domain (E, mean ± SEM). (F–I) The PKC activator PMA, but not its inactive form (4α-PMA), prevented the 2APB-induced enhancement of GABAAR mobility (∗∗∗p < 0.005; NS, p > 0.05; Mann-Whitney U-test (C and G) and Welch’s t-test (D, E, H, and I). Numbers of QDs analyzed are shown in Table S1. Scale bars, 5 μm (A and E). (J) Conceptual diagrams showing summary of our finding. Massive Ca2+ influx through NMDAR activates calcineurin (CN), exceeds phosphorylation by PKC, and results in increasing lateral diffusion of GABAAR on the plasma membrane (PM). In contrast, the mGluR/PLC/IICR pathway constitutively activates PKC. This activation of mGluR/IICR/PKC process constrains lateral diffusion of GABAAR, counteracting basal activity of CN. See also Figure S7.

References

    1. Bannai H., Lévi S., Schweizer C., Dahan M., Triller A. Imaging the lateral diffusion of membrane molecules with quantum dots. Nat. Protoc. 2006;1:2628–2634. - PubMed
    1. Bannai H., Lévi S., Schweizer C., Inoue T., Launey T., Racine V., Sibarita J.B., Mikoshiba K., Triller A. Activity-dependent tuning of inhibitory neurotransmission based on GABAAR diffusion dynamics. Neuron. 2009;62:670–682. - PubMed
    1. Berridge M.J. Neuronal calcium signaling. Neuron. 1998;21:13–26. - PubMed
    1. Bouthour W., Leroy F., Emmanuelli C., Carnaud M., Dahan M., Poncer J.C., Lévi S. A human mutation in Gabrg2 associated with generalized epilepsy alters the membrane dynamics of GABAA receptors. Cereb. Cortex. 2012;22:1542–1553. - PubMed
    1. Calamai M., Specht C.G., Heller J., Alcor D., Machado P., Vannier C., Triller A. Gephyrin oligomerization controls GlyR mobility and synaptic clustering. J. Neurosci. 2009;29:7639–7648. - PMC - PubMed

Publication types

LinkOut - more resources