. 2015 Dec 29;13(12):2817-28.
doi: 10.1016/j.celrep.2015.11.050. Epub 2015 Dec 17.

Disrupted PI3K p110δ Signaling Dysregulates Maternal Immune Cells and Increases Fetal Mortality In Mice

Affiliations

Disrupted PI3K p110δ Signaling Dysregulates Maternal Immune Cells and Increases Fetal Mortality In Mice

Jens Kieckbusch et al. Cell Rep. .

Abstract

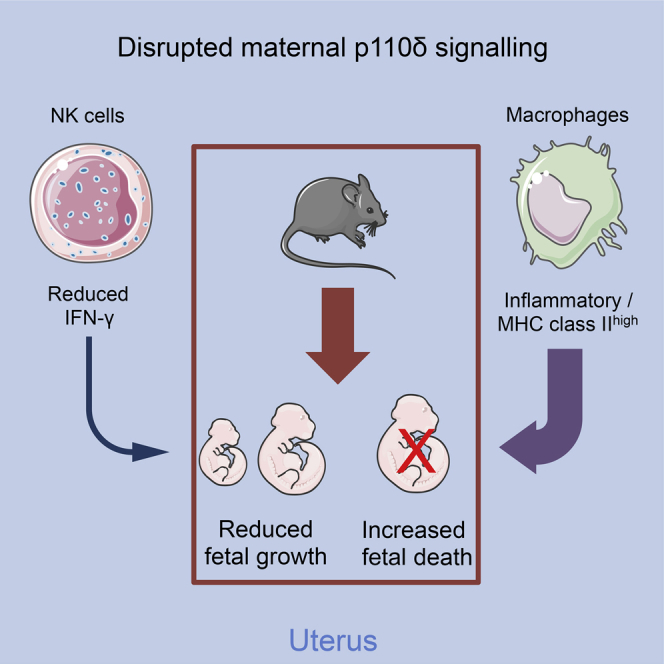
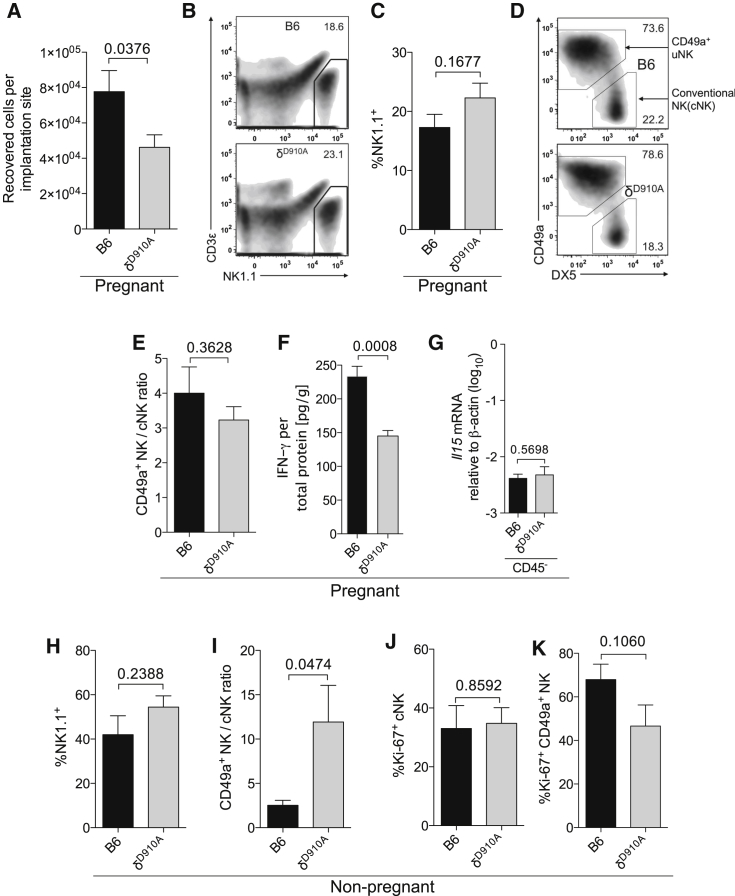
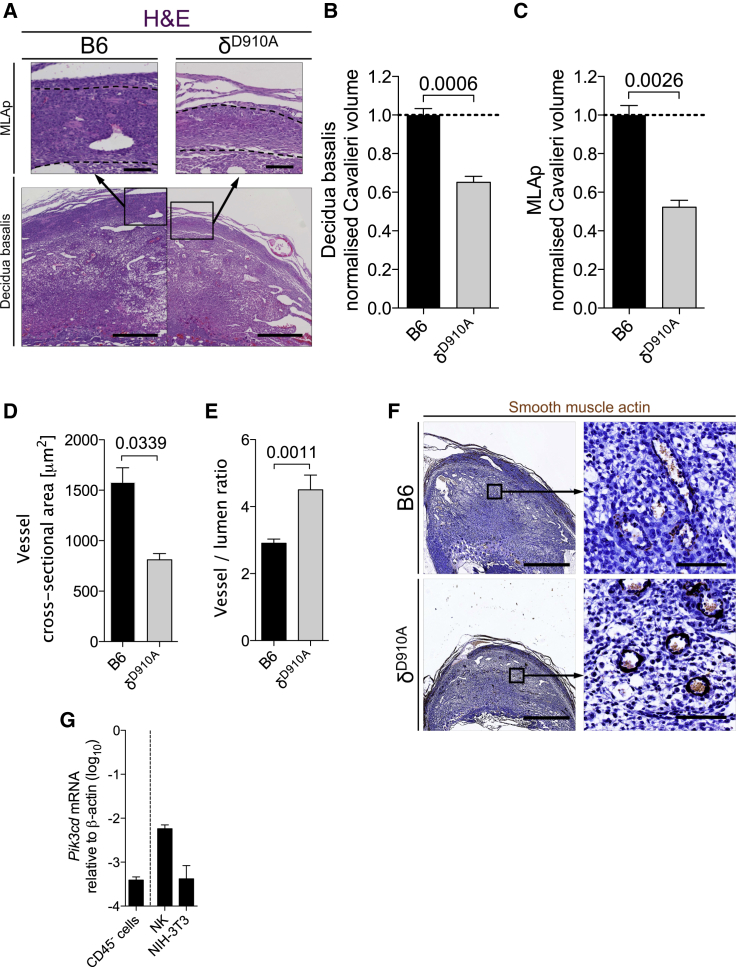
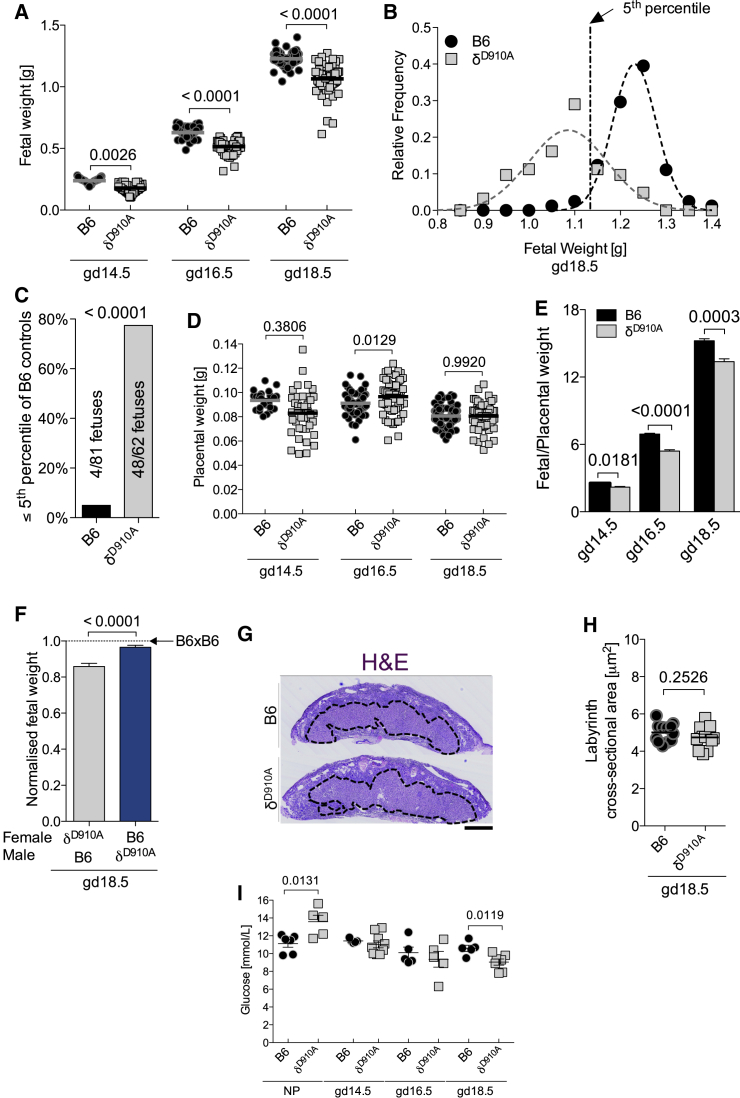
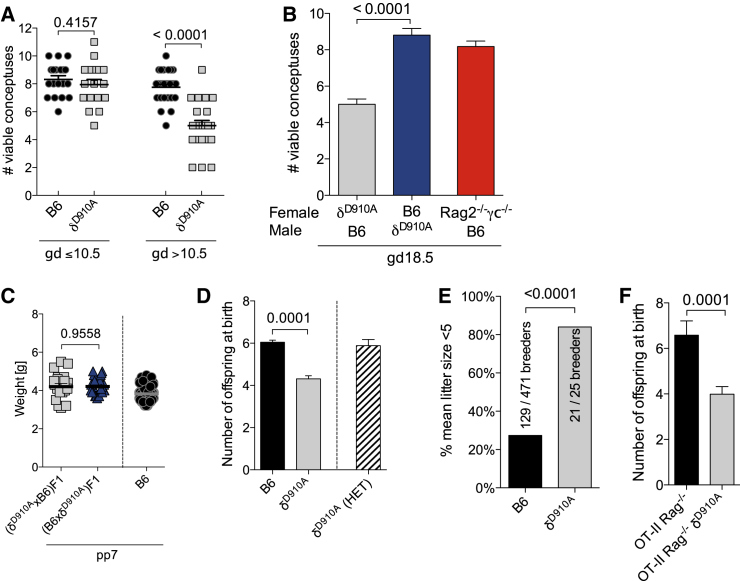
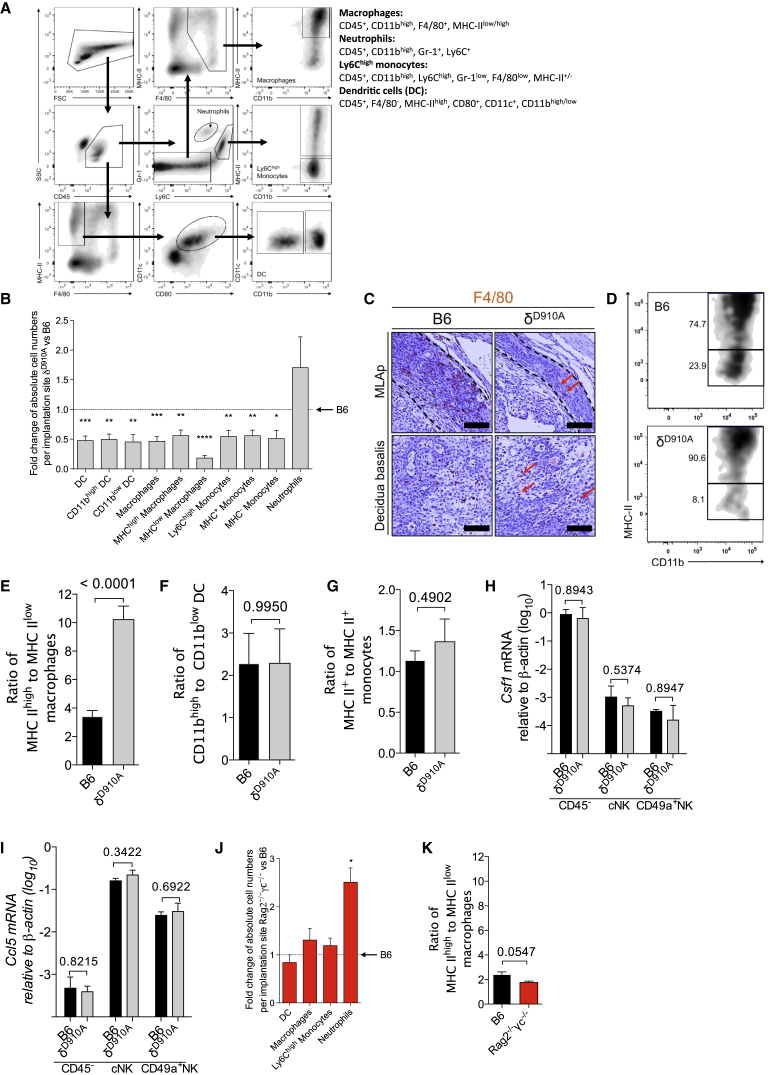
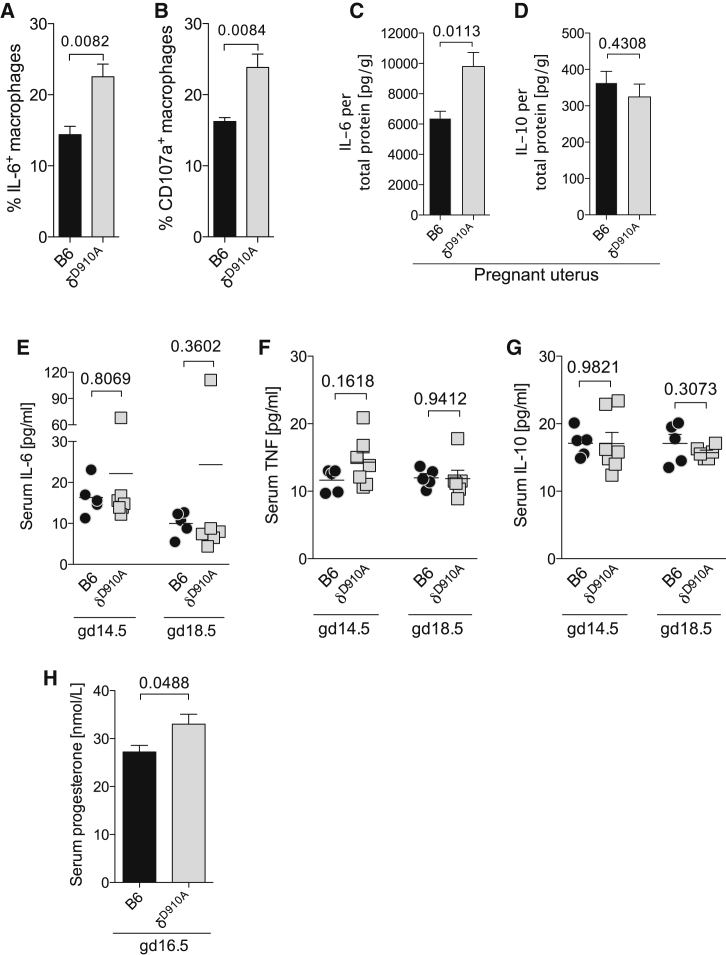
Maternal immune cells are an integral part of reproduction, but how they might cause pregnancy complications remains elusive. Macrophages and their dual function in inflammation and tissue repair are thought to play key yet undefined roles. Altered perinatal growth underpins adult morbidity, and natural killer (NK) cells may sustain fetal growth by establishing the placental blood supply. Using a mouse model of genetic inactivation of PI3K p110δ, a key intracellular signaling molecule in leukocytes, we show that p110δ regulates macrophage dynamics and NK-cell-mediated arterial remodeling. The uterus of dams with inactive p110δ had decreased IFN-γ and MHC class II(low) macrophages but enhanced IL-6. Poor vascular remodeling and a pro-inflammatory uterine milieu resulted in fetal death or growth retardation. Our results provide one mechanism that explains how imbalanced adaptations of maternal innate immune cells to gestation affect offspring well-being with consequence perinatally and possibly into adulthood.


Figures

None
Graphical abstract
Figure 1
Figure 1
Maternal PI3K p110δ Inactivation Affects IFN-γ Production In Utero (A) Recovered live cells per implantation site after enzymatic digestion. (B) Representative density plot of CD3 NK1.1+ cells as a fraction of leukocytes, gated on live CD45+ singlets. (C) Quantification of recovered live CD3 NK1.1+ cells as % of leukocytes (gated as in B). (D) Representative density plot of CD49a and DX5 expression in utero, gated on live CD45+ CD3 NK1.1+ cells. (E) Ratios of CD49a/DX5-positive cells. (F) Assessment of IFN-γ in uterine tissue; n = 5 mice per group. (G) Quantification of Il15 expression in non-hematopoietic cells; n = 3 mice per group. (H–K) Assessment of uNK cells in non-pregnant mice: (H) frequency of NK1.1+ cells, (I) relative contribution of CD49a+ NK and cNK, and their ability to proliferate (J and K). n = 6 mice per group from two independent experiments. Indicated is the maternal genotype. All females were mated with B6 males. p values are from unpaired, two-tailed Student’s t tests. Data in (A), (C), and (E–K) are means ± SEM; n = 6–7 mice from five independent experiments. See also Figures S1 and S2.
Figure 2
Figure 2
Maternal p110δ Inactivation Impedes Normal Decidualization and Arterial Remodeling (A) H&E staining of gd9.5 uterine tissue shows smaller MLAp (top) and decidual (bottom) areas in δD910A females. Scale bars represent 100 μm (top) and 500 μm (bottom). Dashed line demarcates the boundaries between MLAp and surrounding tissues. (B and C) Volume estimation of decidual and MLAp compartments using the Cavalieri method. (D and E) Quantification of vessel size (D) and vessel/lumen ratio as readout for vascular remodeling (E). Data are representative of four litters with n = 13–14 implantation sites. (F) Smooth muscle actin staining shows incomplete vascular remodeling in the absence of maternal p110δ signaling. Scale bar, 100 μm. Indicated is the maternal genotype and all females were mated with B6 males. p values for the effect of maternal genotype from a mixed model approach, taking the clustering of observations by litter into account. (G) Relative expression of the gene coding for p110δ (pik3cd) in non hematopoietic CD45 cells and NK cells (positive control) as well as the NIH 3T3 fibroblast cell line (negative control). n = 3 mice per group. All data are presented as means ± SEM. MLAp, mesometrial lymphoid aggregate of pregnancy.
Figure 3
Figure 3
Maternal p110δ Is Required for Normal Fetal Growth (A) Fetal weights of conceptuses from either B6 of δD910A females mated with B6 males (means ± SEM). Data are from 9–14 litters per maternal genotype per time point. (B and C) Analysis of the distribution of fetuses from B6 of δD910A females. Data are from of 13 or 14 litters, dashed line shows fitted Gaussian distribution. p value from Fisher’s exact test comparing the fraction of growth restricted fetuses (weights within or below the fifth percentile of controls). (D) Placental weights of conceptuses from either B6 of δD910A females mated with B6 males (means ± SEM). Data are from 9–14 litters per maternal genotype per time point. (E) Ratio of fetal/placental weight from (B) and (D) showing placental efficiency. (F) Comparison of fetal weight between isogenic fetuses from the depicted crosses normalized to B6 controls (mean ± SEM). Data from 4–14 litters. (A, D, E, and F) p values for the effect of maternal genotype from a mixed model approach taking the clustering of observations by litter into account. (G) H&E stainings of placentas at gd18.5 show no overt differences in the maternal/fetal exchange region (labyrinth, dashed line). Scale bar, 1 mm. (H) Quantification of cross-sectional area of labyrinth zone in gd18.5 placentas. Data representative of 12 placentas from four litters per cross (means ± SEM). (I) Non-fasting blood glucose levels prior to and during pregnancy. Data are means ± SEM (H and I); p values are from unpaired, two-tailed Student’s t tests.
Figure 4
Figure 4
Fetal Death and Accelerated Postpartum Growth in the Absence of Maternal p110δ Signaling (A) Assessment of the number of viable implantation sites in litters from females of the depicted genotype mated with B6 males before and after midgestation; n = 17–29 litters. (B) Assessment of the number of viable implantation sites of the indicated crosses; n = 5–14 litters per group. (C) Comparison of isogenic offspring from matings with maternal or paternal p110δ inactivation. Data are from six to eight litters per parental cross. (D) Summary of breeding records showing the mean litter size of breeding females at birth (indicated is the maternal genotype). Data are means ± SEM; p values are from unpaired, two-tailed Student’s t tests. (E) Quantification of the fraction of multiparous breeders with a mean litter size <5. p values are from Fisher’s exact test. (F) Assessment of offspring survival in δD910A mice lacking B cells and T cells that can recognize fetal antigens; n = 31–60 litters per group. Data are means ± SEM; p values are from unpaired, two-tailed Student’s t tests. Data in (D) and (E) are representative of 25 and 471 breeders, respectively, corresponding to 102–1,055 litters. See also Figure S3.
Figure 5
Figure 5
Maternal p110δ Signaling Prevents Uterine Inflammation (A) Gating strategy for identifying macrophages, dendritic cells (DC), Ly6Chigh monocytes, and neutrophils at gd10.5. (B) Fold change of absolute cell numbers per implantation site of the indicated populations in δD910A females compared to B6 controls. Data are means ± SEM; p values compare the cell number in δD910A with the mean of controls. (C) Histological examination of abundance of F4/80+ cells in MLAp (top) and decidua basalis (bottom) of sections from gd9.5 pregnant females. Scale bars, 100 μm. (D) Representative density plots showing MHC-II expression of uterine macrophages gated as in (A). (E) Relative abundance of MHC class IIhigh versus MHC class IIlow macrophage populations. (F) Relative abundance of CD11bhigh and CD11blow DC subsets. (G) Relative abundance of MHC class II+ versus MHC class II Ly6Chigh monocyte populations. Data are representative of five experiments using n = 6–7 mice per group. (H and I) Relative mRNA quantification for Csf1 (H) and Ccl5 (I); n = 3 mice per group. (J) Fold change of absolute cell numbers per implantation site of the indicated populations in Rag2−/−γc−/− females compared to B6 controls. p values compare the cell number in Rag2−/−γc−/− with the mean of controls. (K) Relative abundance of MHC class IIhigh versus MHC class IIlow macrophage populations. Data are means ± SEM; n = 4–6 mice per group. p values are from an unpaired, two-tailed Student’s t test.
Figure 6
Figure 6
Local, but Not Systemic, Inflammation Underpins Fetal Growth Restriction and Demise (A–D) Flow cytometry staining for intracellular IL-6 (A) and surface CD107a (B) on macrophages (adherent CD45+ CD11b+ F4/80+ cells) at gd10.5 after overnight culture. Data are from three independent experiments; n = 4 mice per group. (C) Quantification of tissue IL-6 and (D) IL-10; n = 5 mice per group. (E–H) Assessment of serum IL-6 (E), TNF (F), IL-10 (G), and progesterone (H); n = 5–7 per group. Data are means ± SEM; p values are from an unpaired, two-tailed Student’s t test.

Similar articles

Cited by

References

    1. Aksoy E., Taboubi S., Torres D., Delbauve S., Hachani A., Whitehead M.A., Pearce W.P., Berenjeno I.M., Nock G., Filloux A. The p110δ isoform of the kinase PI(3)K controls the subcellular compartmentalization of TLR4 signaling and protects from endotoxic shock. Nat. Immunol. 2012;13:1045–1054. - PMC - PubMed
    1. Ali K., Soond D.R., Piñeiro R., Hagemann T., Pearce W., Lim E.L., Bouabe H., Scudamore C.L., Hancox T., Maecker H. Inactivation of PI(3)K p110δ breaks regulatory T-cell-mediated immune tolerance to cancer. Nature. 2014;510:407–411. - PMC - PubMed
    1. Ashkar A.A., Croy B.A. Interferon-gamma contributes to the normalcy of murine pregnancy. Biol. Reprod. 1999;61:493–502. - PubMed
    1. Ashkar A.A., Croy B.A. Functions of uterine natural killer cells are mediated by interferon gamma production during murine pregnancy. Semin. Immunol. 2001;13:235–241. - PubMed
    1. Ashkar A.A., Di Santo J.P., Croy B.A. Interferon gamma contributes to initiation of uterine vascular modification, decidual integrity, and uterine natural killer cell maturation during normal murine pregnancy. J. Exp. Med. 2000;192:259–270. - PMC - PubMed

Publication types

MeSH terms

LinkOut - more resources