Structural basis for receptor recognition and pore formation of a zebrafish aerolysin-like protein
- PMID: 26711430
- PMCID: PMC5290818
- DOI: 10.15252/embr.201540851
Structural basis for receptor recognition and pore formation of a zebrafish aerolysin-like protein
Abstract
Various aerolysin-like pore-forming proteins have been identified from bacteria to vertebrates. However, the mechanism of receptor recognition and/or pore formation of the eukaryotic members remains unknown. Here, we present the first crystal and electron microscopy structures of a vertebrate aerolysin-like protein from Danio rerio, termed Dln1, before and after pore formation. Each subunit of Dln1 dimer comprises a β-prism lectin module followed by an aerolysin module. Specific binding of the lectin module toward high-mannose glycans triggers drastic conformational changes of the aerolysin module in a pH-dependent manner, ultimately resulting in the formation of a membrane-bound octameric pore. Structural analyses combined with computational simulations and biochemical assays suggest a pore-forming process with an activation mechanism distinct from the previously characterized bacterial members. Moreover, Dln1 and its homologs are ubiquitously distributed in bony fishes and lamprey, suggesting a novel fish-specific defense molecule.
Keywords: crystal structure; electron microscopy reconstruction; high‐mannose glycan; pore‐forming protein; vertebrate.
© 2015 The Authors.
Figures

Cartoon representation of the Dln1 dimer (
PDB 4ZNO ). Subunit A is colored in gray. The lectin module of subunit B is colored in yellow, whereas the middle and C‐terminal moieties of the aerolysin module are colored in hot pink and green, respectively. The pre‐stem hairpin is colored in blue. The bound sucrose molecules are shown as light pink sticks.The dimeric interface. Residues involved in dimeric interactions are shown as sticks.
Multiple‐sequence alignment of the pre‐stem hairpin (the putative transmembrane region) from different aerolysin members. The members include Dln1, the earthworm Eisenia foetida lysenin, the mushroom Laetiporus sulphureus lectin (
LSL ), and Aeromonas hydrophila aerolysin. The alignment is generated according to the alternating pattern of hydrophilic and hydrophobic residues by GeneDoc. The hydrophilic and hydrophobic residues are marked in hot pink and gray, respectively.


- A
A close‐up view of the sucrose‐binding pocket. The hydrogen‐bonding residues with sucrose are shown as yellow sticks, and the sucrose molecule is shown as light pink stick.
- B
The glycan binding profile of Dln1. This profile represents
FITC ‐labeled Dln1 at 200 μg/ml screened against 609 printed glycans on Mammalian Printed Array version 5.2 in replicates of six. A list of top 8 hits reacted with a concentration of 200 μg/ml is shown in Appendix Table S1. The two kinds of Dln1‐binding glycan structures (No. 214 and 316) are depicted schematically. - C, D
Close‐up views of Manα1‐2Man‐ and Manα1‐3Man‐binding sites. The mannobiose molecules are shown as cyan and gray sticks, respectively. The |Fo|‐|Fc| electron density maps of disaccharides and the disaccharide‐binding sites are shown as gray mesh and countered at 3.0 σ. The hydrogen‐bonding residues are shown as yellow sticks. Polar interactions with the mannobiose are shown as dashed lines.

- A, B
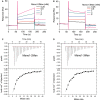
The steady‐state equilibrium curves of Dln1 against Manα1‐2Man and Manα1‐3Man. The binding affinity of Dln1 toward Manα1‐2Man or Manα1‐3Man was calculated from the data at a sugar concentration of 0.25–4 mM. The fit of model to the data was determined with a χ2 value of 0.206 and 0.459, respectively. Manα1‐2Man and Manα1‐3Man bind to Dln1 at an equilibrium dissociation constant (K d) of 0.85 and 1.65 mM, respectively.
- C, D
Raw and fit
ITC isotherms for Manα1‐2Man and Manα1‐3Man titrated into Dln1. The top panel represents the raw data for the mannobiose titrated into Dln1 solutions and the bottom shows the processed binding isotherms calculated by using the best‐fit parameters for single binding site model. The K d values are 0.93 mM for Manα1‐2Man and 0.57 mM for Manα1‐3Man, respectively.

- A, B
ELISA of Dln1 toward glycosylated gp120 or yeast mannan. BSA was used as the control. Points are averages (± standard error of the mean) of triplicate determinations. - C
Binding of
FITC ‐labeled Dln1 and D135A mutant to Saccharomyces cerevisiae cells. Scale bar, 5 μm. - D
Immunoblot analysis of Dln1 and D135A mutant after incubating with S. cerevisiae cells. The observed bands represent the cell‐bound protein after extensive washing of the yeast cells. The bands corresponding to the monomer and oligomer are highlighted black arrows.

- A
Oligomerization of Dln1 in the presence of S. cerevisiae mannan or liposomes at different
pH values. Histograms are averages (± standard error of the mean) of triplicate determinations. - B, C
Dye release velocity from the liposomes in the presence of Dln1 at different concentrations, and various
pH values. Liposomes were incubated with Dln1 of different concentrations atpH 5.5 and 1 μM Dln1 at variouspH values, respectively. - D
Oligomerization of Dln1M5 with or without liposomes at different
pH values. All samples for electrophoresis were prepared with boiling at 95°C for 5 min, and the comparative gels were processed in parallel. The oligomer band was quantified by ImageJ software using the marker band as a sample processing control. TheSDS –PAGE profiles of Dln1 oligomerization are shown in Appendix Fig S4. Histograms are averages (± standard error of the mean) of triplicate determinations. - E
Liposomes were treated with Dln1M5 or Dln1 of different concentrations at a fixed
pH value of 5.5. - F
The inhibition of dye release in presence of 0.5 μM Dln1M5 and 25 mM polyethylene glycols (
PEG ) of different molecular weights at a fixedpH value of 5.5. Dye efflux was monitored in a period of 1,400 s. Triton X‐100 at 0.1% was added to completely disrupt liposomes. Dye efflux was measured as a percentage to the maximal release upon addition of Triton X‐100. Carboxyfluorescein was loaded in the liposomes for the detection of dye efflux.

- A
Negative‐stain electron microscopy image of Dln1M5 in the presence of liposomes.
- B
Side views of Dln1M5 oligomers attached to the membrane of liposomes. The inset represents the respective class averages.
- C, D
Transmission electron microscope micrograph of dispersed ring‐like structures of Dln1M5 or Dln1D135A oligomers on lipid monolayer. The inset represents a few 2D class averages showing the octamer pattern from some individual rings.
- E
EM picture of a negatively stained 2D crystal of Dln1M5 on the lipid monolayer. The inset represents the computed diffraction pattern Fourier transform of the image. - F
Projection map with a P4 symmetry.
- G
The top, side, and cut‐open views of the 3D reconstruction of Dln1M5 octamer at 20 Å resolution are shown as gray surface representation. The surface of the membrane is indicated by dashed lines.

Top and side views of eight lectin modules docked to the 20‐Å
EM map. Due to the moderate resolution of theEM map, the flexible aerolysin module cannot be fit in the map. It is important to notice that this model is only a hypothetical fit. Each pair of the lectin modules is colored in yellow and orange, respectively. The β‐barrel of γ‐hemolysin (PDB 3B07) was used to mimic the β‐barrel backbone of Dln1. The position of the cell membrane is indicated by dashed lines.B‐factor of Dln1 subunit B. The mobility is represented by coil thickness from thin (low) to thick (high) and color from blue (low) to red (high). Notably, the pre‐stem hairpin and distal moiety of aerolysin module are particularly mobile.
Position of Cα atoms along
MD simulations of the apo‐form (red) and the pre‐stem hairpin extraction form (blue) are shown with the lectin modules superimposed (200 structures for each).


Comparison of the Dln1 structures at
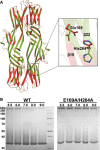
pH 5.3 (5DIO , red) andpH 7.5 (4ZNQ , green).Oligomerization of Dln1 and Dln1E169A‐H234A in the presence of yeast mannan at different
pH values.
References
-
- Bischofberger M, Gonzalez MR, van der Goot FG (2009) Membrane injury by pore‐forming proteins. Curr Opin Cell Biol 21: 589–595 - PubMed
-
- Parker MW, Feil SC (2005) Pore‐forming protein toxins: from structure to function. Prog Biophys Mol Biol 88: 91–142 - PubMed
-
- Iacovache I, Bischofberger M, van der Goot FG (2010) Structure and assembly of pore‐forming proteins. Curr Opin Struct Biol 20: 241–246 - PubMed
-
- Kroemer G, Galluzzi L, Brenner C (2007) Mitochondrial membrane permeabilization in cell death. Physiol Rev 87: 99–163 - PubMed
-
- Lashuel HA, Lansbury PT Jr (2006) Are amyloid diseases caused by protein aggregates that mimic bacterial pore‐forming toxins? Q Rev Biophys 39: 167–201 - PubMed
Publication types
MeSH terms
Substances
Grants and funding
LinkOut - more resources
Full Text Sources
Other Literature Sources
Molecular Biology Databases

